Sometimes, we'd like to show multiple graphs to compare them or simply to show multiple data sets at the same time. Let's do some modifications to allow two graphs at the same time in our graph custom view. It can be further extended to support even more graphs, but let's limit it to two to simplify the logic in this example.
First, we need to create different Paint and Path objects for each graph. We'll create arrays to store them as it'll be easier, later on, to iterate and render them. For example, we can create several Paint objects with different colors for each graph:
linePaint = new Paint[2];
linePaint[0] = new Paint();
linePaint[0].setAntiAlias(true);
linePaint[0].setColor(0xffffffff);
linePaint[0].setStrokeWidth(8.f);
linePaint[0].setStyle(Paint.Style.STROKE);

linePaint[1] = new Paint();
linePaint[1].setAntiAlias(true);
linePaint[1].setColor(0xff4040ff);
linePaint[1].setStrokeWidth(8.f);
linePaint[1].setStyle(Paint.Style.STROKE);
circlePaint = new Paint[2];
circlePaint[0] = new Paint();
circlePaint[0].setAntiAlias(true);
circlePaint[0].setColor(0xffff2020);
circlePaint[0].setStyle(Paint.Style.FILL);
circlePaint[1] = new Paint();
circlePaint[1].setAntiAlias(true);
circlePaint[1].setColor(0xff20ff20);
circlePaint[1].setStyle(Paint.Style.FILL);
Actually, it's a lot of work to set the same parameters again and again, so we can use another constructor from Paint that copies the attributes from an already existing Paint object:
linePaint = new Paint[2];
linePaint[0] = new Paint();
linePaint[0].setAntiAlias(true);
linePaint[0].setColor(0xffffffff);
linePaint[0].setStrokeWidth(8.f);
linePaint[0].setStyle(Paint.Style.STROKE);

linePaint[1] = new Paint(linePaint[0]);
linePaint[1].setColor(0xff4040ff);

circlePaint = new Paint[2];
circlePaint[0] = new Paint();
circlePaint[0].setAntiAlias(true);
circlePaint[0].setColor(0xffff2020);
circlePaint[0].setStyle(Paint.Style.FILL);

circlePaint[1] = new Paint(circlePaint[0]);
circlePaint[1].setColor(0xff20ff20);
Also, the Path objects and the data storage:
graphPath = new Path[2];
graphPath[0] = new Path();
graphPath[1] = new Path();

circlePath = new Path[2];
circlePath[0] = new Path();
circlePath[1] = new Path();

dataPoints = (ArrayList<Float>[]) new ArrayList[2];
We had also need a mechanism to add data to a specific data set:
public void setDataPoints(ArrayList<Float> originalData, int index) {
    dataPoints[index] = new ArrayList<Float>();
    dataPoints[index].addAll(originalData);

    adjustDataRange();
}
As we will have different data sets, we've to calculate the minimum and maximum values of all data sets. We will be using the same scale on each graph so it will be easier to compare:
private void adjustDataRange() {
    minValue = Float.MAX_VALUE;
    maxValue = Float.MIN_VALUE;
    for (int j = 0; j < dataPoints.length; j++) {
        for (int i = 0; dataPoints[j] != null && i <
        dataPoints[j].size(); i++) {
            if (dataPoints[j].get(i) < minValue) minValue =
            dataPoints[j].get(i);
            if (dataPoints[j].get(i) > maxValue) maxValue =
            dataPoints[j].get(i);
        }
    }

    verticalDelta = maxValue - minValue;

    regenerate = true;
    postInvalidate();
}
Finally, we need to update the getDataPoint() method to allow us to get data from different data sets:
private float getDataPoint(int i, int index) {
    float data = (dataPoints[index].get(i) - minValue) / verticalDelta;
    return invertVerticalAxis ? 1.f - data : data;
}
With all these methods, we can update our path generation code to generate multiple Paths. If the data set for that graph is not defined, it'll not generate the Path.
for (int j = 0; j < 2; j++) {
    if (dataPoints[j] != null) {
        float x = leftPadding;
        float y = height * getDataPoint(0, j) + topPadding;

        graphPath[j].moveTo(x, y);
        circlePath[j].addCircle(x, y, 10, Path.Direction.CW);

        for (int i = 1; i < dataPoints[j].size(); i++) {
            x = width * (((float) i + 1) / dataPoints[j].size()) +
            leftPadding;
            y = height * getDataPoint(i, j) + topPadding;

            graphPath[j].lineTo(x, y);
            circlePath[j].addCircle(x, y, 10, Path.Direction.CW);
        }
    }
}
The rendering code, which is just iterating through all the generated Paths and drawing them with their correspondent Paint objects:
for (int j = 0; j < graphPath.length; j++) {
    canvas.drawPath(graphPath[j], linePaint[j]);
    canvas.drawPath(circlePath[j], circlePaint[j]);
}
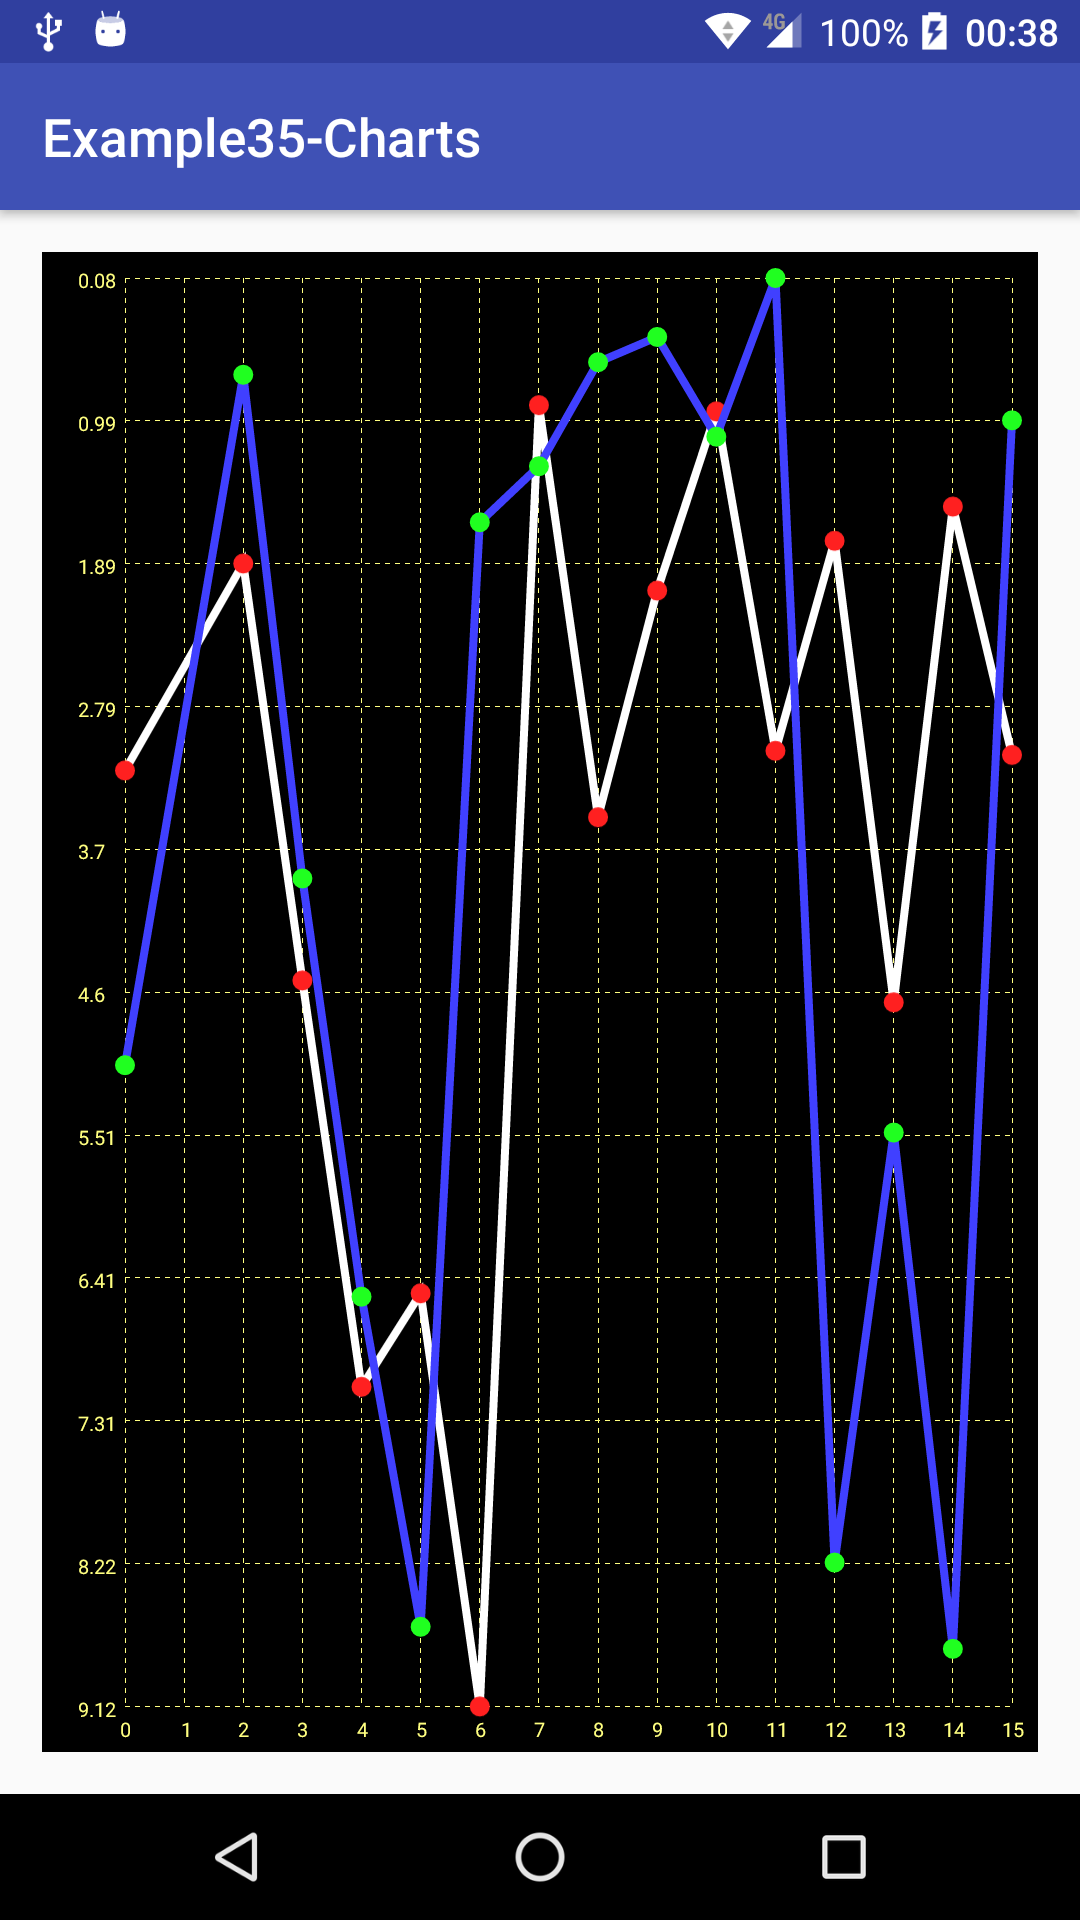
If we run this example with two sets of random data, we'll see something similar to the following screen: