Let's add it into an Android project to see the results. First let's create a very simple layout file:
<?xml version="1.0" encoding="utf-8"?>
<LinearLayout xmlns:android="http://schemas.android.com/apk/res/android"
    xmlns:tools="http://schemas.android.com/tools"
    android:layout_width="match_parent"
    android:layout_height="match_parent"
    xmlns:app="http://schemas.android.com/apk/res-auto"
    tools:context="com.rrafols.packt.chart.MainActivity">

    <com.rrafols.packt.chart.Chart
        android:layout_margin="16dp"
        android:padding="10dp"
        android:id="@+id/chart_view"
        android:layout_width="match_parent"
        android:layout_height="match_parent" />

</LinearLayout>
Let's also create an empty activity that will only set this layout file as the content View and generate some random data for our chart component to render:
@Override
protected void onCreate(Bundle savedInstanceState) {
   super.onCreate(savedInstanceState);
   setContentView(R.layout.activity_main);

   Chart chart = (Chart) findViewById(R.id.chart_view);

   float[] data = new float[20];
   for (int i = 0; i < data.length; i++) {
       data[i] = (float) Math.random() * 10.f;
   }

   chart.setDataPoints(data);
}
If we run this example, we'll get the following screen:
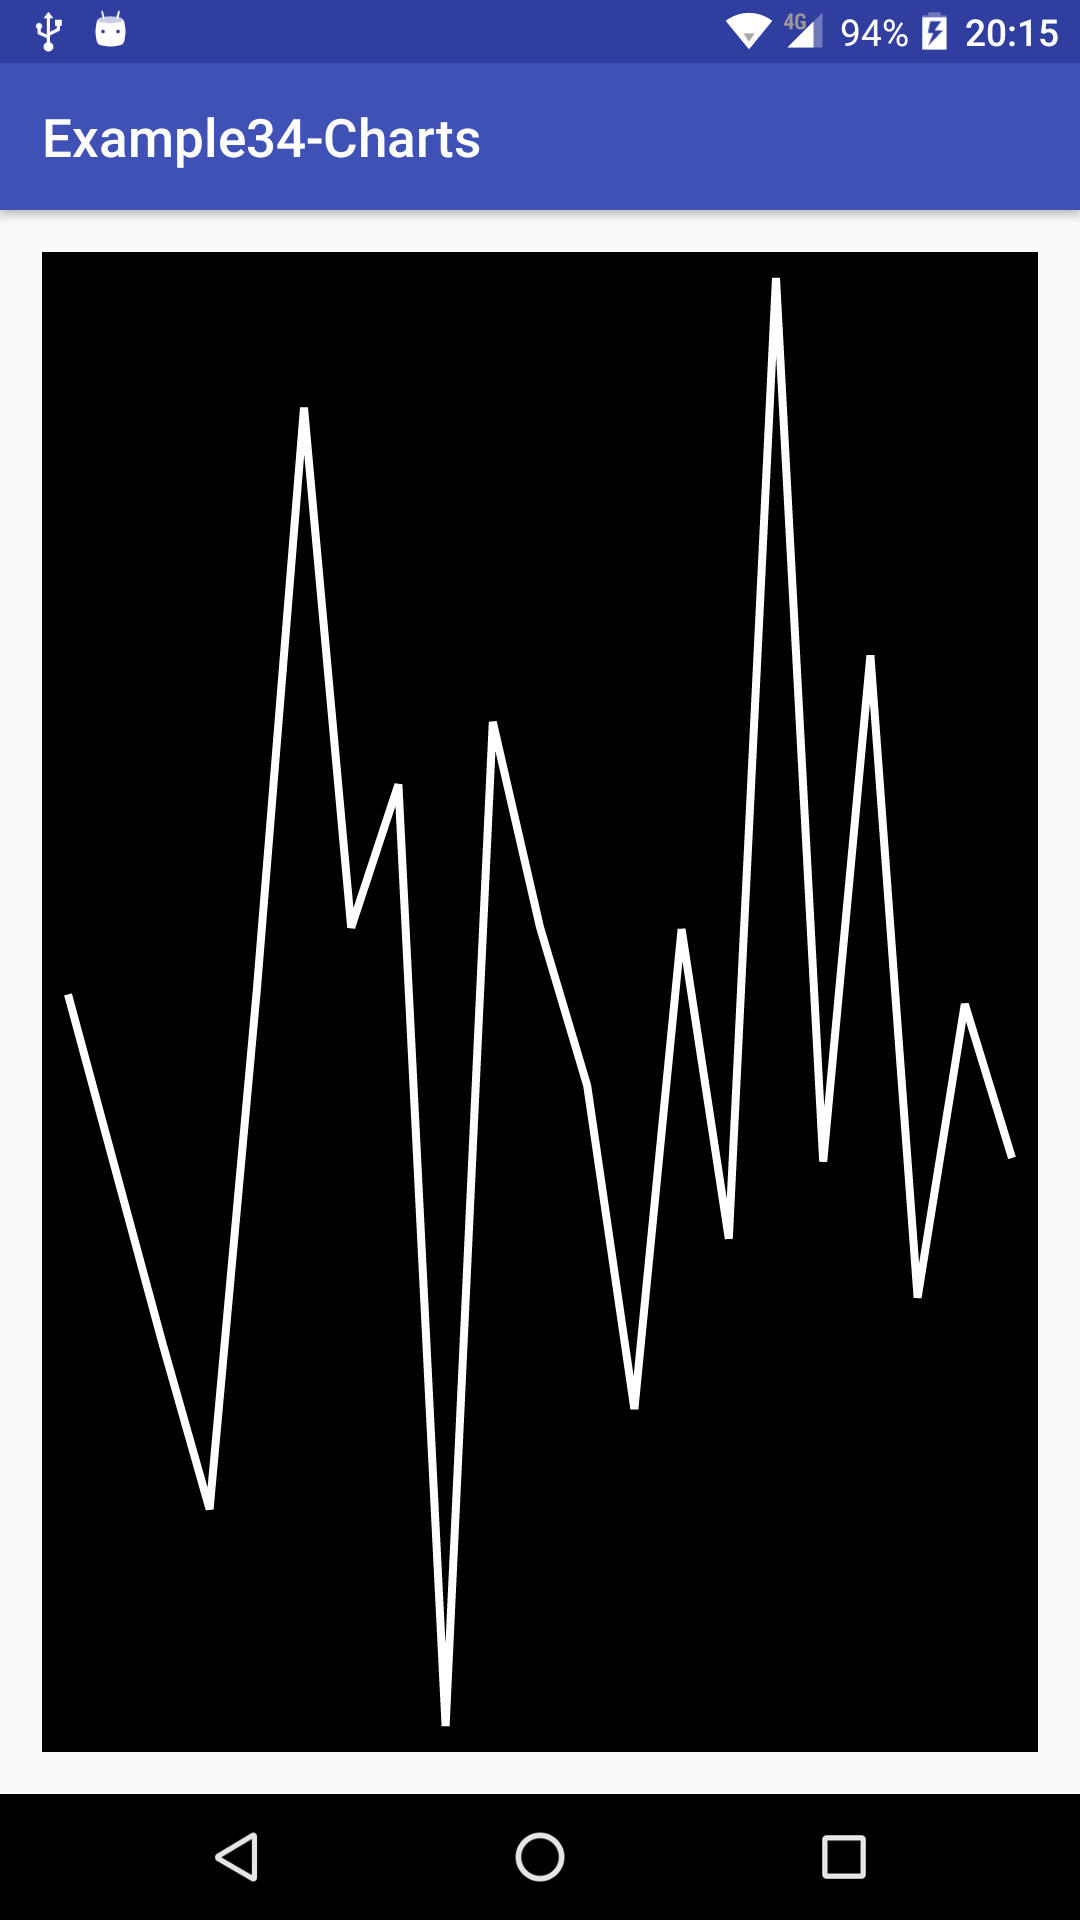
OK, we've a simple implementation done, but let's add some details. We'll start by adding a small dot on each data point for improved clarity. Let's create a new Paint object on our class constructor for that:
circlePaint = new Paint();
circlePaint.setAntiAlias(true);
circlePaint.setColor(0xffff2020);
circlePaint.setStyle(Paint.Style.FILL);
Now, one approach to do so, is to create an additional Path that will draw small circles on each data point. Using the same approach as we did for the line Path, we'll create an instance of the circlePath on the class constructor and reset it whenever it has to be regenerated. As we're calculating the coordinates for the lines, we can reuse them as the location of the circles:
@Override
protected void onDraw(Canvas canvas) {
    canvas.drawARGB(255,0 ,0 ,0);

    float leftPadding = getPaddingLeft();
    float topPadding = getPaddingTop();

    float width = canvas.getWidth() - leftPadding - getPaddingRight();
    float height = canvas.getHeight() - topPadding -
    getPaddingBottom();

    if (lastWidth != width || lastHeight != height) {

        regenerate = true;

        lastWidth = width;
        lastHeight = height;
    }

    if (regenerate) {
        circlePath.reset();
        graphPath.reset();

        float x = leftPadding;
        float y = height * dataPoints[0] + topPadding;

        graphPath.moveTo(x, y);
        circlePath.addCircle(x, y, 10, Path.Direction.CW);

        for (int i = 1; i < dataPoints.length; i++) {
            y = height * dataPoints[i] + topPadding;
            x = width * (((float) i + 1) / dataPoints.length) +
            leftPadding;

            graphPath.lineTo(x, y);
            circlePath.addCircle(x, y, 10, Path.Direction.CW);
        }

        regenerate = false;
    }

    canvas.drawPath(graphPath, linePaint);
    canvas.drawPath(circlePath, circlePaint);
}
In this example, we've hard coded the radius of the circle to 10, just a bit bigger than the thickness of the lines: 8, but we'll talk about customizations later on this chapter.
If we now run this example, we'll see the difference from our previous version:
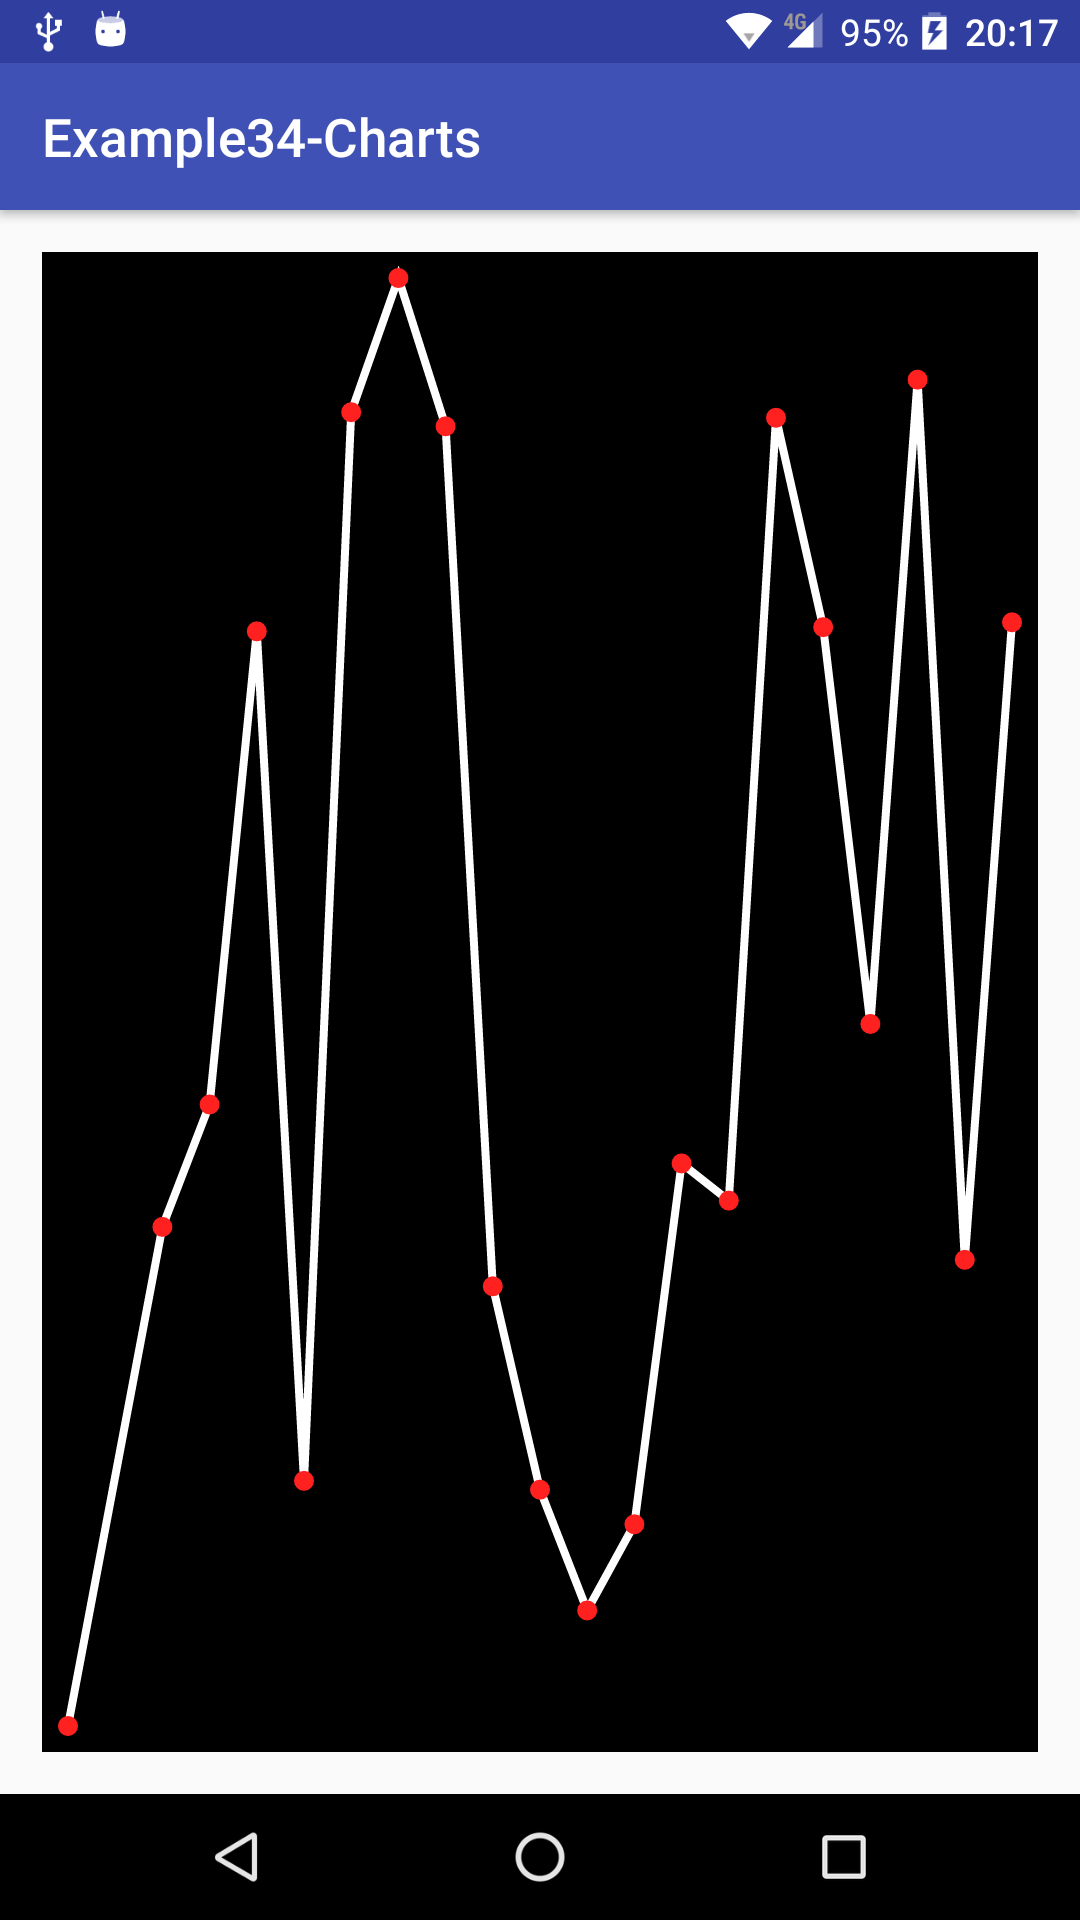
To add a more visual reference, let's also add some background lines. As it will be drawn using different settings, let's first create a new Paint object:
backgroundPaint = new Paint();
backgroundPaint.setColor(0xffBBBB40);
backgroundPaint.setStyle(Paint.Style.STROKE);
backgroundPaint.setPathEffect(new DashPathEffect(new float[] {5, 5}, 0));
Now, let's modify the onDraw() method to also generate a new Path with the background lines:
@Override
protected void onDraw(Canvas canvas) {
    canvas.drawARGB(255,0 ,0 ,0);

    float leftPadding = getPaddingLeft();
    float topPadding = getPaddingTop();

    float width = canvas.getWidth() - leftPadding - getPaddingRight();
    float height = canvas.getHeight() - topPadding -
    getPaddingBottom();

    if (lastWidth != width || lastHeight != height) {
        regenerate = true;

        lastWidth = width;
        lastHeight = height;
    }

    if (regenerate) {
        circlePath.reset();
        graphPath.reset();
        backgroundPath.reset();

        for (int i = 0; i <= dataPoints.length; i++) {
            float xl = width * (((float) i) / dataPoints.length) +
            leftPadding;
            backgroundPath.moveTo(xl, topPadding);
            backgroundPath.lineTo(xl, topPadding + height);
        }

        for (int i = 0; i <= 10; i++) {
            float yl = ((float) i / 10.f) * height + topPadding;
            backgroundPath.moveTo(leftPadding, yl);
            backgroundPath.lineTo(leftPadding + width, yl);
        }

        float x = leftPadding;
        float y = height * dataPoints[0] + topPadding;

        graphPath.moveTo(x, y);
        circlePath.addCircle(x, y, 10, Path.Direction.CW);

        for (int i = 1; i < dataPoints.length; i++) {
            x = width * (((float) i + 1) / dataPoints.length) +
           leftPadding;
            y = height * dataPoints[i] + topPadding;

            graphPath.lineTo(x, y);
            circlePath.addCircle(x, y, 10, Path.Direction.CW);
        }

        regenerate = false;
    }

    canvas.drawPath(backgroundPath, backgroundPaint);
    canvas.drawPath(graphPath, linePaint);
    canvas.drawPath(circlePath, circlePaint);
}
Here, we are creating both horizontal and vertical lines. Horizontal lines will be created at the same exact points there will be a data point. We won't follow the same principle for vertical lines, we'll just draw 10 vertical lines uniformly separated between the top and the bottom of our Canvas. Executing our example now, we'll get something similar to the following screen:
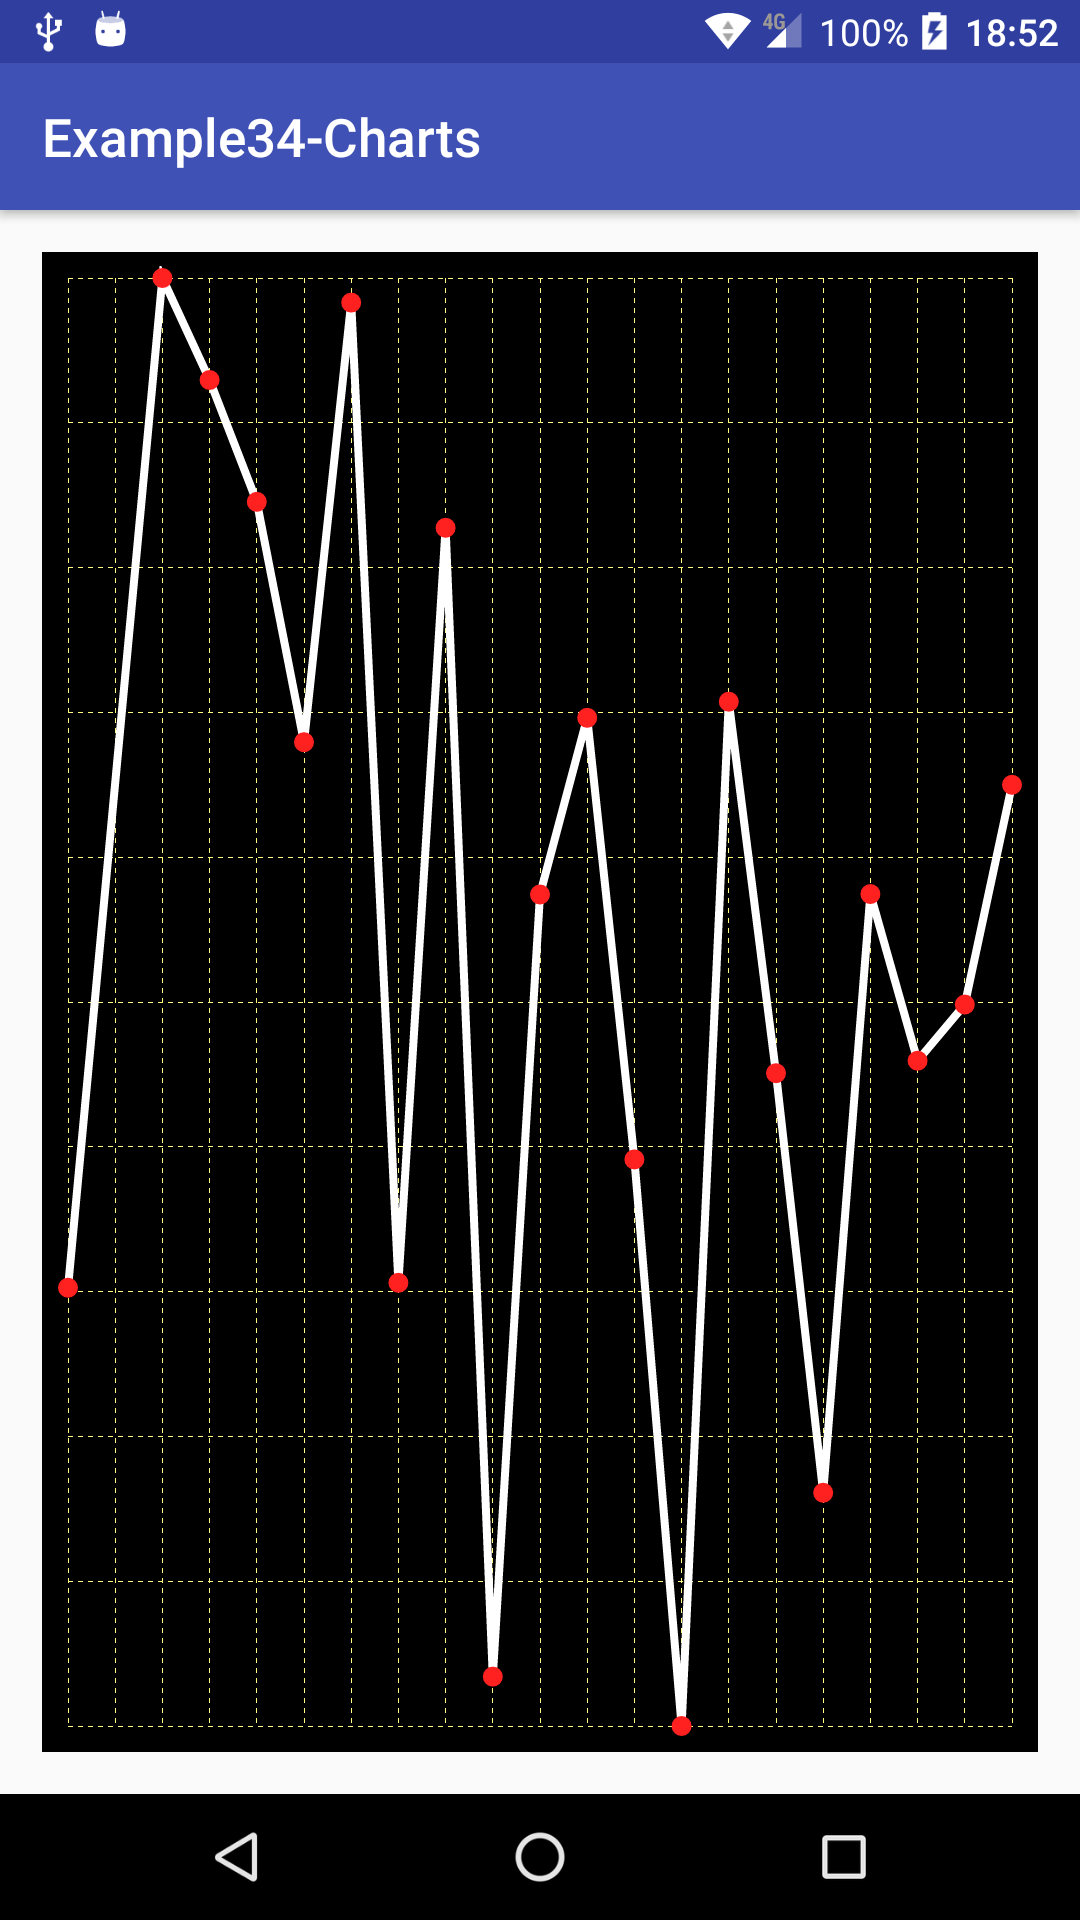
That's alright, but we are still missing some reference points. Let's draw some horizontal and vertical labels.
First, let's create an array of labels and create a method to let anyone using this custom view set them:
private String[] labels;

public void setLabels(String[] labels) {
    this.labels = labels;
}
If they're not set, we can either don't draw anything or generate them ourselves. In this example, we'll generate them ourselves automatically using the array index:
if (labels == null) {
     labels = new String[dataPoints.length + 1];
     for (int i = 0; i < labels.length; i++) {
         labels[i] = "" + i;
     }
 }
To measure the text, so we can center it, we'll reuse a Rect object. Let's create and instantiate it:
private Rect textBoundaries = new Rect();
Now, we can add the following code to the onDraw() method to draw the bottom labels, one for each point in our data set:
for (int i = 0; i <= dataPoints.length; i++) {
    float xl = width * (((float) i) / dataPoints.length) + leftPadding;
    backgroundPaint.getTextBounds(labels[i], 0, labels[i].length(),
    textBoundaries);
    canvas.drawText(labels[i],
        xl - (textBoundaries.width() / 2),
        height + topPadding + backgroundPaint.getTextSize() * 1.5f,
        backgroundPaint);
}
We have also adjusted the total height of the graph to add some space for the labels:
float height = canvas.getHeight() - topPadding - getPaddingBottom()
        - backgroundPaint.getTextSize() + 0.5f;
Let's also draw a side legend indicating the value and scale of the points. As we're drawing a pre-defined set of vertical lines, we just have to calculate these values. We'd have to convert these values from the 0 to 1 range back to their original range and specific value.
We'd have to adjust the width and the initial left point of the graph depending on the label size. So, in addition, let's calculate the maximum width of the side labels:
float maxLabelWidth = 0.f;

for (int i = 0; i <= 10; i++) {
    float step = ((float) i / 10.f);
    float value = step * verticalDelta + minValue;
    verticalLabels[i] = decimalFormat.format(value);
    backgroundPaint.getTextBounds(verticalLabels[i], 0,
    verticalLabels[i].length(), textBoundaries);
    if (textBoundaries.width() > maxLabelWidth) {
        maxLabelWidth = textBoundaries.width();
    }
}
We also used a DecimalFormat instance to format the floating point values. We've created this DecimalFormat with the following pattern:
decimalFormat = new DecimalFormat("#.##");
In addition, we're storing the labels in an array to avoid regenerating them every single time we're drawing our view. With the maximum label width stored in the maxLabelWidth variable, we can adjust the paddings:
float labelLeftPadding = getPaddingLeft() + maxLabelWidth * 0.25f;
float leftPadding = getPaddingLeft() + maxLabelWidth * 1.5f;
We'll still use leftPadding to render all the objects and labelLeftPadding to render the labels. We have added the size of the maximum label and an additional 50% of padding that will be distributed before and after the label when drawing it. For that reason, the labels will be rendered with an additional 25% of maxLabelWidth padding, so there will be another 25% of space between the end of the label and the start of the graph.
We can easily draw the vertical labels by just iterating the array and computing the right vertical position:
for (int i = 0; i <= 10; i++) {
    float step = ((float) i / 10.f);
    float yl = step * height + topPadding- (backgroundPaint.ascent() +
    backgroundPaint.descent()) * 0.5f;
    canvas.drawText(verticalLabels[i],
        labelLeftPadding,
        yl,
        backgroundPaint);
}
To center the text on a vertical coordinate, we're using the average between the ascent and descent from the current font.
If we now run this example, we'll have a more detailed view of our graph:

We said, early in this chapter, that we'll build support for RTL and LTR devices. In this graph view, the legend will feel more natural on the right side of the screen if the device layout is configured as RTL. Let's quickly implement this change:
float labelLeftPadding = getPaddingLeft() + maxLabelWidth * 0.25f;
float leftPadding = getPaddingLeft() + maxLabelWidth * 1.5f;
float rightPadding = getPaddingRight();
float topPadding = getPaddingTop();

float width = canvas.getWidth() - leftPadding - rightPadding;
float height = canvas.getHeight() - topPadding - getPaddingBottom()
        - backgroundPaint.getTextSize() + 0.5f;

if (getLayoutDirection() == LAYOUT_DIRECTION_RTL) {
    leftPadding = getPaddingEnd();
    labelLeftPadding = leftPadding + width + maxLabelWidth * 0.25f;
}
The only change we've to do is to is checking if the layout direction is LAYOUT_DIRECTION_RTL and change the leftPadding and the labelLeftPadding to update where to draw the graph and the labels.