Experimental Evidence
Laboratory experiments are comparatively easy and inexpensive to perform. They are the most rigorous method of proving impairment. Laboratory assessment tools are used to measure impairment domains such as reaction time, memory, and motor control in study subjects after they have consumed cannabis. Study subjects may either be matched with comparable controls or the subjects may act as their own controls by being tested before and after dosing. Study subjects can be demographically pre-determined and can be stratified by cannabis use history. To control input variables, most studies rely upon a single source of cannabis, a defined THC concentration and a single mode of cannabis administration (e.g., smoking). These choices provide scientific rigor but cannot fully represent the many cannabis strains, THC concentrations, or modes of administration that are used in the real world.
On-road driving studies are more expensive and more dangerous to perform than either laboratory or simulator studies, so there are few such studies. Studies may be conducted on closed courses or in real-world traffic. For safety considerations, doses of cannabis and other drugs have been relatively low in this type of study.
Driving simulator studies use devices that mimic driving conditions in a controlled environment. Use of the most sophisticated simulators is more difficult and expensive than performing laboratory experiments. Expense and logistic considerations require simulator studies to rely upon a small number of homogeneous study subjects. Simulator studies measure fewer dimensions of impairment than are possible with laboratory studies. To date, the most sensitive dimension is standard deviation of lane position (SDLP), which is a measurement of weaving in the lane.
Laboratory Experimental Evidence
Decades of research studies conducted around the world have concluded that THC causes measurable impairment in carefully controlled laboratory settings. Laboratory assays include evaluation of free recall, time and distance perception, reaction time, equilibrium, Wisconsin Card Sorting Task, Tower of London, virtual maze, critical tracking task, divided attention, and many other variants. Sewell’s 2009 review of cognitive studies of the effects of cannabis [1] noted impairment of attentiveness, vigilance, perception of time and speed, and executive function. Impairment is prominently found in tasks requiring divided attention. When used together with alcohol, the impairing effects of the two drugs are at least additive and possibly multiplicative, which may depend upon the impairment dimension that is assessed.
The National Safety Council’s 2017 research document [2] concluded that acute cannabis intoxication produces dose-related impairment in cognitive and psychomotor functions as well as risk-taking behavior. Cannabis also altered reaction time, short-term memory and attention, motor skills and tracking, all of which can impair driving skills.
The most helpful recent report on this topic is the systematic review published in 2016 by Solowij of 105 recent experimental studies of the effect of cannabis on cognition [3]. Results were summarized by primary cognitive domain in order of evidential strength for both acute and chronic exposure. Where data were available, the persistence of impairment of chronic users after abstinence was reported.
Solowij [3] found strong and largely consistent evidence that cannabis impaired focused, divided, and sustained attention for both chronic and occasional users regardless of gender. After an acute impairment episode, residual impairment in chronic users gradually subsided over a period of several weeks of abstinence. There was also strong and largely consistent evidence that cannabis impaired psychomotor function acutely, but the evidence was weaker for similar impairment of chronic users of cannabis. Impairment likely persists during abstinence after chronic use, but the data are mixed. Executive function impairment studies produced mixed results with a tendency to see greater impairment in older subjects with a long history of chronic cannabis use, indicating a perturbed development of the frontal lobes.
Although studies of cannabis-related cognitive impairment consistently report impairment across several cognitive domains, there are wide variations from one subject to the next that are usually attributed to biological variability, drug use history, polydrug use, and dosing variations. There is also some evidence that the cannabinoid cannabidiol (CBD) may attenuate some THC-caused deficits, especially verbal learning and memory [4].
Driving Experimental Evidence
Safety concerns have limited the number and extent of rigorous on-road driving experiments to determine the impact of cannabis consumption on safe driving. Huestis [5] reviewed three Dutch studies, all on young occasional cannabis users. Two of the studies demonstrated a strong dose-response effect of THC consumption on SDLP. The third study used low 100 𝜇gm/Kg dose THC (approximately 7 mg, or one-third of a joint made with 5% THC cannabis) and found no effect on outcome measures. Other than journalistic publicity stunts, there have been no other published recent on-road driving experiments.
Sewell [1] pointed out that driving studies, whether they be on-road or simulator, suffer from the fact that the study subjects are fully aware of being observed. It is therefore likely that the outcome measures do not reflect driving behaviors of cannabis users on the road, but rather the driving behaviors they are capable of by compensating for their self-recognized impairment.
Simulator and Driving Experimental Evidence
While there is little disagreement that cannabis can cause measurable cognitive impairment, laboratory experiments such as those described above cannot determine the impact of the measured impairment on driving safety. Simulator studies have been developed to address that question.
Sewell [1] observed, based on early simulator and on-road experiments, that THC could impair some driving skills at low doses (about 7 mg THC) but that users were fairly self-aware and tended to compensate effectively for their impairment by driving more slowly and allowing more space between cars. Subjects were, however, much less able to compensate for their impairment when unexpected events occurred. Low dose THC combined with low dose alcohol was far more impairing than either substance separately, indicating a possible synergistic effect. Chronic cannabis users were generally less impaired than occasional users.
Huestis noted [5] that simulators permit measurement of driving performance aspects that cannot be achieved with actual road-driving experiments. Her research team reviewed nine simulator studies, two of which studied the effects of cannabis and alcohol. None evaluated chronic cannabis users. Study designs varied, with reaction time, tracking, speed and speed variation being the most commonly measured of the ten domains reported in the review. There were inconsistent results in half of the domains tested but eight of the nine studies reported impairment in at least one domain. Standard Deviation of Lane Position (SDLP) was the most sensitive road-tracking measure with two of four studies showing a THC-associated impairment.
After reviewing prior work, the Huestis team studied the impact of THC concentrations with and without alcohol using a highly instrumented simulator on 18 occasional cannabis users using vaporized cannabis [6]. That study found that 8.2 ng/ml of THC in whole blood provided a similar SDLP to an alcohol level of 0.05 gm/dl. Huestis cautioned that interpolated THC concentrations at the time of impairment measurement were not representative of forensically-determined THC levels due to the rapid redistribution of THC from the blood immediately post-dosing. The study found that the effects of THC and alcohol on SDLP were additive, rather than synergistic.
Epidemiological Evidence
Observational studies. Most reports based on the Fatality Analysis Reporting System (FARS) sponsored by the National Highway Traffic Safety Administration (NHTSA) fall into this category. Outcomes of these studies are typically trend graphs and comparative ratio reports.
Case control studies compare drivers in crash cases with similar drivers who were not involved in crashes. It is essential to establish a valid control group for these studies to have high value. Outcomes of these studies are typically Odds Ratios (ORs).
Culpability studies examine drug presence in fatal and/or crash cases, comparing data from culpable drivers and non-culpable drivers. Outcomes of these studies are typically Odds Ratios (ORs).
Observational Studies
Perhaps the most widely reported observational studies are those published by states based upon fatal crash information collected for submission to NHTSA FARS reports. Data for these reports historically come primarily from coroners although excellent progress is being made in collecting toxicology data from surviving drivers as well. We will examine reports from two states that have legalized recreational cannabis, Colorado and Washington.
- 1.
Since recreational marijuana was legalized, marijuana-related traffic deaths increased 151% while all Colorado traffic deaths increased 35%.
- 2.
Since recreational marijuana was legalized, traffic deaths involving drivers who tested positive for marijuana more than doubled from 55 in 2013 to 138 people killed in 2017.
- 3.
The percentage of all Colorado traffic deaths that were marijuana related increased from 11.43% in 2013 to 21.3% in 2017.
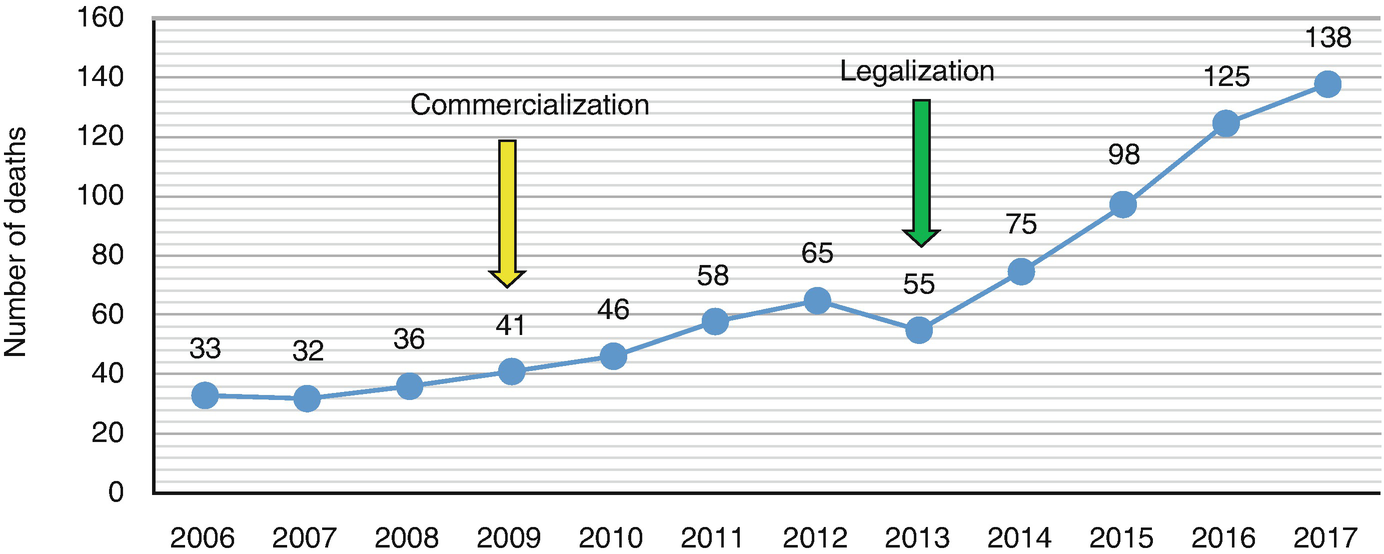
Traffic deaths related to marijuana when a driver tested positive for Marijuana
RMHIDTA was careful to define “marijuana-related” as a case where cannabis shows up in the toxicology report and includes both cannabis only cases and polydrug cases with cannabis. The term is not intended to mean “marijuana-impaired” since coroners provided much of the data and none of the coroners’ subjects were ever charged with or convicted of impaired driving. Toxicology samples positive for THC, carboxy-THC, or both were considered cannabis-positive. Since 2016 the state has reported THC cases separately from cases with carboxy-THC only.
RMHIDTA’s observations could be explained by an increase in impaired driving or an increasingly widespread use of cannabis brought about by legalization, even if cannabis caused no impairment whatsoever. A combination of both could also explain the observations.
NHTSA sponsored a series of roadside surveys in the state of Washington just prior to its legalization of recreational cannabis, 6 months after legalization, and 1 year after legalization [8]. Significant increases were found in the number of drivers testing positive for cannabinoids in the largest counties (13.3%, 20.9%, and 30.7%, respectively, for the three time periods), but no significant increases were seen in smaller counties. Due to the wide variations in cannabinoid-positive drivers between and within sites, the overall change was not significant.
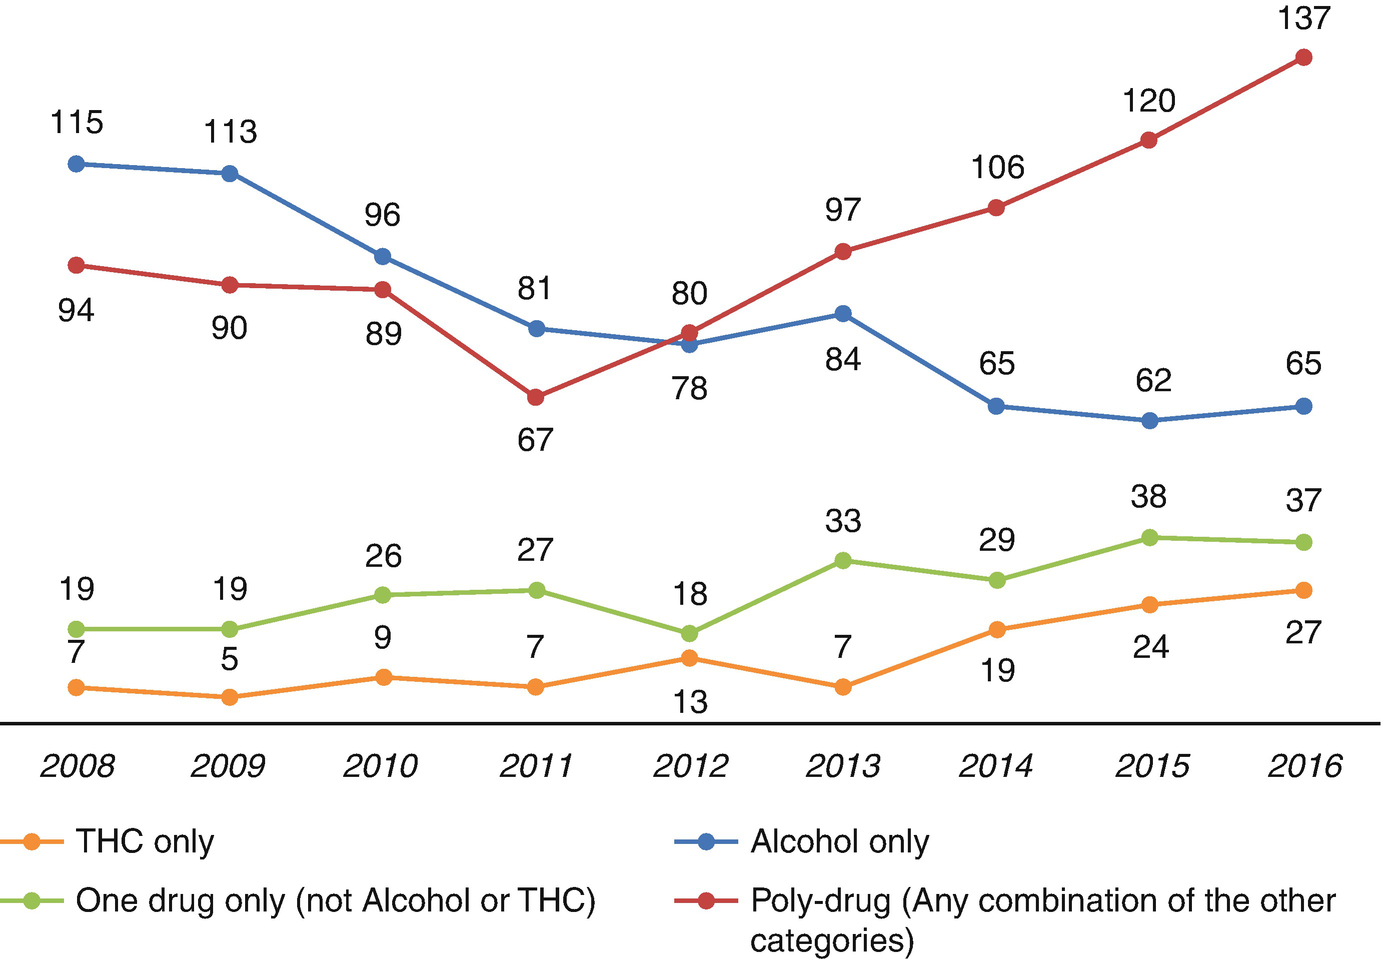
Rising frequency of polydrug drivers in fatal crashes
Washington has consistently reported THC separately from carboxy-THC, but like the Colorado data, THC trends could result from an increased impaired driving, an increase cannabis consumption in the driving population with no increases in impairment, or a combination of both.
Case-Control Epidemiological Evidence
Case-control epidemiological studies compare study subjects, typically those involved in fatal crashes, with control subjects who were not involved in crashes. Selection of comparable control subjects is critical for these studies to achieve validity. There have been literally thousands of reports of such studies, although only a few dozen qualify as highly-referenced original research. The best way to understand these studies is by understanding three recent meta-analyses, followed by the studies published since the last meta-analysis.
- 1.
Sufficiently large sample size
- 2.
Appropriate controls selected to match the study subjects
- 3.
Appropriate adjustments as needed to eliminate bias from study/control mismatching
- 4.
Valid means of measuring drug presence with a preference for laboratory assays
- 5.
Correct analytes studied: THC, not just cannabinoids, identification of polydrug cases
- 6.
Data presented to enable pooling with other studies
Li’s 2011 meta-analysis [10] selected 9 studies out of a total surveyed population of 2960 published reports. This meta-analysis totaled 4236 cases and 88,993 controls and focused on cannabis use rather than THC presence. The most common source of exposure data were self-reports or urine tests, followed by blood tests. All but one study reported a significant risk to driving safety with cannabis use. The estimated summary OR was 2.66 (2.07, 3.41) of a fatal crash from cannabis use.
The meta-analysis from Asbridge’s team published a few months later [11] also selected 9 studies out of a total surveyed population of 2975 published reports. There was some overlap of selected studies, but Asbridge included culpability studies, whereas Li did not. The most common source of exposure data was blood or serum assays rather than self-reports or urine analysis. Asbridge reported an estimated summary OR of 1.92 (1.35, 2.73) of a crash due to cannabis use and found that risks were higher in case control studies than culpability studies, and higher in fatal crashes than in non-fatal crashes.
These two studies led to a commonly accepted view that the OR of a fatal crash from cannabis use was about 2 [12]. Then 5 years later Rogeberg [13] critiqued and re-evaluated both the Li and Asbridge meta-analyses, restating their estimates to be 1.55 and 1.25, respectively. Rogeberg then performed a new meta-analysis of 28 studies and reported two OR estimates, one using a random-effects model, the other using meta-regression. The estimates were 1.36 (1.15–1.61) and 1.22 (1.1–1.36), respectively. Like Asbridge, Rogeberg found ORs to be higher in case-control studies than in culpability studies.
Li subsequently published two further OR studies, both based upon data from the FARS database. His 2013 report [14] found an OR for cannabis-related crashes to be 1.83 compared with 3.03 for narcotics, 3.57 for stimulants and 4.83 for depressants. His 2017 report [15] found an OR for cannabis-related crashes to be 1.54 compared with 16.33 for alcohol and 25.09 for the combination of cannabis and alcohol.
The wide variation in results from one researcher to another and even within a research team speaks to the difficulty of determining the quantitative effects of cannabis on driving safety. The best evidence to date is that it certainly isn’t safe to drive while impaired by cannabis, that the OR is likely somewhat below 2, well below that of alcohol, and that the combination of THC and alcohol is synergistic.
Some of the difficulty in recent analyses comes from relying upon the FARS database, which is frequently used to assess safety of cannabis and driving despite caution from NHTSA [16]. Romano [17] and Li [14] published similar studies for the same time period, both using the FARS database for cases and the National Roadside Survey for controls. Yet the two studies found contrary ORs for the risk of cannabis on fatal crashes (0.86 from Romano and 1.83 from Li). Romano subsequently reconciled the two studies [18], resulting in a change to his OR estimate to 1.27 (0.88, 1.83). More importantly, Romano concluded that based in part on the limitations previously reported by NHTSA [16], the “FARS database should neither be used to examine trends in drug use or to obtain precise risk estimates.”
Nevertheless, two recent reports [19, 20] based upon FARS data have been adopted by some in the commercial cannabis industry to downplay the effects of cannabis on road safety [21, 22]. Both referenced reports used a state’s total traffic fatalities as a marker of the effect on road safety of legalized medical or recreational cannabis. Since at the time of their publication, cannabis-using drivers constituted a small minority of all drivers, it can be argued that total number of traffic fatalities is a blunt instrument with which to measure the impact of cannabis legalization. It should be noted that the Aydelotte study [20] reported 77 “excess traffic fatalities” due to cannabis legalization in Colorado and Washington. Aydelotte opined that “we do not view that as a clinically significant effect, but others might disagree.” Presumably the “excess traffic fatalities” would disagree had they survived.
A case-control study sponsored by NHTSA and published in 2016 [23, 24] has been misreported [25, 26] as showing cannabis was not linked to car crashes. In fact, the study failed to find a link, which is far different than finding that a link does not exist. The study also failed to find links between crash risk and the use of any drug including cocaine, methamphetamine, opioids, or any combinations of those drugs, all of which have been shown to be more impairing than cannabis [14]. There are several reasons why the study failed to find these links. First, the sample size of the study was far too small to find a statistically significant link for many of the drugs. Second, unlike other epidemiological studies, the NHTSA study only included cases who volunteered to be assessed. It is unclear why a driver who knew he or she was impaired would volunteer to be assessed, but the report disclosed that many subjects chose not be assessed. Third, the study included principally property damage crashes, whereas prior studies [11] have demonstrated that ORs are higher for fatality crashes than for minor crashes. There were only 15 fatal crashes in the NHTSA study. Fourth, there were 3095 cases assessed in the 2682 crashes, indicating that at least 413 non-crash-initiators who might be expected to have drug-use levels similar to controls were included in the pool of study subjects. Their inclusion in a study of alcohol with its higher expected OR likely would not matter, but it likely does matter in a study of cannabis with an expected OR somewhat below 2. And finally, the study was conducted in Virginia Beach, Virginia, an atypical study site. Controls in Virginia Beach showed a 14.4% prevalence of drugs, compared with a 19–22% prevalence in the 2014 NHTSA National Roadside Survey, depending upon assay and time of day. The NHTSA study should certainly be included in the library of respected literature especially for its careful selection of controls, but its results do not deserve to overrule the body of high-quality contrary evidence available.
Culpability Epidemiological Evidence
Culpability studies of large populations have not unequivocally answered the question of the role of cannabis in traffic crashes, in part due to the wide variations in study design. Below we discuss only studies using blood testing and with two exceptions, those that distinguished THC from its inactive metabolite carboxy-THC. All studies found an effect of cannabis on crash risk, but one study (Longo) found no effect if the blood THC level was below 2 ng/ml.
Longo’s 2000 study [27] involved 2500 injured and deceased drivers tested for alcohol, THC, benzodiazepines, and stimulants. Drivers were determined to be either culpable or non-culpable. The 6.2% who were determined to be contributory, rather than fully culpable were not included in the study. Drug- and alcohol-free drivers were culpable in 52.5% of the cases; THC-positive drivers were culpable 47.5% of the cases indicating no significant cannabis involvement. However, there were only 44 drivers found with THC only and those with a THC level at or above 2 ng/ml were culpable 66.7% of the time, indicating significant cannabis involvement. The time interval between crash and taking of a blood sample was not reported. Data were adjusted for risk factors, recognizing that cannabis users tend to be risk takers.
Drummer’s 2004 study [28] involved 3398 fatal crashes, including 59 who tested positive for THC only. Like Longo, Drummer excluded drivers from his study whose culpability was only contributory. He found an odds ratio (OR) of 2.7 for being involved in a fatal crash if the driver was positive for THC, and 6.6 if the driver had a blood THC level above 5 ng/ml. In comparison, the OR for alcohol-positive drivers was 6.0 and 17.4 if both alcohol and THC were present.
Laumon’s 2005 study [29] involved drivers in 10,748 fatal crashes, including 681 who were positive for THC only. The time between a crash and taking of a blood sample was not reported, but Beicheler [30] reported that a similar cohort had an average 4-hour delay between the two events. This would have a material effect on the validity of the THC laboratory findings as discussed below. After adjustment for risk factors, Laumon found an OR for involvement in a fatal crash to be 3.32 for THC-positive drivers.
Bédard’s 2007 study [31] involved 32,543 drivers in the FARS database from 1993 to 2003 who were tested for both cannabinoids and alcohol and found negative for alcohol. A total of 1647 were cannabinoid-positive, including those positive for carboxy-THC only. Most tested samples were blood, with some urine. Culpability was determined by FARS-identified driver-related factors. Authors reported a 1.39 OR for involvement in a fatal crash, 1.29 after adjusting for risk factors. Inclusion of drivers positive for non-impairing carboxy-THC is the study group would tend to lower the OR for involvement in fatal crashes.
Beicheler’s 2008 study [30] is similar to Laumon’s, involving drivers in 9998 fatal crashes tested for both alcohol and THC. There were 391 drivers who tested positive for THC only. Most drivers were urine tested, and then blood tested if the urine tests were positive. Only blood test results were used in the study. The authors reported an average 3-hour delay between crash and taking a blood sample if no urine testing was required and a 4.5-hour delay if urine testing was performed first. Drug- and alcohol-free drivers were culpable in 54.4% of the cases, THC only positive drivers were culpable 70.0% of the cases, indicating significant cannabis involvement.
Li’s 2017 study [32] involved 14,742 culpable and 14,742 non-culpable drivers in the same fatal two-vehicle crashes between 1993 and 2014 that were reported in the FARS database: 2409 tested positive for cannabinoids, including carboxy-THC. The OR for initiating a fatal crash was 1.82 for cannabinoid-positive drivers, 1.64 after adjusting for risk factors. Adjusted risk ORs for alcohol ≧ .08 blood alcohol concentration (BAC) was 9.41 with no cannabinoids present and 10.57 if cannabinoids were present.
These culpability epidemiological studies show, albeit inconsistently, that drivers positive for THC were more likely to cause fatal crashes than drivers without THC. The increased risk to the driving public caused by cannabis-using drivers is measurable, but less than the risk caused by drunk drivers. However, when the two substances are combined, the risk is greater than the risk caused by either drug alone. In studies that evaluated drivers’ use of alcohol and cannabis, more drivers were found using both drugs than were found using cannabis alone.
Tolerance
Some heavy users of cannabis claim they can drive safely after using the drug because they have built up a tolerance to its effects. Tolerance is measured primarily by how high a dose of a drug is required to achieve a desired effect. To some extent, this is based on individual susceptibility, body size, and body mass index. But even for a single individual, regular use of a drug creates a tolerance such that, with increasing use, a greater amount is needed to achieve a desired effect.
THC tolerance has been demonstrated by comparing counterclockwise hysteresis curves of frequent and occasional users. Frequent users can have a baseline THC blood level above zero, a much higher THC blood level after dosing, but don’t feel as high as an occasional user [33, 34].
Because of THC’s estimated 4.1-day terminal half-life in chronic users [35], THC is continuously released into the blood from the body’s fat stores between doses, resulting in a chronic low blood THC level between doses. After dosing, chronic users have a much higher blood THC level than occasional users, yet do not feel as “high” as an occasional user after dosing [34]. These are all characteristics of a chronic user building up tolerance to THC.
Numerous studies have suggested that frequent cannabis users can develop a tolerance to some, but not all, impairing effects of THC [36–39]. More recent work by Ramaekers [40] found that chronic users, like occasional users, become acutely impaired after dosing with cannabis. However, because chronic users maintain a low level of chronic impairment, the acute increase in their level of impairment was less than that of an occasional user who was completely unimpaired prior to dosing. Ramaekers opined that prior work, including his own, did not detect this fact due to use of self-controls and the use of inadequate sample sizes. After a review of 10 recent studies of cannabis tolerance in chronic users, Solowij concluded that “tolerance generally manifests as a blunted effect rather than an absence of observable effects” [41].
Impairment Assessment
Although validated for scientific use, impairment measurement methods described in the first Laboratory Experimental Evidence paragraph above are time-consuming and impractical for use by police at the roadside. Furthermore, legal impairment not only can differ from scientific impairment, it can differ from state to state. Most states have statutes that define what driving under the influence means. Definitions range from “impairment to the slightest degree” to “incapable of driving safely.” Colorado has both, the first offense defining Driving While Ability Impaired (DWAI) and the second defining Driving Under the Influence (DUI).
Forensically determining impairment is akin to diagnosing an illness. A physician studies both symptoms and laboratory tests in making a diagnosis and determining a treatment plan. Police also rely upon symptoms and chemical tests to determine impairment and to prove impairment in court. Just as some disease diagnoses are straightforward and others are more challenging, effectiveness of impairment assessments vary depending upon the impairing substance(s) and dose, symptoms, and of course, the diagnostician.
Symptoms of alcohol impairment are overt and the chemical assays are fairly definitive. Odor, bloodshot eyes, speech, behavior and balance are readily detected by even untrained observers. Horizontal Gaze Nystagmus is a validated [42] tool used by officers trained in Standardized Field Sobriety Tests to confirm alcohol impairment above 0.08 BAC. There is a very high correlation between BAC and levels of impairment [43]. For cannabis, symptoms are much more subtle and chemical assays play more of a supporting role than a definitive role.
Symptomatic Assessments
Aside from observed impaired driving behaviors which must be distinguished from simply bad driving, officers have several tools at their disposal to determine if a driver is impaired. These tools are relied upon to convict impaired drivers when laboratory assays are not available. There are three common levels of impairment detection training provided to law enforcement officers: SFST (Standardized Field Sobriety Test), ARIDE (Advanced Roadside Impaired Driving Enforcement), and DRE (Drug Recognition Expert), in increasing order of complexity and training time commitment. Colorado reported 5674 active SFST operators in 2018 compared with 1427 active ARIDE certificate holders and 228 DREs [44]. Criteria for all three classes of training were developed by NHTSA and the International Association of Chiefs of Police (IACP).
SFSTs consist of three tools – Horizontal Gaze Nystagmus (HGN), One Leg Stand (OLS), and Walk and Turn (WAT). The battery of tests has proven to be highly accurate identifying drivers above a BAC .10 [45] and BAC .08 [46, 47] with 93%, 95%, and 94% correct arrest decisions, respectively, in the three field studies. The battery of tests typically takes about 5 minutes to conduct in the field. To retain SFST certification, officers are required to complete a training update every 2 years.
SFSTs are only moderately successful identifying drug impairment, especially THC impairment [48, 49]. Papafotiou reported 65.8% and 76.3% correct identification of THC-impaired drivers with SFSTs, depending on the THC concentration of cannabis used [50]. Papafotiou used a driving simulator to determine THC impairment in his subjects. Cannabis rarely causes HGN, whereas HGN is the most sensitive of the SFST tools for detection of alcohol impairment [47, 48]. SFSTs are somewhat more successful identifying impairment by central nervous system (CNS) depressants, CNS stimulants, and narcotic analgesics [48].
Additional assessment tools may eventually be added to the SFST battery to enable more robust detection of drug impairment. The addition of finger-to-nose (FTN) and Modified Rombeg Balance (MRB) tests to OLS and WAT can provide a 96.7% reliability in detecting impairment confirmed by DRE assessments and laboratory confirmation [51]. Pupillary rebound dilation, lack of eye convergence, and peripheral vision have also been studied as useful tools to detect THC impairment [52]. Little has been done to determine these tests’ ability to detect impairment by other drugs.
SFST-certified practitioners may take ARIDE training focused on drug impairment symptoms which requires an additional 16 hours of training beyond that required for SFST certification. Training on tools such as MRB is provided. There is no ARIDE periodic update or refresher course either required or available.
ARIDE-trained officers may continue their training with a 72-hour DRE training course requiring a field certification and a final examination. Updated training is required every 2 years to maintain DRE certification. DRE officers use a 12-step protocol to determine not only if a driver is impaired, but which class or classes of drugs are likely to be causing the observed impairment. The protocol is defined in the Drug Evaluation and Classification Program (DECP) administered by the IACP.
The DRE protocol has been validated in the laboratory [52] and in two field studies [53, 54]. The validation studies found that trained officers correctly identified the drug classes causing impairment observations 80–90% of the time and rarely claimed that a study subject was impaired by a drug when no drug was found by laboratory assessment. In a Los Angeles field study [53] only one of the 173 cases did an officer identify a subject as impaired when no drug or alcohol could be confirmed in the laboratory. The DRE protocol includes a laboratory assessment as step number 12 to prevent false positives from proceeding to conviction.
The three DECP validation studies were performed before the program’s parameters were formalized and subjected to oversight by the IACP. Some validation studies used urine rather than blood for confirmation, all drug classes were not studied in all validation studies, and neither field validation study performed laboratory tests on subjects considered by officers to be unimpaired, which is necessary to identify false negatives. For these and other reasons, the validation studies themselves have been called into question [53]. Nevertheless, the DECP program has been accepted by law enforcement in all 50 states, several other countries, and results have been determined to be admissible as valid scientific evidence in court hearings.
DECP divided attention tests of walk and turn, one leg stand, modified Romberg balance, finger to nose, as well as the eye tests for lack of convergence, and rebound pupillary dilation are particularly sensitive to identify the presence of THC [51, 54, 55].
Few symptomatic impairment assays can be performed on a driver injured in a drugged driving crash. A driver strapped onto a backboard awaiting transport to a hospital is unable to be assessed by any of the SFSTs or most of the DRE protocol steps. In those cases, law enforcement officials must rely principally upon an examination of driving behavior that caused the crash.
Chemical Assays
In order of increasing invasiveness, chemical assays may be performed on breath, oral fluid, urine, or blood to confirm the presence of intoxicants after a driver’s impairment symptoms have been observed and documented. Breath and blood tests are the preferred methods to detect and measure alcohol. Breath tests can be done at the roadside, whereas blood test results are not available for days or even weeks after an arrest.
Blood is the preferred matrix to detect and measure drugs other than alcohol. Oral fluid testing is gaining interest in the law enforcement community [56] because detection (not measurement) results can be available for many drugs at the roadside, and oral fluid samples may easily be taken at the roadside without the long sample delays common with blood sampling. Roadside oral fluid testing is being used routinely in some countries (e.g., Australia, Norway, Canada) but is still under evaluation in the United States. Urine tests are no longer recommended to support charges of drugged driving largely because urine reveals drug metabolites rather than the native drug. That is especially problematic for THC.
Chemical tests are useful but not infallible. NHTSA reported [57] that in 2011, 24% of those arrested for DUI refused to be tested, with a range between 4% and 82% among the states. Cases without chemical assays relied upon symptomatic assessments for prosecution and conviction.
The correlation between BAC and levels of impairment was documented by Borkenstein in 1964 and has since been replicated worldwide with similar results. The correlation isn’t the same for each individual and there are even wide differences between ages and gender. For example, young males have a much higher risk of crashes after alcohol consumption than the general population [43]. Consequently, a high BAC cannot scientifically prove impairment, nor can a low BAC prove lack of impairment. Nevertheless, the correlation is so high that Department of Transportation Appropriations Act of 2001 required all states to adopt a BAC .08 limit as a DUI per se level. Delaware was the last state to adopt that standard in 2004 and Utah lowered its standard to BAC .05 in 2018, consistent with many European countries.
The reliance on BAC levels to convict of DUI per se and to support conviction of DUI has led to a popular belief that blood tests for alcohol prove DUI-alcohol and therefore should be used to prove DUI-cannabis as well [58]. Although roadside eye tests or other tools to measure impairment rather than drug presence may eventually provide a roadside equivalent for drugs to the alcohol preliminary breath testing devices, there will never be a BAC equivalent THC or any other drug. No roadside (or other) device to measure THC in blood will ever provide the simplified answer the public seeks to this complex problem.
Like alcohol impairment, THC impairment is a dose-related phenomenon. But due to the pharmacokinetic properties of THC, the dose of THC remaining in a driver at the time or arrest cannot be determined by forensic measurements of that driver’s blood THC levels. Since THC is fat-soluble, circulating THC in blood is quickly absorbed by the brain and other highly-perfused fatty tissues, rapidly clearing it from the blood. On average, the maximum blood THC level can drop 73% (3.3%–89.5%) within the first 25 minutes after beginning to smoke a joint [59]. Since blood is typically drawn an hour after a routine traffic stop [60] and 2 hours after a crash [61], forensically-determined THC levels cannot represent THC levels at the time of the event leading to the blood draw. In contrast, water-soluble alcohol is cleared from blood via metabolism, rather than via redistribution. Alcohol’s linear metabolic rate enables reasonably reliable retrograde extrapolation to infer alcohol blood levels at a time prior to a blood draw. That cannot be done with THC.

Subjective effects vs. blood levels of alcohol and THC
The conclusions drawn from Sewell’s chart should not be surprising when considering that blood is never impaired by THC, alcohol, or other drugs; the brain is impaired by these substances. Alcohol quickly establishes a fairly uniform concentration gradient across highly perfused tissues in the body, so blood testing provides an excellent indication of brain levels of alcohol. This is not so for fat-soluble THC. Mura [62] found that 100% of the 12 cadavers in his study had higher THC concentration in the brain than in the blood, sometimes even presenting with high levels of THC in the brain when none could be detected in blood.
Several states have established a legal THC per se level or permissible inference level of 5 ng/ml of THC in whole blood. Although states may choose whatever per se level they wish in the interests of highway safety, there is no scientific basis for a 5 mg/ml or any other per se level. The European Driving Under the Influence of Drugs (DRUID) culpability study of 7455 subjects found that the crash involvement OR of drivers with a THC level above 5 ng/ml was lower than the OR of drivers with a THC level of 3–5 ng/ml [65]. Three other studies of drivers arrested for DUI found no difference in impairment assessments for drivers above and below 5 ng/ml THC [55, 64, 65].
A further reason to avoid a 5 ng/ml THC legal limit is that blood THC levels differ depending upon the mode of consumption. The blood THC level of drivers impaired by a standard 10 mg dose of THC edible products rise no higher than 1 ng/ml and no higher than 3 ng/ml after consumption of five times the standard dose [66].
Chemical assays must play a different role in drugged driving forensic cases compared to drunk driving forensic cases. For alcohol, chemical assays are of primary importance. They can prove guilt of DUI per se and provide evidence that the observed impairment was likely dangerous. For drugged driving, symptomatic assessments are of primary importance and chemical assays are of secondary importance. Chemical assays merely provide evidence of which drug or drugs caused the observed impairment. However, chemical assays are of primary importance in jurisdictions that have established zero tolerance or legally-defined per se levels for selected drugs in impaired driving cases.
Public Safety
Fortunately, highways are generally very safe and have been getting safer, at least until the last few years. FARS data show that while annual vehicle crash deaths have hovered around the 40,000 mark for at least four decades, normalized deaths have steadily dropped from over 3 per 100 million miles driven to 1.18 in 2016. Fatal crashes are so rare than a driver who averages 20,000 miles per year may need 85 lifetimes before being involved in fatal crash. Normalized rates have been rising recently, which breaks a 40-year trend of improvement [67].
While we celebrate an improving highway safety record, the rarity of fatal crashes can make changing attitudes toward impaired driving more difficult. Drunk driving as a percentage of total fatalities was 48.2% in 1982. The “Friends don’t let friends drive drunk” campaign was launched the following year. The percentage dropped to 30% by the late-1990s when the campaign was cancelled. Since that time, the drunk driving death rate has remained in the range of 30% [68].
As difficult as it is to change drunk driving attitudes when the relative risk for involvement in a fatal crash exceeds 10 for a young male with a BAC above 0.05, it is even more difficult to affect stoned-driving attitudes when the risk may be less than 20% of that for driving under the influence of alcohol.
One out of every five cannabis users in Colorado report driving within 2–3 hours after consumption of cannabis, the period when THC impairment has been shown to be the most serious [69]. That percentage has remained stable since cannabis for recreational use was legalized in that state, while the number of cannabis users continues to increase.
The educational challenge to change driving behaviors is daunting. A survey of people who drive under the influence of alcohol and cannabis revealed that 52% of them used cannabis to sober up after drinking too much to drive safely, even though cannabis actually increases the risk of a fatal crash [70].
An accurate understanding the public safety impact of cannabis-impaired driving has been crippled by the large proportion of cannabis users who are polydrug users and by a lack of good data. In 2018 Colorado, which has a 5 ng/ml THC permissible inference level, released the first report on causes of drugged driving created by linking the databases of forensic toxicology laboratories with judicial data [44]. By studying cases of drivers arrested for impaired driving, this enabled a better understanding of the causes of drugged driving, rather than the presence of drugs in crashes which is the foundation of most other reports. The report’s power was limited by the fact that only 8.7% of the 27,244 DUI cases in 2016 had forensic toxicology tests for both alcohol and drugs, and even then, drug screening tests were inconsistent between the two primary forensic toxicology laboratories, and inconsistent among the various law enforcement agencies.
- 1.
52.5% of cannabinoid-positive drivers had a blood THC level below 5 ng/ml.
- 2.
54% of non-alcohol positive drug tests were for THC. The remainder were for other drugs, led by methamphetamine, alprazolam, and cocaine.
- 3.
Among drivers tested for both alcohol and drugs, 89% of THC-positive drivers were polydrug users.
- 4.
Although 82.8% of THC-positive were convicted of DUI, that was led by polydrug impaired drivers.
- 5.
For drivers impaired by THC only for whom blood THC levels were ≧5 ng/ml, 99.7% were convicted of impaired driving (DWAI) but only 59.8% were convicted of driving under the influence (DUI).
- 6.
For drivers impaired by THC only for whom blood THC levels were <5 ng/ml, 91.4% were convicted of impaired driving (DWAI) but only 14.1% were convicted of driving under the influence (DUI).
- 7.
Half of the 20 DUI vehicular homicide cases were due to alcohol – at least that was the only drug reported in those cases. The other half were due to non-alcohol drugs or polydrugs. Neither of the DUI vehicular homicide cases where THC was the only drug reported were convicted of DUI. Both were below 5 ng/ml THC. In contrast 80% of the alcohol and 71% of the polydrug cases were convicted of DUI.
The primary challenges for public safety remain changing attitudes toward the acceptance of drugged driving and ensuring justice for victims affected by drugged driving. In addition, it is important that effective actions be taken today to make roads and highways safer by reducing drugged driving. While more research is useful, it must not be the condition for more effective public education about the risks of drugged driving or for more active enforcement actions. There are many good policy solutions available today to reduce this serious public safety problem based on the substantial body of research reviewed in this chapter [71–73].
Conclusions
Laboratory experiments prove that cannabis adversely affects psychomotor skills and cognitive functions required for safe driving in both occasional and chronic cannabis users. Whereas laboratory evidence is strong and consistent, epidemiological evidence is far less so.
Epidemiological studies have demonstrated that alcohol increases driving crash risk far more than THC does. The large database created by the National Highway Traffic Safety Administration (NHTSA) through its Fatality Analysis Reporting System (FARS) has enabled determination of the odds ratio (OR) of being involved in a fatal crash across a variety of demographic characteristics [43]. There is a high correlation between alcohol blood levels and crash risk. Whereas the OR of a fatal crash for a driver using alcohol can range from 2 to 20 or higher depending upon the blood alcohol level, the OR of a fatal crash is typically around 2 for a driver using cannabis, regardless of the forensically-determined blood THC level [63]. Epidemiological results vary widely with some showing very little or no effect of cannabis use on driving fatalities [13]. These findings support the claim that driving under the influence of cannabis is safer than driving under the influence of alcohol, but more dangerous than sober driving.
The combination of alcohol and cannabis is more impairing than the effects of either substance separately. Impairing effects of the two substances (polydrug use) are either additive or synergistic, depending on the impairing domain being measured [15, 29, 32]. Polydrug impairment is not only more dangerous than impairment by THC alone, it is also more common. Most (64.1%) of THC-impaired drivers arrested for driving under the influence (DUI) in Colorado in 2016 tested positive for both alcohol and THC [44].
Although chronic users can develop a tolerance to some of cannabis’s impairing effects, they can also maintain a chronic low level of impairment between dosing sessions. After dosing they become acutely impaired similar to occasional users.
Distracted driving further complicates understanding the impact of impaired driving. Some distractions such as traffic and road signs are beyond a driver’s control, but others such as mobile phone use, monitoring a GPS, or talking with passengers are choices made by a driver. Regardless of the source of distractions, their impact on driving safety becomes magnified if the driver is suffering from a divided attention deficit, such as that induced by a driver’s choice to use cannabis prior to driving. In the real world, we must frequently deal with cases where alcohol, drugs, and distractions are all contributing causes of a traffic crash, each one compounding the effects of the other.
There is no direct correlation between the degree of driving impairment and THC levels in blood. Forensic laboratory tests of drivers suspected of drugged driving are of secondary importance, playing a supportive role to that of collecting symptomatic evidence of impaired driving.