Declining Infrastructure
In 1966, the U.S. committed 2.5% of its potential GDP to infrastructure investment—roads, bridges, schools, hospitals, water treatment, sewers, and more. Over the next twenty years, mainly during the Nixon and Reagan administrations, infrastructure investment fell dramatically, hitting a record low of 1.3% of GDP in 1983, and it’s held at a relatively steady state ever since. And that understates the underinvestment, as construction material prices have outpaced inflation in recent years.
In practical terms, what does this mean? Simple: worse conditions for working Americans. About 1 in every 5 U.S. roads is in poor condition. Forty-five percent of Americans do not have access to public transit. A water main break occurs every two minutes. Numerous faults in our core infrastructure have led to crises that once seemed unimaginable: In Flint, Michigan, 12,000 children drank lead-contaminated water, causing irreparable brain damage that affects academic performance and IQ and increases the likelihood of Alzheimer’s and Legionnaires’ disease. In Miami a twelve-story beachfront condominium collapsed, killing 98 people.
Meanwhile, as a share of GDP, China spends ten times more on infrastructure than the U.S. Which may explain why it takes 4.5 hours to take a train from Shanghai to Beijing (752 miles) but 7 hours to get from Boston to D.C. (438 miles).
03
Infrastructure Spending as Share of Potential GDP
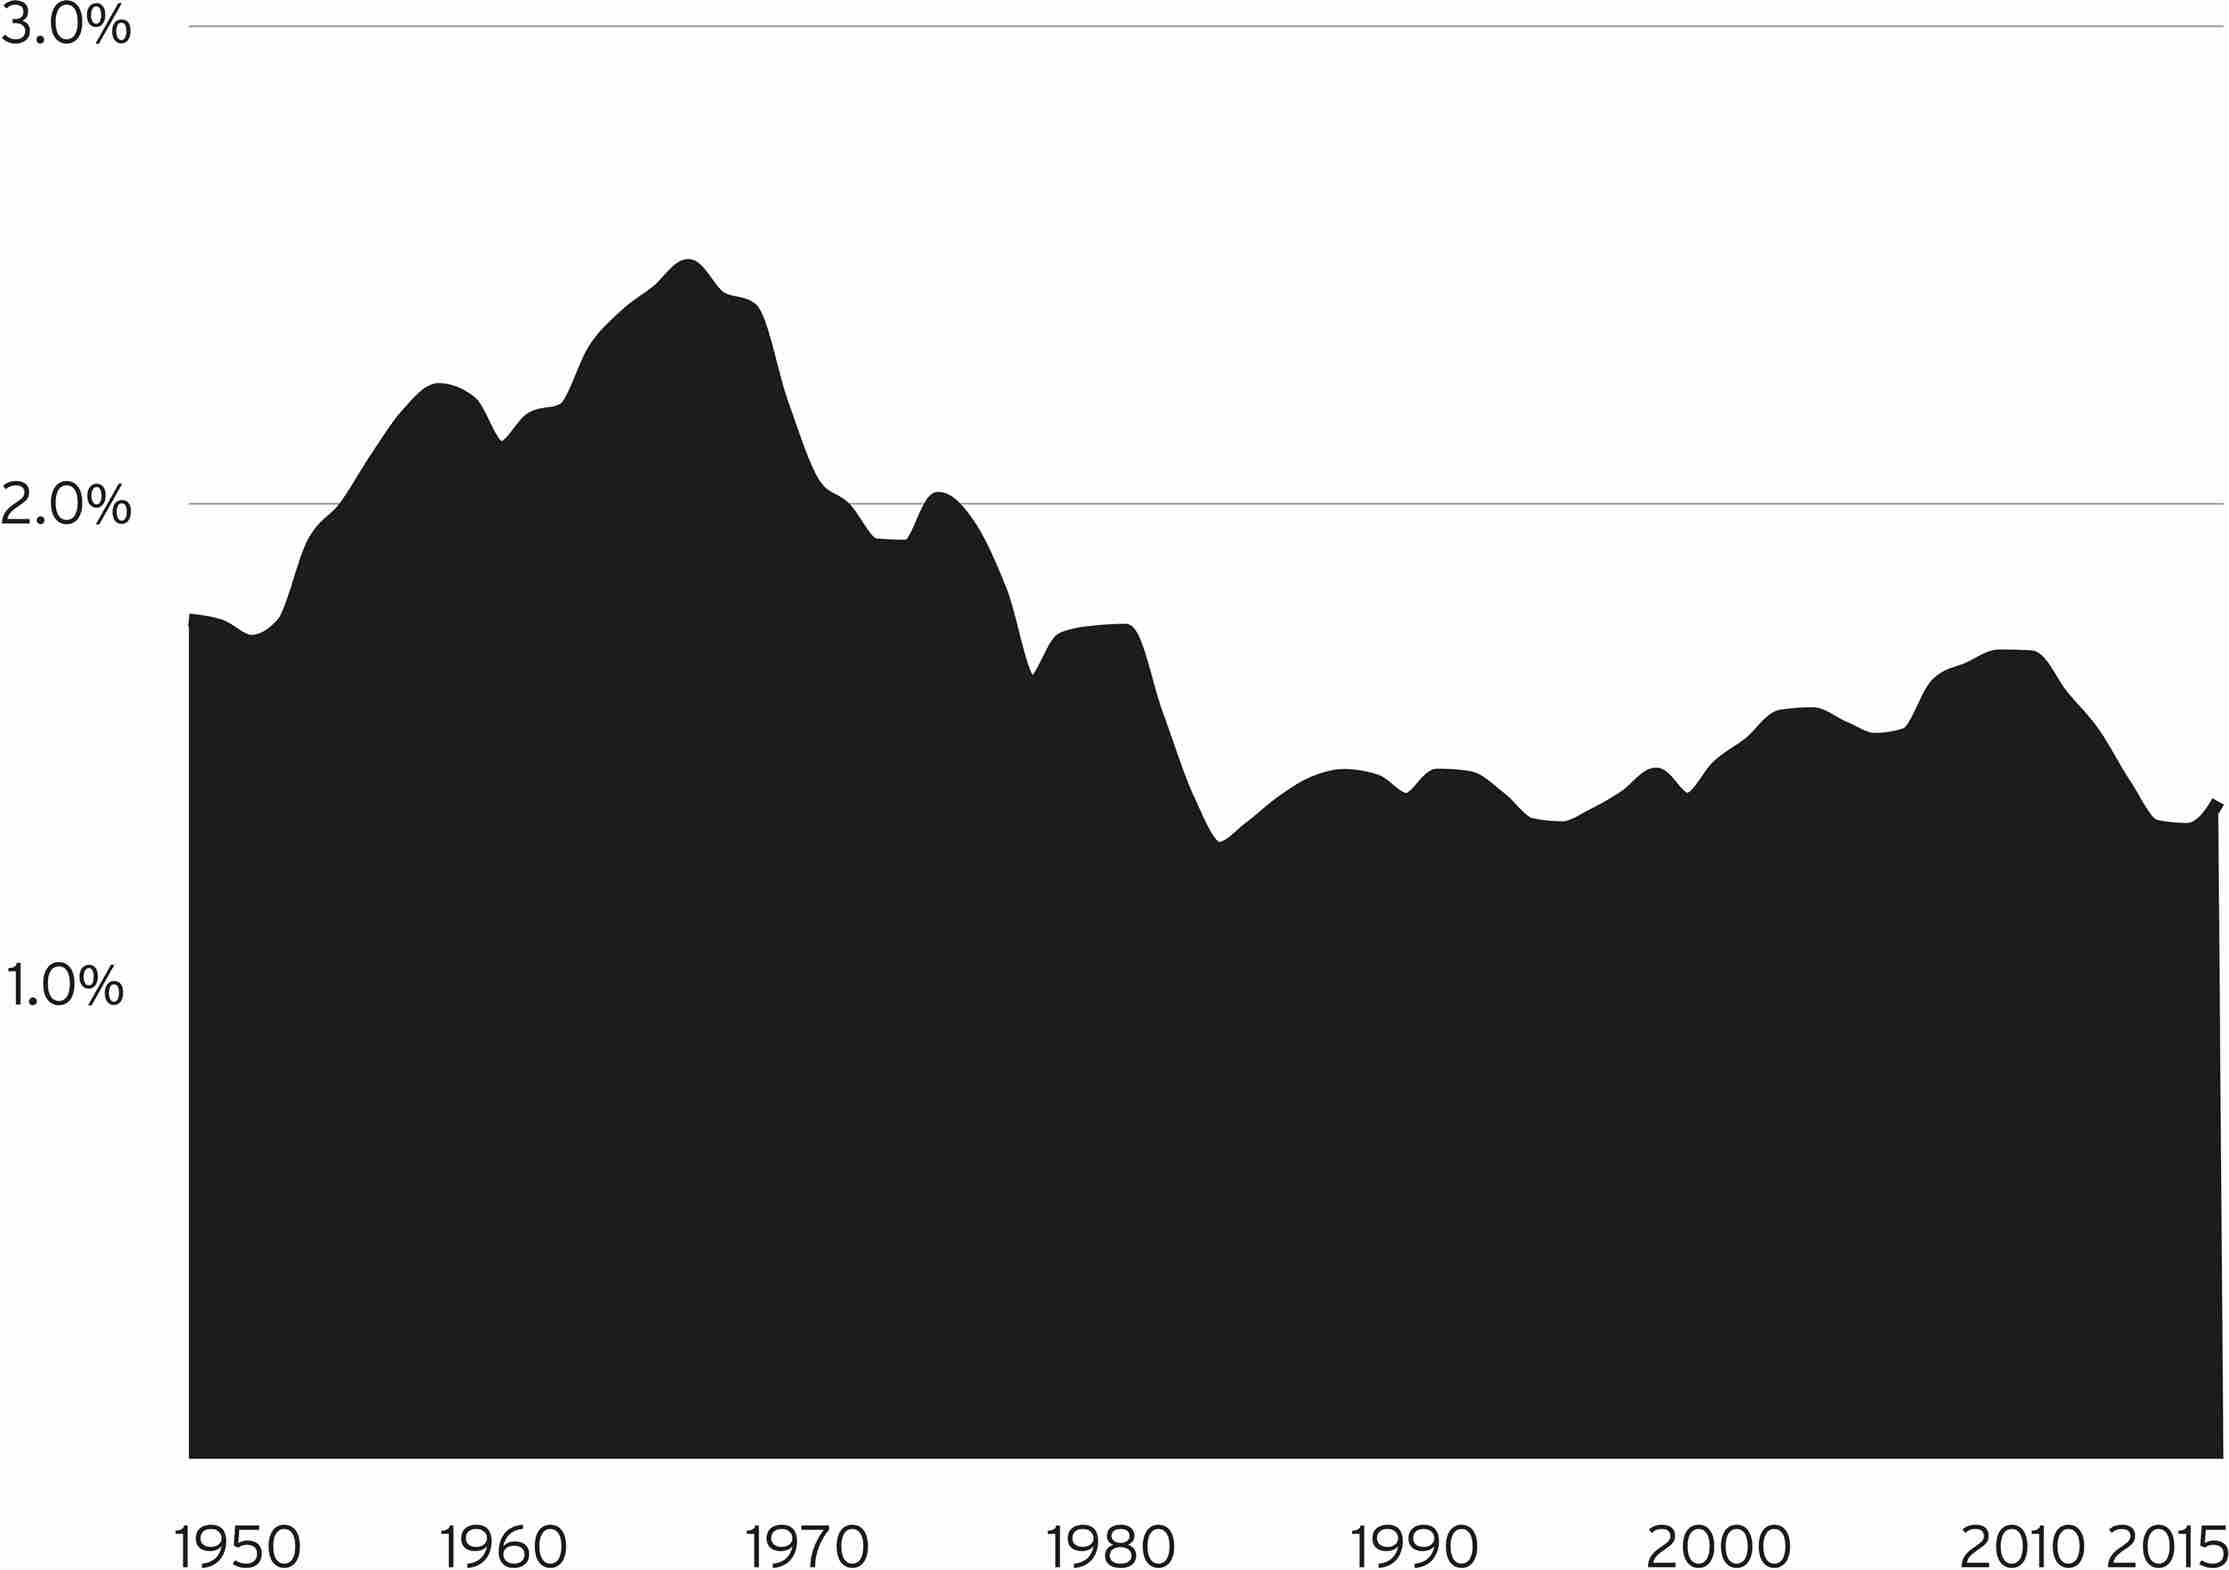
Sources: Economic Policy Institute, Bureau of Economic Analysis, Congressional Budget Office.
Note: Includes public investment in hospital and educational structures, highways, sewers, transportation facilities, and conservation and development.