Chapter 3
Resolving the Entitlements Spending Crisis
How to Drive Health-Care Spending Down while Increasing Access
A century from now, historians and sociologists analyzing the likely decline of the West between 2000 and 2050 will understand what really took place, and why. At present, we do not, as we focus merely on symptoms of decline such as rising debt loads, cutbacks in basic services, and policy gridlock. Our descendants will understand the deeper story that played out, a story of those internal contradictions that undermined liberal democratic capitalism, just as internal contradictions of a different kind discredited communism between 1960 and 1990.
In the case of communism, the contradictions stemmed from system-wide incentives that made it rational for individuals to act in a way that promoted economic decline rather than growth. In the case of liberal democracies, the contradictions stem from incentives for politicians facing reelection to forever mortgage the long-run future. They do so by promising constituents ever-higher levels of benefits that can never be paid for. The true fault in this case lies neither with “craven politicians” nor with “greedy voters.” Rather it stems from the overall incentive structure of the political system, a structure that will lead to the demise of the welfare state as we know it unless current policies are changed.
This chapter does not focus on this deep political philosophical story, a story that Chapter 6 will touch upon. But it squarely confronts the entitlements spending crisis which lies at the heart of it, and which will dwarf all other economic challenges facing most western democracies between 2020 and 2050. I restrict myself to the case study of the United States, and address what can be done to salvage its long-run fiscal integrity during a period when some 79 million baby boomers cease contributing to the kitty and start drawing it down.
Almost all my emphasis is on health-care spending, since this by far is the dominant challenge as compared to Social Security. But Social Security is reviewed as well. The good news is that it is possible to solve the entitlements spending problem, just as we saw in the preceding chapter that a Lost Decade can be prevented in the shorter run. Moreover, the policy solutions that I propose are once again win-win in nature and, since they can appeal to both the Right and the Left, they should dampen today’s Dialogue of the Deaf and break today’s policy gridlock.
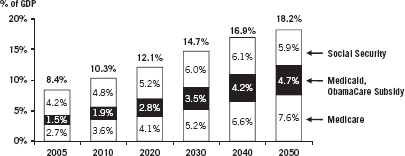
Whereas Chapter 2 focused on resolving the Lost Decade prospect of the period 2011–2020, the present chapter focuses on the much longer-run period of 2020–2050 when a far greater crisis will engulf the United States. If spending on Medicare and Social Security is not reined in, the cumulative unfunded liabilities in the range of $40–$55 trillion will sink the United States financially before the middle of the century. The actual size of these liabilities will depend upon unknowns such as future interest and inflation rates, economic growth, and life expectancy. This crisis is perhaps the only truly systemic risk acknowledged by both sides in today’s Dialogue of the Deaf. The data in Figure 3.1 present an optimistic forecast in which entitlements double only as a share of GDP. Other forecasts show the total rising to over 25 percent of GDP if health-care expenditures are not reined in. In looking at these data, do not confuse the government health-care costs shown with overall health-care spending, private and public. The latter figure is now in excess of 18 percent of GDP and could well rise to 35 percent by mid-century.
Figure 3.1 Entitlement Spending Will Almost Double as a Share of GDP by 2050
Spending on Medicare, Medicaid, and Social Security will soar as 79 million baby boomers retire and health-care costs climb. Total spending on federal health-care programs will triple.
Source: Congressional Budget Office, 2011 Long-Term Budget Outlook.
This crisis is even worse than most concede because of the collateral damage it implies for U.S. military capability. Promises of social benefits win votes, whereas promises of increased military preparedness do not. The Obama administration has already begun canceling a number of leading-edge military programs, such as the F-22 fighter, for budgetary reasons. In the space program, things have even reached the point where the United States must now ask permission from the Russians to ferry our astronauts into space, since we have now terminated the space shuttle.
Yet these cuts to date are nothing compared to what will occur when the entitlements deficit begins to hit hard after 2018. Worse, China has recently made its long-run military and economic ambitions abundantly clear. Its officially acknowledged growth rate of defense spending is 12.6 percent. The unofficial rate is apparently 14 percent. U.S. disarmament will almost certainly embolden China further. Should we pare U.S. defense spending and disarm as most European nations did in order to fund their cradle-to-grave welfare states, will we not behold Chinese warships patrolling the coastlines of Brazil, India, Africa, and even the United States? Unlike many other nations, China will have a putative reason to do so, namely to “protect” its massive infrastructure and resource investments already underway in most corners of the earth.
In the first part of the chapter, I propose an unconventional solution to the runaway health-care spending crisis. This is the only possible solution that leads to much greater access to health care and to an overall reduction in health-care spending as a percentage of GDP. This very strong claim does not merely represent my opinion, but rather is a deduction proven formally in Appendix A. In the second and final part of the chapter, I discuss Social Security. However, most of the attention in this chapter is placed upon health-care spending for three reasons. First, the projected red ink from such spending dwarfs that of Social Security. The numbers really are shocking. Second, solving the problem of health-care spending is inherently much more difficult, both economically and politically, and thus requires more insight. In health care, a product is being produced, distributed, and consumed, while in the case of Social Security, nothing is produced or consumed; all that is at stake is how to resolve the cash flow difficulties arising from the payment of a national annuity.
Inherent Complexity of Health Care
The third reason for the focus on health care is that the nature of the product is highly complex and different from any other product, for reasons first pointed out by the Stanford University economist Kenneth Arrow in a landmark 1963 paper on the economics of health care.1 Illnesses arrive randomly and usually entail big expenses. Thus, to transfer the risks involved, costs must be paid by some form of third-party payer, whether private insurance companies or government. Worse, there are “externalities,” “public goods,” and “moral hazard” aspects of health care that imply that the private sector cannot produce the required products and services efficiently on its own.
The government thus must be involved in the production and distribution of health care, as much as many wish this were not the case. These complexities along with the huge financial stakes involved have transformed health-care reform into the Spaghetti Bolognese of public policy problems. It is so complex that virtually no one has figured out how to disentangle the contentious issues involved in order to arrive at a convincing set of reforms.
Policy advocates of different persuasions have taken advantage of this confusion to press their own particular agendas. Predictably, they cherry-pick data to support their own biased objectives. Hence, on Monday we read a convincing essay about how the “efficiency” of the Cleveland model of health-care provision provides the right template for a national solution. Then on Tuesday we read that tort reform is what is truly needed. On Wednesday we read again about the need to abandon the traditional fee-for-service approach. On Thursday, we read about the inevitability of health-care rationing, and how poor people served by Medicaid will face long waits for third-rate services. The same article will deal with the “inevitability” of death squads of one kind or another limiting our right to life. On Friday, we read about the potential role of nurse-aides to alleviate the problem of the looming shortage of doctors that is increasingly being acknowledged.
Distinguishing the Forest from the Trees
What is missing is any articulation of the distinction between the forest and the trees of health-care reform. Think of the trees here as those myriad micro-issues just cited (e.g., the desirability of the Cleveland model), and the forest as those twin macro-issues of overall access to health care and total expenditure. How does each micro-issue impact overall access and cost? Even if a given micro-proposal sounds good, shouldn’t it be required to pass a test as to whether it increases access and reduces total expenditure? After all, these are the two societal objectives that matter. Yet we rarely see an article in which micro reforms are persuasively linked to macro objectives. There is no micro–macro consistency. Worse, the complexity of the system ensures that, whereas untold numbers of lobbying groups press for micro reforms of many stripes, almost no one represents the interests of the whole—the citizenry keen on improved access and reduced expenditures. After all, it is their standard of living that will collapse if costs continue to soar.
This is a good example of the point that the late Mancur Olson stresses in his Rise and Decline of Nations. As empires get rich, special interest groups become so entrenched that there is no one left representing the collective interest of the people as a whole. So has it become in health care. So politicized are the claims and counterclaims of the individual interest groups, and so lost are the people as a whole that paralysis and confusion set in. Consider those polls showing that about half the American people support ObamaCare, and half do not, while almost all admit that they do not understand it at all.
This recalls a theorem in statistics showing that “complete ignorance” about a matter is best represented by assigning equal odds (in this case 50/50 odds) to all possible outcomes.2 This says it all: The greatest debate on any major policy reform in many decades was so poorly communicated by the rival interest groups involved that the American people ended up in a state of complete ignorance. What an indictment of today’s Dialogue of the Deaf !
The approach adopted in this chapter is altogether different, and shoots for complete clarity, not confusion. We deliberately ascend to that level of abstraction required to address the fundamental question about health care that lies at the heart of today’s debate: How can the increased quantity of health-care services that will be needed by an aging population be provided without the nation going broke in the process? Or, equivalently, can we enjoy both increased “access” to health care in a meaningful sense of that word, along with control of total expenditures far more ambitious than anything else proposed to date? Or is this simply not possible? Is there an inescapable trade-off between these two objectives?
The Solution
The answer I deduce is that both goals are achievable provided that we adhere to a single overall policy requirement as we attack the myriad of policies required in reforming the overall health-care system. The requirement is that the overall (aggregate) supply of health-care services must increase at a rate faster than the growth of demand. At the micro level, this requires that each particular reform (e.g., medical tort reform) must conform to this supply-greater-than-demand goal in its own market. I am being a bit sloppy here because, as will be seen, the words supply and demand are famously ambiguous. The correct statement is that the “supply curve” must shift outward faster than the “demand curve” in the sense of elementary Econ 101. Don’t panic! The idea here is really very simple, and it will be explained later with the help of some very simple graphs.
Remarkably, this one requirement is necessary and sufficient for the delivery of far more services to more people, and for a significant decrease in total health-care expenditures rise a share of GDP. This will be seen to be a theorem, not mere speculation. Conversely, if this supply-greater-than-demand requirement is violated over the long run, total expenditures go to infinity. In this case either the nation will veer toward bankruptcy, or else health care will become very severely rationed as it already is in many other nations. It will be shown that ObamaCare violates this supply/demand requirement due to the primacy it places on demand as opposed to supply. I will derive these surprising results from three Basic Assumptions further on, using a simple supply/demand model drawn from Econ 101. An elementary geometric proof will be given in the main text, which any reader will understand. A formal proof will be found in Appendix B at the back of the book.
The awesome power of deductive logic will thus play an important role in delivering excellent news on the health-care front, just as it did in Chapter 2, where I deduced in two different ways that the United States need not suffer a Lost Decade. Remember yet again that a principal rationale for this book is to demonstrate the true power of precisely this kind of reasoning—reasoning so clear and compelling as to turn down the volume of today’s Dialogue of the Deaf, and to arrive at consensus, not gridlock.
Anyone doubting the logical possibility that we can have our cake and eat it, too, in health-care reform should reflect upon what happens in sectors of the economy other than health care. We produce more food of comparable quality at a cost representing a lower share of GDP than in the past, far more phone calls for a lower share of GDP, more computers, more consumer electronic products, and so forth. The reason why in all these cases is that the supply curve shifted outward faster than the demand curve over time, when these concepts are properly understood. Why should health care be any different? It need not be, for reasons to be seen, and it is astonishing to me that this possibility was never discussed during the entire health-care debate. All parties involved incorrectly assumed that, with rising demand for health-care services, total national expenditure would have to continue to rise, just as it has in the past. This assumption was incorrect.
What is also incorrect is the assumption that one goal of health-care reform should be “cost control,” or “bending the cost curve,” as many put it. This is misleading. It is total expenditure control that matters, not cost control. Success in the former guarantees success in the latter. But the converse is not true, and many proposed cost controls (e.g., reducing what Medicare pays surgeons for a given procedure) will be seen to increase total expenditure due to the law of unintended consequences. Surgeons unhappy with reduced reimbursements will switch fields, causing supply to contract and total expenditure to rise. This too will be demonstrated graphically.
The Ideal: More Health-Care Services, Lower Total Expenditures
I start off with a brief overview of the U.S. health-care debate. This overview is quite different from most others in that it analyzes the debate in terms of its implications for the future supply and demand of health-care services. Particular emphasis is placed on ObamaCare in this regard, and the specific provisions of the 2010 legislation are summarized, because there is widespread ignorance of the true content of the new law. Next, our main result is established on how to reform health care. Three Basic Assumptions (axioms) are introduced that “almost anybody” would wish a good system to satisfy. A simple supply/demand model is then fleshed out.
This model demonstrates graphically how any health-care system consistent with the fundamental supply-greater-than-demand policy requirement cited previously will satisfy all three Basic Assumptions. ObamaCare as currently formulated is then shown to violate either one or two of the three Basic Assumptions. The irony here is that President Obama himself implicitly endorsed all three assumptions in stating his own health-care reform goals. What went wrong? Poor economic logic won the day.
A Supply/Demand Assessment of ObamaCare
President Obama’s health-care initiatives have focused on controlling exploding health-care costs and improving insurance access for low- and middle-income individuals and families who either do not have insurance or struggle to pay for it. Few would argue with the merit of either goal. Currently, an estimated 50 million Americans are without health insurance—a number that is expected to balloon to 60 million by 2015 without reform.3 At the same time, the United States spends 50 percent more on health care per capita than the next highest-spending country, yet ranks 50th in total life expectancy. Furthermore, the growth rate of such medical expenditures is out of control. While the overall price level increased 17 percent from 2000 to 2006, health-care premiums increased 87 percent over the same period.4 Such escalating health-care costs have thus made health-care reform essential to future national solvency.
On March 23, 2010, President Obama signed the Patient Protection and Affordable Care Act into law. The new law, and changes that have been made to the law by subsequent legislation, clearly focuses on provisions to expand coverage and control health-care costs. First, via new health insurance exchanges, 48 million Americans will be able to purchase affordable health coverage at lower rates. Second, an estimated 5.6 million Americans with preexisting conditions will no longer be denied insurance—banning such discrimination completely by 2014. Third, tax credits for small businesses and for individuals will help Americans pay for insurance. Specifically, by 2014, nearly 60 percent of small businesses will be eligible for tax cuts of up to 50 percent of their insurance premiums. Additionally, middle-class individuals who do not receive insurance through employment may receive significant tax credits toward the new health insurance exchanges. Finally, health-care reform will prevent personal bankruptcies by capping annual out-of-pocket costs for families who receive insurance through the exchanges or a small business.
On a second front, the Act introduces a number of measures to control medical expenditures. But a tension always existed between these two goals of increasing coverage and controlling costs. First, expanded insurance coverage will result in a sudden surge of demand by millions of previously uninsured Americans and thus raise the total cost of health care in America, other things being equal. Second, while measures to control costs were included, such as reduced reimbursements to physicians for Medicare services rendered, the provisions to do so were problematic from the start. For example, the legislation’s concept of cost control is self-contradictory because most cost-control measures end up restricting supply, which in turn not only raises prices but also generates rationing of care. Third, the new Act provided little of what was actually needed, namely a radical increase in the supply of services that both lowers costs and meets increased demand without rationing.
Since almost all public discussion has centered on the demand side of health-care reform (greater access to insurance), as does ObamaCare itself, and since there is little appreciation of the critical role of supply, what is needed up front is a supply-side assessment of health care, pre- and post-ObamaCare. In this section, I start off by reviewing several supply-side challenges to the health-care market prior to the new Act. While much of the blame in Washington for escalating health-care costs in the past has centered on rapacious private insurance companies and greedy doctors, supply-side developments played a role as well: a grouping physician shortage, an inefficient distribution of medical services, and a complete failure to automate services that should have been automated long ago.
Next, I offer a summary of how the new Act impacts both the demand and supply-side challenges. The Act’s unfortunate bias toward boosting demand much more than supply is identified. Finally, I introduce three Basic Assumptions that a good health-care system must satisfy, and from these deduce a general solution to the entire problem.
Pre-Act Supply-Side Challenges
Before assessing how the new Act addresses health-care supply shortages, it is important to understand the supply-side challenges that already existed before the bill was passed. Two recent research reports on U.S. health-care supply discuss this issue in depth. First, in November of 2008, Michael J. Dill and Edward S. Salsberg of the Association of American Medical Colleges (AAMC) wrote an extensive report outlining the ongoing and escalating physician supply shortage in the United States. In their report, “The Complexities of Physician Supply and Demand: Projections Through 2025,” Dill and Salsberg recommended a 30 percent increase in U.S. medical school enrollment and an expansion of graduate medical education (GME) positions to accommodate faster growth in the demand for medical services.5
Such recommendations were based on “recognition of factors likely to influence future physician supply and demand, such as the aging of the U.S. population and the physician workforce.” Indeed, according to their research, which assumed a continuation of current supply and demand patterns (i.e., their analysis did not factor in Obama’s health-care reform and its impact on demand), the United States would, at best, have a shortage of 124,000 physicians by 2025.
Dill and Salsberg then predicted the impact of these shortages on the health-care system. In particular, they cited the prospect of much longer patient wait times, shorter visit times with physicians, and, in some cases, loss of access altogether. Additionally, given the mounting evidence of health-care quality variation based on geography and socioeconomics, they suggest that more rural and poorer areas of the country, especially in the South and West, would suffer the most under existing supply and demand patterns. Again, their research took place prior to 2009 and thus did not consider the impact of increased demand for health services from the new Act.
A second research report, prepared on behalf of the Physician Foundation and directed to President Obama in September 2009, “Physicians and Their Practices under Health-Care Reform,” reinforces several of the AAMC’s earlier findings on supply shortages while overlaying the impact of increased demand from the forthcoming health-care act. In this report, the Physician Foundation calls upon the President and Congress to assist with the expansion of medical schools, to lift the Medicare graduate medical education cap, and to consider shortening the length of medical training required.6 The report also discusses the issue of the lack of primary care and rural physicians. Their shorter-term recommendations include the need for increased investments in technology and information services to improve the productivity of medical services of all kinds.
Summary of the New Act
I now want to discuss how ObamaCare has impacted the supply/demand imbalance cited earlier. Did it improve matters, or exacerbate the preexisting imbalance? But before reading on, you have a choice. You can either continue straight on, or else you can first consult Appendix A at the back of the book. Appendix A will permit you to review many specific provisions of the new Act in bulletized form. Surprisingly few people who discuss health care seem to understand these provisions. I have made this summary different from other summaries I have seen by factoring it into two complementary parts: first, ObamaCare’s impact on demand, and second, its impact on supply. The material in Appendix A will deepen and reinforce what now follows.
Ineffectiveness of the New Act’s Provisions for Supply
Given the detailed supply-versus-demand provisions of the new Act summarized in Appendix A, and given the pre-Act supply-side challenges cited earlier, where do matters now stand post-Act? Three serious issues arise in this regard.
Supply/Demand Imbalance
To begin with, the new legislation is very much biased toward policies that increase demand for health-care services, at the expense of initiatives to increase future supply. More specifically, in contrast to the Act’s provision for increased demand (“access”) reinforced by concrete requirements and penalties for both individuals and companies regarding insurance mandates, the provisions for increasing supply of health-care services are surprisingly vague and long-term oriented. Indeed, when Edward Salsberg of the AAMC, coauthor of the 2008 study cited earlier, was recently asked about this matter, he replied:
The bill does not do a lot to directly raise the supply of health-care professionals. It has a number of provisions that might lead to a change in specialty and geographical distribution, such as the incentives for primary care and the changes in the National Health Services Corp. program. The Health Resources and Services Administration has also been creative in providing additional funding to increase primary care and support for education. In the longer term, it may be the strengthening of the workforce data collection and the establishment of the new National Workforce Commission that will help raise awareness of the need to increase the education and training pipeline.7
Salsberg’s key insight lies in the recognition that the new bill does not do much to “directly” raise the supply of health-care professionals. While the demand provisions have teeth (laws, penalties, and fines), the supply provisions at best constitute a wish list. The difference is stark and disturbing.
Reimbursement Incentive Effects
The new Act is silent on the disincentive effects that physician reimbursement policies have on the supply of health-care services. Professor Tyler Cowen of George Mason University, who specializes on the supply side of the health-care issue, is convinced that the new Act will necessarily result in extensive rationing of services. As he wrote in the New York Times on December 11, 2010:
The underlying problem is that doctors are reimbursed at different rates, depending upon whether they see a patient with private insurance, Medicare, or Medicaid. As demand increases relative to supply, many doctors are likely to turn away patients whose coverage would pay the lower rates. Let’s see how this works. Medicare is the major federal health program for the elderly, who vote at high rates and are politically influential, and so it is relatively well financed. Medicaid, which serves poorer people, is paid for partly by state governments, and the poor have less political clout than the elderly, so it is less well financed.
Depending on the state and on the malady, it is common for Medicaid to reimburse doctors at only 40 percent versus 80 percent the rate of Medicare. Private insurance pays more than either. A result is that physicians often make Medicaid patients wait, or refuse to see them altogether. Medicare patients are also beginning to face lines, as doctors increasingly prefer patients with private insurance. Access to health care will become problematic, and not only because the population is aging and demand is rising.
Unfortunately, the new health-care legislation is likely to speed this process. Under the new law, tens of millions of additional Americans will receive coverage, through Medicaid or private insurance. The new recipients of private insurance will gain the most, but people previously covered through Medicaid will lose. . . . If you hear of a new solution to the health care puzzle, put aside the politics and instead think through the endgame. Ask not about the rhetoric, but rather about the reimbursement rates.
The Shortage of Physicians Crisis
A topic that is rarely discussed by those proposing reforms to health care is the looming shortage of doctors. This is extremely important for the coming explosion of health-care spending since nearly 60 percent of worldwide health-care spending is accounted for by the clinical workforce. Looking forward, a mass exodus of currently practicing physicians will occur at the very time when demand explodes due to baby boomer retirement. More specifically, more than one-third of doctors practicing today are over 55 and plan to retire within 20 years. Additionally, the shortage of doctors will be particularly acute in cardiology, oncology, and geriatrics, all of which serve the swelling numbers of the elderly. You might think that the sharp increase in demand that is predicted would trigger a corresponding increase in supply. But this standard economic assumption does not hold true in the health-care sector. The supply of doctors is highly regulated as are so many other aspects of health care.
The AAMC estimates that the United States could face a shortage of between 124,000 and 159,000 doctors by 2025. Yet this estimate does not take into account the disincentive effects on the supply of physician services due to the reimbursement rate problem just discussed. For the nonrich on Medicare and Medicaid, the heightened rationing of services this shortage portends could reach crisis proportions. But the situation is even worse. Compounding the wave of retirements that are coming is the fact that the number of medical school graduates choosing to pursue a career in family medicine has already fallen by 27 percent since 2002, and this decline could well accelerate. The number of general surgeons in the United States has decreased by 26 percent since 1981. Emergency rooms are already bursting to capacity, and there is a shortage of on-call specialists. The statistics are frightening indeed.8
Inexplicably, the new health-care Act gives little heed to this shortage of doctors, and fails to propose policies to redress it. In fact, the new Act exacerbates the physician-supply crisis by cutting funding for training new doctors. In a January 19, 2011 Wall Street Journal article, Dr. Herbert Pardes, CEO of New York-Presbyterian Hospital, explained how. To begin with, the government began to foster a future doctor shortage in 1996 when Congress capped the number of new doctors Medicare would pay to train, a practice that continues to this day.
Training new doctors has substantial costs because of all they must learn and how carefully they must be supervised. Without Medicare reimbursements, many hospitals could not afford to maintain these critical training programs. . . . Recently, the President’s National Commission on Fiscal Responsibility and Reform proposed cutting Medicare funding to train doctors even further, by $60 billion through 2020. If this cut is enacted, the doctor shortage would get far worse. . . . We cannot insure 32 million more people and cut funding to train doctors when one-third of all doctors are over age 55 and plan to retire.
But there are solutions, as Professor Cowen also pointed out in his New York Times column: “We could go further by giving greater scope to nurse practitioners, admitting more immigrant doctors, reforming malpractice law, and allowing cheap, retail Wal-Mart medical care, all to increase access and affordability. Yet these changes do not seem to be in the offing, so access is likely to decline.” Note that all these policies are supply-side by nature.
Many other approaches exist for redressing the coming supply-side crisis, notably health care delivered by expert systems, and these will be discussed later in this chapter. For the moment, what we have seen is that the new Act has virtually no supply-side teeth. At best, the Act implicitly encourages increased supply via the elimination of “inefficiencies” over time. Haven’t you heard that promise before coming from Washington? Overall, what is striking about ObamaCare is its asymmetrical focus on expanded demand at the expense of expanded supply. What can be done to remedy matters?
A Supply-Side Solution to the Health-Care Crisis
It will now become clear why I have analyzed today’s status quo through the lens of supply and demand. It turns out that, unless the proper dynamics of future demand and supply growth are given primacy of place in health-care reform, no solution to the crisis is possible. But when a proper supply/demand perspective is adopted, a lasting and workable solution to the health-care challenge can be identified. But what exactly is a “proper perspective” in this context?
The concept is somewhat abstract, and will require a quick review of some very basic Econ 101. With this review in hand, our main result follows: a derivation of the overarching supply-greater-than-demand policy requirement that a health-care system must satisfy if it is to be consistent with our three Basic Assumptions. We will utilize this policy requirement to arrive at some concrete proposals that can resolve today’s health-care crisis in a truly win-win manner. Incidentally, it is in this last section that concrete micro-policy proposals such as tort reform and enhanced automation of services can be properly appraised for their macro value.
Review of the Law of Supply and Demand
While most of us assume that we understand the simple concepts of supply and demand, we really do not, as they are actually quite subtle. The late Paul Samuelson of MIT (America’s first Nobel laureate in economics) always stressed this point.
To appreciate this, suppose that you want to predict the future price of widgets. Suppose you believe that, because of new consumer trends, demand will rise from 200 million units this year to 300 million next year. Given this development, you intuitively conclude that the price of widgets will rise dramatically. But wait: Didn’t I learn in Econ 101 that supply must always equal demand at any market equilibrium? But if this is true, then won’t supply also have to increase to 300 million units to equal the demand forecast? But if both supply and demand rise in tandem, why would the price need to rise at all? Confused? You are in good company!
What the true law of supply and demand predicts will happen is that both supply and demand will increase to some output level lying between 200 and 300 million units, say 250 million. Price for its part will also rise, but less than you originally suspected. Why will it rise? Because on the one hand, a higher price is required in order to encourage higher supply (up to 250 million from the initial production level of 200 million). On the other hand, a higher price is needed to encourage reduced demand (down from 300 to 250 million). This is how the new market equilibrium output of 250 million is achieved. You now understand supply/demand/price somewhat better, but you are still somewhat confused. In particular, you don’t know how to predict which of an infinity of market outcomes will occur because you do not know how to unscramble supply from demand, analyze each separately, and then put them back together. How would you predict an output of 250 million as opposed to 230 or 280 million in our example?
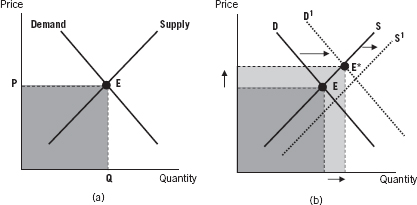
To fully understand what is happening, you must make the giant leap required to make sense of all markets, and of much basic economics. More specifically, you must abandon the intuitive urge to think of changes in price or quantity in terms of numbers, and the tendency to forecast these numbers. For this will get you nowhere, as you have just seen. Rather, you must think more abstractly about what economists call supply and demand functions, or “curves,” and try to forecast how each curve will change for the particular product and time horizon you are analyzing. The matter is summarized in Figures 3.2(a) and 3.2(b), which appear in the first chapter of any Econ 101 textbook.
Figure 3.2 (a) Supply and Demand Curves—Depicting a Market Equilibrium E (b) Supply and Demand Curves—Depicting a Change in Equilibrium from E to E*
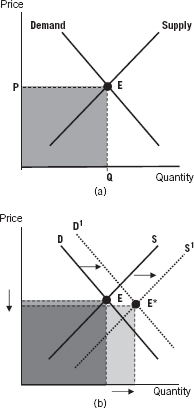
Figure 3.2(a) simply defines “market equilibrium” price and quantity as the point E where the supply curve and the demand curve intersect. Of course, the very concept of a supply and demand curve is itself quite subtle, since such curves do not in fact exist except as hypothetical constructs! To understand why recall that a given supply curve specifies how the quantity supplied will change as prices change. The same holds true for a given demand curve. The construct is hypothetical since, at any given point in time, there will be only one price and one quantity that you can observe. Thus, all other points on a supply (or demand) curve will represent what you think the quantity supplied (demanded) would be for each different possible price. Each curve is hypothetical in this sense. One last point: Recall that the supply curve usually slopes upward, indicating that higher prices encourage greater output. Conversely, the demand curve slopes downward, indicating that higher prices discourage consumption.
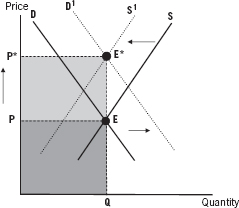
How to Forecast Price Changes
Figure 3.2(b) sketches how you might ideally forecast a change in market equilibrium from E to E*. It is deceptively simple: just make your best forecast as to how each of the two curves will shift (and the reasons behind both shifts are usually unrelated), and then take note of the new point of intersection E*. This will be your best forecast of future price and quantity, generated by a prediction of how two hypothetical constructs will shift. This is the true meaning of the law of supply and demand. It rubs in that you cannot forecast future changes in price or quantity without taking both supply and demand properly into account. This is done by representing each in terms of curves (functions), not numbers.
Samuelson’s point was that, while most students may learn all this in their studies, they soon forget it. Hence in the real world, you regularly encounter misleading predictions as to how “prices will rise because of soaring demand,” as if supply plays no role, or “prices will fall because of a glut of supply,” as if demand plays no role, or “health-care cost controls will reduce health-care expenditures,” as if most cost controls do not possess incentive effects that reduce supply and hence raise prices and expenditures. No wonder most future price forecasts are so poor! The failure to consider the mutually intersecting roles of supply and demand is absent from almost all discussions about health-care reform, dominated by their populist emphasis on “more access for everyone.”
Why Most Supply/Demand Analysis Is so Poorly Implemented in Practice
Even those who do understand the basic points just raised do a poor job in applying the law of supply and demand in real-world forecasting applications. Why is this true? I think there are two basic reasons. First, in most real-world applications, people are frightened off by the statistical challenge of “estimating” the location of a given market’s supply and demand curves, and then of predicting how and why each curve will shift over the forecast period. Doing so is difficult, whether at an intuitive or at a more formal level of analysis.9 Most policy analysts do not know how to do so, and thus bypass such analysis in practice. Nonetheless, in an issue of great national importance like health care, it must be carried out lest erroneous forecasts result, and bad policies be adopted.
A second reason that we rarely see supply/demand curve analysis in policy papers—and never in newspapers or magazines—stems from the fact that the very concept of a supply or demand “curve” is abstract and counterintuitive. As stated previously, this is because any such curve is in effect a hypothetical construct specifying what quantity would be supplied/demanded at any and every price. This reality intimidates many analysts.
Interestingly enough, I have looked for years to find a college economics curriculum with a course on price forecasting. But I have never seen one! Now what does that tell you about the extent of economic literacy when the behavior of price changes, from oil to wheat to health care, is front-page news all over the world? We all talk about and speculate on prices, but know little about how they will change, and why. This offers yet another example of the price paid for the absence of deductive logic in public policy dialogue.10
Using Supply/Demand Analysis to Forecast Total Expenditure
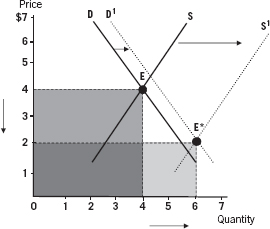
Most supply/demand models are used to predict what will happen to price. If we believe the demand curve will shift out to the right in a market, while the supply curve will remain where it is, we can learn from the model how much price will rise, which is what we want to know. We also learn that the quantity produced at equilibrium will increase, but that is usually of no interest. Now in our health-care analysis, we wish to focus on a third variable that is rarely discussed, namely changes in the total expenditure implied by the market equilibrium. Total expenditure is just the arithmetic product of the two coordinates P and Q at the equilibrium point where supply equals demand, as we see in Figure 3.3. That is, total expenditure will be P = Q. In a soft-drink market, if Q is 40 million bottles, and P is $2 per bottle, then total expenditure is 40 = $2 = $80 million.
Geometrically, this product is simply the area (length times width) of the rectangle defined by the dotted lines stemming from the equilibrium point. And as we see in Figure 3.3, it is possible to compare the change of total expenditure by simply comparing the areas of the two rectangles corresponding to the “before” and “after” equilibrium points E and E*. We will exploit this fact in depth in what follows. This completes the review of those simple supply-and-demand concepts that we will utilize.
Figure 3.3 Computing and Comparing Total Expenditure
Three Basic Assumptions for an Optimal Health-Care System
The three Basic Assumptions are assumptions that almost anyone on any side of the health-care debate would find reasonable. Once these axioms are introduced and justified, I demonstrate in Proposition 1 the fundamental policy requirement needed to satisfy all three of them, namely that the supply curve must shift outward more rapidly than the demand curve. Proposition 2 establishes that bankruptcy results if demand shifts outward faster than supply does. Proposition 3 demonstrates how ObamaCare satisfies at most two of these assumptions, and possibly only one, with dire consequences for health care and indeed for the nation’s fiscal future.
What is particularly interesting is that our Basic Assumptions closely parallel President Obama’s stated goals for health-care reform. What the three propositions reveal is that the reasoning process connecting the Obama administration’s original goals to its policy conclusions was very problematic. Otherwise, how could ObamaCare be inconsistent with these goals? With distinguished economists like Lawrence Summers and Christina Romer on board at the time, one wonders how we ever could have witnessed such economic illogic, especially given the extremely high stakes involved.
Increased Access to Health Care
This first Basic Assumption is that health-care coverage should be significantly expanded. This is sometimes referred to as the desirability of greater “access” to health care, or greater “demand” for it. Both increased coverage and increased demand are modeled geometrically by an outward (rightward) shift of the aggregate demand curve for health-care services. “Aggregate” means we have lumped all such services into a whole. More specifically, we assume that at any given price for health-care services, there is greater demand than before. This is what it means for the entire demand curve to shift outward.
This increase in demand will be fueled in practice by an increase in health insurance coverage, and by the aging of the population as well. Note that we are limiting ourselves in Assumption 1 to increased demand alone, represented by the outward-shifting demand curve, and not to an increased quantity of services that actually get delivered at the new equilibrium. Increased demand need not guarantee an increase in quantity, as we shall soon see.
There are both moral and economic justifications for the assumption that more people should have access to health care and to insurance coverage. On economic grounds, it is widely believed that civilized modern societies should provide universal health insurance of one form or another. There are two reasons for this. First, it is believed that a healthy workforce improves economic output and efficiency. Second, as regards insurance, the opportunity to pool and socialize risk has long been recognized. Yet modern economic theory goes one step further and demonstrates that the economic norm of efficiency (“No waste!”) requires such pooling of risk. The main point in a health-care context is that we no longer need a moral justification for risk-pooling, since economic efficiency requires it.11
This is not to say that moral considerations are irrelevant to the health-care access debate, for they are not. Yet the situation has always been murkier from a moral stance than from an economic stance. Among the principal moral issues that arise are: Does a citizen have some kind of an absolute right to health-care coverage? And if so, does “society” have an obligation to fund such coverage, if the citizen cannot? On the first point, some theorists claim that the right to health care is a “primary good” in the sense introduced by the late Harvard philosopher John Rawls, namely a good that is absolutely necessary for everyone, such as food and shelter. This is of course the liberal position.
Conservatives, however, often argue that there is no absolute right to health care, and that “socialized medicine” may bankrupt the country. Their champion would be the late Harvard philosopher Robert Nozick. The core issue here is one of the deepest in all of moral theory, namely that of distributive justice: How should the economic pie be allocated, and why? Who owes what to whom? This is discussed in the last chapter of this book.
For the moment, the main point is that the norm of economic efficiency alone implies the need for greater risk-sharing and for some version of universal coverage, to use a term that has become politically charged and should not be. There is no need to rely upon subjective “fairness” arguments for the reasons Kenneth Arrow established in his 1953 and 1963 papers that we have cited. His arguments also exposed the ineligibility of “free market solutions” to many health-care problems. These various arguments should help to bridge the Left-versus-Right divide in health-care policy since everyone espouses efficiency as a societal norm—liberals and conservatives alike. After all, who wants the opposite, namely waste? This concludes our justification for the first Basic Assumption, namely the need for greater access to health care.
Increased Supply of Health-Care Services
This second Basic Assumption requires that, whatever the nature of the health-care reform plan to be adopted, a greater quantity of health-care services must be delivered in the future. This is because of the growing need for them, largely due to demographic reasons, and because of the increased insurance coverage that is likely under ObamaCare.
This assumption complements Assumption 1 in a natural manner. To begin with, note that the president’s goals (and my own) of “more access” to health care via new insurance will be vacuous without a guarantee of an increased supply of services. In economic terms, the supply curve of health-care services must shift outwards (rightwards) to complement the outward shift in the demand curve specified by Basic Assumption 1. If it fails to do so, or for some reason shifts backwards, then a big problem arises: The price of services (where the new supply and demand curves intersect) plotted on the vertical axis will have risen sharply, unless this is “prevented” by price regulation that inevitably gives rise to rationing. Rationing almost always implies that the rich will have access to services, but the poor will not.
To sum up, “more access” provided by extended insurance will prove a Pyrrhic victory without more supply. Those possessing expanded insurance will discover that, despite their newfound ability to pay, their phone calls to doctors will go unanswered. In just this vein, Dr. Herbert Pardes, CEO of the New York-Presbyterian Hospital, has publicly warned of a coming shortage of doctors and of unanswered phone calls as a result of ObamaCare.12
Longer-Run Reduction in Health-Care Spending
The third Basic Assumption reflects the necessity for a longer-run reduction of total health-care spending from today’s level of 18.6 percent of GDP. Note that this specifies a long-run reduction in total cost as a share of GDP, not merely a decrease in the growth rate of total cost of Medicare as President Obama sought. This is a very significant difference.
The forecast explosion of U.S. health-care spending from today’s 18.6 percent of GDP to upwards of 30 percent by mid-century imperils the fiscal health of the country, and will place every other worthy goal of government spending out of reach. The solvency of the U.S. government itself will be at risk, its creditworthiness will continue to be downgraded, interest rates will rise, and debt-servicing costs will explode nonlinearly.13 A flattening out or, better yet, an outright reduction of health care’s share of GDP is required to spare us these indignities, assuming that the United States wishes to be able to afford infrastructure investment, education funding, Social Security, and a strong defense system. This is why I have introduced this third Basic Assumption.
President Obama’s second main goal in health-care reform (the first was expanded access) was a reduction in the growth rate of total expenditures on health care. This is similar in spirit to our Basic Assumption 3, but much weaker. The cost of health care as a share of GDP would still rise, but at a lower rate. My assumption is far more extreme. The prospect that total health-care spending could actually decrease as a share of GDP was never once discussed as a possibility during the entire health-care reform debate of 2007–2010. Nonetheless, I believe my stronger assumption to be absolutely necessary in the long run, given the overall goals of our nation. Health care may be important, but it is hardly the altar on which all other goals should be sacrificed.
Are These Three Basic Assumptions Incompatible?
How could significantly increased demand matched by increased supply (Assumptions 1 and 2) possibly be compatible with outright reductions in the total cost of health-care spending (our Assumption 3)? This is surely too good to be true! After all, many critics of the president viewed his own more modest goals of increased access and a reduced growth rate in total health-care spending as incompatible. The resulting politics were predictable. Proponents of ObamaCare celebrated the first goal (increased access), whereas opponents focused on a future explosion of costs, which they claimed would increase the growth rate of health-care spending. They made political hay of such Democratic legislative tactics as attempting to pay for the new system by stealthily reducing future payments to doctors by over $400 billion in future years, one form of “cost control.” The debate about health care on the op-ed pages degenerated into a reductio ad absurdum. Recall this Wall Street Journal editorial from December 3, 2009:
We have now reached the stage of the American health-care debate when all that matters is getting a bill passed, so all news becomes good news, more subsidies mean lower deficits, and more expensive insurance is really cheaper insurance. The nonpolitical mind reels!
The Three Main Results
The good news is that all three Basic Assumptions we have proposed are in fact mutually compatible, as I will now show.
Proposition 1: Consider a national health-care market whose aggregate supply and demand curves possess normal upward and downward slopes respectively. Suppose the government implements a reformed health-care system such that the aggregate health-care supply curve shifts out to the right faster than the aggregate demand curve does, no matter how large or how small this “shift gap” may be, and no matter how rapidly the demand curve itself may be shifting outward.
Then any health-care plan consistent with this fundamental policy requirement will satisfy all three of our Basic Assumptions in the longer run. More specifically, whereas total health-care spending may increase in the shorter term, it will always peak and then decrease continually toward zero in the long run. Our policy requirement is both necessary and sufficient for this happy outcome to occur.
Note: The time required before total expenditure peaks, and the subsequent rate of decline will depend upon specifics such as the slopes of the supply and demand curve, the rates at which the two curves shift outward, and the health-care price/quantity coordinate values at the outset. In particular, the greater the rate at which the supply curve shifts out relative to the demand curve, the more rapid will be the decrease in total expenditure after it has peaked. Additionally, the more the outward shift of the demand curve is slowed down via the elimination of demand for wasteful and reduplicative services, the faster total expenditure will fall.
Proof: An intuitive, geometric proof is sketched below, and a formal proof can be found in Appendix B at the back of the book.
The Macro–Micro Link in Health Care
Proposition 1 is a macro-requirement about the entire health-care system. Suppose we model the “product” being supplied/demanded in an abstract manner as some index of “aggregate well-being” of the population as a whole. “Price” will be the dollar cost to the nation per unit of well-being, and “quantity” will be the number of units of well-being delivered. Total expenditure, as always, will be Price × Quantity. An increase in price increases supply and reduces demand for units of well-being. Since “aggregate” or macro health care is some weighted sum of the individual micro components of health care (MRI scanners, diagnostic tests, surgeons, and so on), Proposition 1 carries clear implications for what must happen at the micro level if the macro conditions of the Proposition are to be met.
In the simplest case, suppose that there are n sectors, each with its own supply and demand curve. Suppose, moreover, that the supply curve shifts out faster than the demand curve in every sector. This would guarantee that the conditions of Proposition 1 will be fulfilled since the aggregate supply curve would shift out faster than the aggregate demand curve would. A weaker requirement would be that curve shifts of this kind take place in “enough” sectors such that, in aggregate, supply shifts out more rapidly than demand. Very technical problems of market “aggregation” arise here and are outside the scope of this book. The most intuitive way to think about all this is to understand that the law that applies to the forest must be consistent with the law that applies to the trees.
In the discussion that follows, concrete policy proposals will make clear how important this consistency between the forest and the trees really is. I shall also discuss exactly how any supply curve can be shifted outward much more rapidly, as is required by Proposition 1. Particular emphasis will be placed upon the need to decartelize, deregulate, and automate the provision of health-care services. For the increased competition and productivity that these reforms give rise to is what outward-shifting supply curves are all about. They lie at the heart of what is needed for successful health-care reform.
Overall, Proposition 1 offers very good tidings. The United States need not go broke in providing a far greater quantity of health-care services to far more people than ever before—because it can do so with total expenditure falling as a percentage of GDP. As in the case of our Lost Decade analysis, we really can have our cake and eat it, too. But now for the bad news—two final Propositions that are sobering:
Proposition 2: If health-care reform does not meet the preceding policy requirement, and in particular if the aggregate demand curve for health-care services shifts outward more rapidly than the supply curve, then total expenditures will rise without limit to the point of bankruptcy and a systemic collapse.
Proof: Please refer to Appendix B at the end of the book.
The final piece of bad news concerns ObamaCare:
Proposition 3: The Obama administration plan satisfies the first of our three Basic Assumptions (more demand for services via expanded insurance), and possibly the second (more supply of services). But it does not satisfy the third Basic Assumption (a longer-run reduction in total health-care expenditures as a share of GDP).
Proof: A simple geometric proof appears after the geometric proof of Proposition 1 that follows.
Two Simple Geometric Proofs
Geometric Proof of Proposition 1: I now present an intuitive geometric proof of our first result.
Think of the two market equilibria E and E* shown in Figure 3.4 as representing the health-care market “before” and “after” new policies are put in place that satisfy our fundamental policy requirement. The numbers shown for each axis are hypothetical and illustrative. The period shown could represent, say, 15 years. Note in the figure that the supply curve shifts outward far more than the demand curve does over the period in question, as required by Proposition 1. Since the outward supply shift must be greater than the outward demand shift each and every year, by assumption, the cumulative gap between the location of the supply and demand curve grows larger and larger over time.
Figure 3.4 Have Your Cake and Eat It, Too!
Total Expenditure Drops from $16 to $12, but Quantity Supplied Rises by 50 Percent.
It is this cumulative gap that is shown in the graph over the hypothetical period of 15 years. Now note that the total expenditure on health care (to be interpreted as a share of GDP) decreases by 25 percent. This is proved by the fact that the area defined by the price/quantity rectangle associated with the new equilibrium is smaller than the area of the initial rectangle. More specifically, the area $4 × 4 = $16 defined by the first market equilibrium drops to $2 × 6 = $12 in the new equilibrium, a 25 percent reduction. Note that this is true even though demand has increased, and even though the quantity of services delivered has increased significantly, as desired, rising 50 percent from four to six units as seen on the horizontal axis. On the other hand, the price per unit of aggregate service has decreased from P to P* on the vertical axis.
In short, a much-increased quantity of services gets delivered, unit costs to patients and their insurers are lowered, and the total expenditure to the nation decreases. The “proof” here is purely geometric, and only applies to the example appearing in our graphs. But the underlying logic is fully general, as is shown in proof in Appendix B.
In cases (not shown here) where the slopes of the supply and demand curves are different from those shown in the figures, or where the curves are nonlinear, or where the initial coordinate values are different, total expenditure may initially rise. But a point is always reached where the cumulative supply/demand curve gap is big enough to ensure that total expenditure always falls thereafter. In the special case where the supply and demand curves are linear, total expenditure is a downward-open parabola with a unique maximum expenditure peak.
Proof of Proposition 3: We now see how ObamaCare fails to satisfy our Basic Assumptions. Figure 3.5 geometrically represents what could well happen under ObamaCare in the worst case. Note first that the supply curve is shifting backwards. This reflects (1) the adverse implications of statutory reimbursement-rate policies discussed previously, (2) the looming shortages of physicians, discussed previously, and (3) other manifestations of the supply/demand imbalance resulting from ObamaCare discussed previously. Conversely, the demand curve shifts out to the right as in the previous figure, reflecting (1) ever more elderly people, and (2) expanded insurance coverage provided by the new Act.
Figure 3.5 Fate of Health-Care Spending under ObamaCare: Worst Case
We have made the magnitude of these two shifts equal and offsetting, partly for illustrative purposes, and partly to reveal the true risks of ObamaCare. Please study the result carefully. First, the unit price of services increases sharply from P to P* as can be seen on the vertical axis. Second, the quantity of services Q offered at equilibrium does not change at all. Tens of millions of people will receive no care. And third, the total expenditure on health care explodes, as is seen by comparing the total areas of the two rectangles defined by the before-and-after equilibrium points E and E*.
Note that the area of the “after” rectangle is nearly twice that of the former, even though not one new unit of output is generated on the quantity axis! In short, ObamaCare in this worst-case model will only satisfy the first of our three Basic Assumptions: There is greater “access” in the sense that the demand curve has shifted outward. But it satisfies neither of the other two assumptions, namely increased quantity and reduced total expenditure. The result is health-care rationing, and possible national bankruptcy as total expenditure explodes.
An Analogy from Agricultural Reform
Figure 3.5 makes clear the true cost of ignoring supply: a systemic disaster. Catastrophic outcomes of just this kind have been witnessed many times before. One example that sticks in my own mind was that of agricultural reform in Tanzania in the 1960s under Prime Minister Julius Nyere, a good and farsighted liberal who simply did not understand economics. To placate consumers in the cities, particularly the then–capital city of Dar-es-Salaam, Nyere mandated price reductions (and other controls) for crops. He did so, claiming that greedy farmers were being unfairly rewarded by high prices, and that consumers would benefit from lower prices.
The result, of course, was exactly what Figure 3.5 shows: Farmers pulled out of agriculture (the supply curve shifted backward). There was a shortage of food and rationing since prices were not allowed to soar to their true new supply/demand level. Living standards declined, and all this happened in the name of “helping the poor and punishing rich farmers.” I happened to visit Tanzania in 1968 on a gap year from college, and having just studied microeconomics, I learned firsthand how not to better the lives of “the people” by price controls.
To be sure, ObamaCare may not generate an actual backward shift in the supply function, so that the outcome need not be as alarming as in the figure. However, given our earlier discussion about disturbing supply-side deficiencies that existed even before ObamaCare, and given the increasing alarm over supply by experts throughout the country, then the supply curve could in fact shift backward. More probably it will shift outward, but much more gradually than the demand curve will. If so, then as Proposition 2 implies, the long-run result will be bankruptcy or else rationing and black marketeering.
One anecdote is interesting in this context. Shortly before Christmas 2010, I was in New York City and visited four different doctors, an annual Christmas ritual for me. Three of the four offices had posted signs that Medicare patients were not accepted, signs I had not noticed in past years. Signs for the poor to stay away? Signs portending rationing? Signs of the future?
Can the Supply Curve Shift Way Out? If So, How?
In this final section on health care, I wish to integrate the real-world critique of the current health-care system presented at the start of this chapter with the more abstract analysis of our three Propositions and Proofs. The goal is to identify some broad-gauged policies for achieving a better health-care system. In this regard, the fundamental question for policy makers is: Can concrete policy reforms drive the nation’s supply curve out faster than the demand curve? And if so, how? My answer to this question may well surprise you, but it is based upon both economic theory and an impressive amount of supporting data: Not only can policy reforms do so, but the American public has the right to demand that they do so, given the all-important stakes involved in health care. After all, if supply has trumped demand for markets in TVs, computers, telephones, food, clothing, and most other goods and services, then why should it not do so in health care where the stakes are overwhelming?
In order to make the case that the supply curve of medical services can shift outwards much faster than it has, let’s review exactly what causes supply curves to shift outward in the first place.
What Exactly Shifts a Supply Curve Outward?
There are three basic ways in which the supply curve for a given good or service can be shifted outward. First, this can be achieved by expanding the existing stock of workers and capital (machines) producing the good. This creates a bigger “factory,” and the level of output at any given price will increase—the very definition of an outward shift in the supply curve.
Second, an increase in productivity will shift the curve outward. This occurs when, due to technological progress, existing workers learn how to work “smarter” and as a result can produce more output per hour at any given price than before. The supply curve again shifts outward even though, this time, there are no new workers or factories. For examples of the power of productivity growth, just think of how the invention of double-entry bookkeeping and of the limited liability corporation caused an explosion in the formation of businesses, how the original Green Revolution dramatically increased crop output and defeated Malthusian predictions of mass starvation, how the invention of the microchip revolutionized the speed and capacity of the computer in accord with Moore’s Law, and how the invention of the steam engine, electricity, and nuclear power gave the modern world the energy required for history’s three industrial revolutions to occur. I recently came across a fascinating statistic: Energy expended by human beings amounted to about 95 percent of total energy expended in economic activity three centuries ago. This share has now fallen to about 5 percent.
Third, the more deregulated and competitive a market becomes, then the more rapidly the supply curve shifts outward. Nothing impedes the growth of productivity more than anti-competitive cartels, as Adam Smith recognized as early as 1776. To restate this point in modern economic terms, true economic efficiency (“the biggest pie possible given the resources available”) requires perfect competition, that is, a competitive structure free of cartels, oligopolies, monopolies, and so forth. The more competitive a sector is, the greater its productivity growth will be, and thus the more rapidly its supply curve will shift out over time.
Supply Curves and Rising Living Standards
In a very fundamental sense, the concept of economic progress (equivalently rising living standards) implies that households spend a smaller share of their income on “old” goods every year so that they can afford either “new” goods (an iPod, or a trip overseas), or else at least as many old goods of superior quality.14 But this can only occur if supply curves shift out faster than demand curves, as we saw in the discussion of Proposition 1.15 In this regard, Proposition 1 was as much about the requirement for economic progress in general as it was about the control of total expenditures on health care.
This is a very important point. Simply consider the course of economic progress during the twentieth century. The share of our incomes we spend on most any product of comparable quality declined dramatically. Of course, we may spend more as a share of our income on certain goods if they are higher quality. But when quality improves, you are really introducing a new good.
But then there is health care! The share of all of our incomes spent on health care (for a constant level of health) rises endlessly because of rising prices for services, ever-rising insurance copayments, and ever-rising insurance premiums—at least for those of us “lucky” enough to have ever-worse insurance! The expenditure impact is even worse when doctors refuse to accept the insurance we have already paid for, as keeps happening to me. Indeed, to have my throat looked at cost me $5 when I was five years old, versus $350 in the same Upper East Side building in New York last Christmas. I was not paying more for an increase in quality of service delivered. Moreover, I had to write a check on the spot for my treatment. Nondeductible, of course.
Sound familiar? In this case the supply curve had not shifted outwards at all over many decades. This price inflation was partly due to a lack in productivity growth in the scheduling and delivery of the services rendered. Nothing had changed, including my treatment. It was like a time warp. Now this is not an indictment of the entire health-care industry. After all, myriad forms of technological progress have improved the diagnosis and treatment of many, many illnesses over the last several decades. It is simply an indictment of the way in which an individual consumer visiting a doctor for a routine illness pays much more than he used to, spends as much time as before, and receives care that is not notably better in many cases. Where was that medical care ATM that would have made going to the doctor as easy as cashing a check had become?
Where Health Care Went Wrong
What exactly has prevented a suitable outward shift in the health-care supply curve? Was cartelization and lack of competition a cause? Absolutely. Was lack of productivity growth due to cartelization and other developments a cause? Absolutely. Was a lack of sufficient expansion in the quantity of factor inputs (more medical school graduates) a cause? Absolutely. Can such constraints be relaxed, resulting in the required large outward shift in the supply curve that is needed? Absolutely, and it is high time that this be recognized as a national priority, and that it occur. A portion of the infrastructure investment Marshall Plan proposed in Chapter 2 should be dedicated to increasing productivity in health care.
In concluding this discussion of health-care reform, let me sketch a rough blueprint of what must be achieved in practice so that our three Basic Assumptions can be fulfilled. I shall sketch a sample of reforms needed not only on the supply side but also on the demand side of this bedeviling market. My main goal is to demonstrate how specific policy proposals can and should be factored into their supply and demand curve implications. Only if this is done—and it never has been done to the best of my knowledge—will we be able to arrive at an entire collection of policies that, when aggregated, satisfy the fundamental policy requirement: The aggregate supply curve must shift outward faster than the aggregate demand curve. And only if this requirement is satisfied can we be spared national insolvency due to runaway health-care spending, as Propositions 1 and 2 make clear.
As I am not a health-care expert, please view the following proposals as a sample of what true experts might propose. What matters is the logic involved, and this is what I will emphasize. I start off with demand-side reforms. In this case, the more that new policies slow down the outward shift of the demand curve for legitimate reasons—or even reverse it—the better.
Some Valid Demand-Side Reforms
First, suppose tort reform would cause doctors to order fewer reduplicative tests and thus reduce today’s artificially inflated demand for tests and services. Such a reform would shift back the demand curve for legitimate reasons, and accordingly should be enacted.
Second, suppose that traditional fee-for-service physician payment schemes could be replaced by more holistic schemes that would incentivize physicians to see a given patient less often, for comparable care. Then this reform should be embraced since it shifts the demand curve backward, again for legitimate reasons.
Third, suppose that “first dollar insurance coverage” encourages an excess demand for medical services. Then such coverage should be eliminated so as to shift back the demand curve. Consumers would allocate their dollars much more carefully if they have to pay up front for their treatment, until of course a reasonable cap is reached where insurance kicks in. The cap could depend upon a persons’ income, with higher caps for richer people.
Fourth, suppose that penalizing patients with demonstrably bad lifestyles would cause them to adopt better lifestyles and have fewer health problems due to smoking, lack of exercise, obesity, alcohol, drugs, and so forth. Then penalties should be imposed on such patients to shift the demand curve backward.
Fifth, suppose that a growing number of allegedly medical “needs” are not really needs, but mere desires as in the case of much plastic surgery, and of certain life-extension procedures. Then patients should pay the freight for such services. The penalties imposed would shift the demand curve backward for valid reasons.
Many other demand-reduction policies exist, and several of these were cited in the discussion that appeared earlier in the chapter.
Some Valid Supply-Side Reforms
I have already touched upon such supply-side reforms earlier. Let’s review some specific examples.
First, let us agree that the number of health-care professionals who graduate from medical schools has been artificially constrained during past decades. It is often alleged that the AMA and other groups represent de facto cartels whose interests favor a restricted supply of professionals. Then the interest groups involved should be encouraged to increase supply. With the large number of physicians approaching retirement age, resistance to increased supply might be much less than expected. If physicians and their lobbies do not play ball, they should aggressively be fought, as well as circumvented by new arrangements to the extent possible. If it proved possible for government successfully to take on the American Tobacco Trust, the Standard Oil Trust, AT&T, and any number of labor unions, why should it be held hostage to self-serving medical cartels when national solvency is at stake?
The government has plenty of leverage in this regard. Consider the restrictions upon medical school enrollments. Everyone knows how difficult it is for able undergraduates to get into medical schools. Several publications have recently run articles on the number of Americans students forced to obtain training in the Bahamas. The government should order all qualifying U.S. medical schools significantly to increase their class sizes or else face a cutoff of all federal grants to their host universities. I suspect expansion would occur lickety-split.
Second, recall that the new health care Act has provisions that attempt to achieve “cost reductions” of the wrong kind and in the wrong way. Lowering reimbursement rates to Medicare professionals is a notable example and was discussed earlier. All such provisions should be scrapped. Telling professionals that “we will pay you less” is a sure way to shift the supply curve backwards, just as Julius Nyere learned from his misguided agricultural reforms. Once again, the proper way to control costs is via a reduction in total expenditure which in turn is achieved by reining in demand and optimally increasing supply as in Figures 3.3, 3.4, and 3.5. A failure to understand this is why most discussions of “bending the cost curve” are either misleading or wrong. They fail to capture the feedback effects between supply and demand so crucial for forecasting total expenditure.
Third, suppose that tort reform will encourage more doctors to enter a given medical field, and will also deter more doctors from exiting it due to fewer malpractice lawsuits and to reduced insurance premiums. As a result, tort reform shifts the supply curve outward and should thus be implemented. Additionally, to the extent that tort reform reduces doctors’ incentives to order redundant and unnecessary tests, the demand curve for such tests and services shifts backwards. This is an example of a policy that is ideal in that it shifts the supply curve outward and the demand curve backward.
Fourth, suppose that productivity growth in health care has been suppressed—either deliberately or unwittingly. A deliberate suppression would occur should the medical profession fight efforts to automate record retrieval, and other services. Or else it might oppose an augmented role for nurse practitioners, just as many lawyers fought the advent of paralegals several decades ago. An unwitting form of productivity growth suppression would stem from the cozy atmosphere fostered by groups shielded from competition, for whatever reasons.
For example, it is well known that state-owned companies have much lower productivity growth than their private sector counterparts. By analogy, consider the poor productivity of teachers belonging to public school teachers unions versus their private school counterparts. After all, necessity is the mother of invention, and there is not much necessity to innovate within cozy, protected environments. The policy implication here is that any suppression of productivity growth should be targeted and dislodged on a sector-by-sector basis throughout the health-care profession.
Fifth, suppose that the medical profession opposes the substitution of capital for labor as job-threatening, as in the prospective development of expert-system-based automated medical care. Then both government and citizens’ groups alike must vigilantly oppose such Luddism, and automated care should be vigorously pursued. But once again, given the looming shortage of physicians, resistance here may prove less than expected.
To the best of my understanding, the greatest promise for a dramatic outward shift in the health-care supply curve lies in precisely this area of “intelligent automation.” But this is a sleeper topic that few health-care professionals seem to discuss, much less champion. It is also an area in which there is widespread misunderstanding of the opportunities at hand. Because I have some personal experience in the construction of expert systems, let me briefly digress on this particular source of greater productivity.
In researching this book, I was struck by how people in the medical profession seem oblivious to—or even hostile to—the promising new technologies of expert systems. These are not simply systems that replicate low level jobs, for example, automated operators who replace telephone operators and ask you for the name and address of the person you are calling. Rather they are platforms in which the expertise of true professionals (e.g., the best doctors in any field) is encoded and then utilized in an interactive manner. The result is that an automated expert is “there” to diagnose you 24/7, to have a discussion with you, to ask you highly sophisticated questions, to consult with other professionals, to test you, and then to tell you exactly what to do next.
As the author of reputedly the first expert system in the field of finance 25 years ago, Interest Rate Insight, I learned first hand about the extraordinary potential of this field.16 I first interviewed the late James Tobin at Yale University to ascertain the most problematic misunderstandings and biases of people who forecast the economy and interest rates. I interviewed many others as well including Benjamin Friedman at Harvard, and Vance Roley at the University of Washington, both distinguished macroeconomists. Their “wisdom” ended up encoded in a simple-to-use interactive system that helped many people make sense of interest rates back when they were very high, volatile, and important. A user would specify his 9 assumptions about the future of the economy, in hopes of learning from the system what would happen to interest rates. An automated “expert” would then identify any logical inconsistencies in his assumptions, and explain why they mattered. The user would then reformulate his scenarios, and arrive at an improved forecast of interest rates. All this was done back in 1987 when computers lacked computing power, and when expert system technology was in its infancy.
Given today’s vastly improved technology, there is no reason why I should not be able to consult an expert medical system of the following kind. Whenever I have a routine medical problem, I should be able to go to any CVS pharmacy open 24/7, enter a small fully automated booth, call up my fully automated medical record with my Social Security number, have my pulse, my blood pressure, and my blood tested, and finally have an interactive discussion with a group of eminent doctors whose expertise has been suitably encoded. A prescription for what ails me will be printed out and given to me, assuming my ailment is routine. If tests show that it is not routine, and my automated doctor will know this, then he will instruct me where to go for further analysis. Indeed, the names and addresses of the right doctors for this specific purpose will be printed out for me on the spot. To do this, my expert only needs my zip code.
The total cost will be $15, not the $350 I recently paid for exactly this treatment with a real-life doctor who was not as good an expert as the expert system could be. This fee should be split between participating pharmacies, the technologists who created the system, and the doctors whose wisdom was encoded. The doctors receive an ongoing royalty. The most important point here is that over 90 percent of all visits to doctors are routine in nature, and therefore “replicable” in expert-system lingo. Furthermore, payments for visits to doctors constitute a very significant share of total health-care expenditures, as was noted earlier.
The government should create a task force and fund a program to develop such systems at many qualifying universities. This program should be spearheaded by computer experts from MIT, and by doctors at Harvard Medical School and Johns Hopkins. Students should compete with one another to create a large number of such systems utilizing the best medical intelligence available. They should be motivated by large cash prizes for developing “winning” platforms. Venture capitalists should then be approached to transform these fledgling enterprises into large, scalable, well-capitalized businesses. Such a program has been needed for decades, but it is now possible. My belief is that automation of this kind will eventually play the most important role of all in shifting the supply curve way out. Why must we wait any longer?
Importance of Health-Care Reform—A Postscript
Were the market whose irrationalities I have analyzed the market for white truffles, no one need care. But the market at hand is the U.S. health-care system, the largest sector of the largest economy in the world. Just as I called for a new Marshall Plan to rekindle growth and redress the U.S. infrastructure deficit in Chapter 2, I am now calling for an analogous plan to remedy the supply/demand imbalance of the entire U.S. medical system. In achieving this end, ObamaCare is not as much of a problem as many critics claim. After all, it contains some very good provisions, especially on the demand side. And since it focused almost exclusively on demand, it can be extended to include supply in a natural manner. Fortunately, the supply and demand sides of this market are largely “separable,” and this should facilitate reform. Thus we do not need to repeal the new health-care Act, but rather to extend and amend it.
Redressing the Social Security Deficit
By comparison with health-care spending, Social Security is a modest problem both in cost and in complexity. The critical difference is that, in contrast to health care, no product is being produced and consumed. The product is simply a national annuity of sorts whereby workers pay into a social insurance fund during their working years, and then secure an annuity when they retire. The three issues that make Social Security a problem are (1) the front-loaded structure favoring those that retired earliest, (2) the demographic bulge of the baby boomers causing a declining “dependency ratio” (number of workers per retiree), and (3) an increase in biological longevity. In and of themselves, these problems pose no great difficulty. In principle, all that is needed is to postpone the retirement age, reduce the indexation of or even the level of benefits, and slightly raise taxes on workers. The problem lies in the politics surrounding which mix of these “fixes” is best. So touchy are sentiments surrounding Social Security that the subject has been deemed “the third rail of U.S. politics.” Touch it and you are dead.
Whereas I had a lot to say about health-care reform that was unorthodox, if commonsensical, this is not the case with Social Security. In concluding this chapter on entitlements, I only want to identify some solutions that already exist and are well known in the field. Before I summarize these potential solutions, however, a caveat is in order. The analysis that follows is quite conventional in that it retains Social Security in its current form, namely as a non–market-based public pension whose benefits are paid by the federal government. There are those who believe that the entire program should be privatized in one way or another, and proposals to do so have proliferated in recent years. President George W. Bush included partial privatization on his policy wish list.
My own view is that the system should not be privatized. To begin with, the usual reasons given for privatization are flawed because free market solutions will fail to achieve the optimal amount of risk-spreading required by economic theory. Additionally, the prevailing politics will make privatization impossible. Finally, the volatile stock markets of the past 15 years along with the inability of most people “to take responsibility for their old age” militate against a private sector approach. Just note the small fraction of those who could have fully funded their IRAs that actually did so.
The Problem
Social Security is a social insurance program officially called Old-Age, Survivors, and Disability Insurance (OASDI), in reference to its three component parts. Starting in 2015, program expenses will continuously exceed cash revenues. Four reasons account for this. First, baby boomers are aging, resulting in a lower ratio of workers contributing to the pot to retirees. The number of workers paying into the fund was 5.1 per retiree in 1960, 3.3 in 2007, and is projected to fall to 2.1 by 2035. Second, the birth rate will continue to be low, at least compared to that of the baby-boom period. Third, life expectancy will continue to rise. And fourth, the government has borrowed and spent the accumulated surplus funds known as the Social Security Trust Fund, while counting the funds as revenue, rather than as debt, as it should have.
Until 2037, the government has the legal authority to draw on general government funds above and beyond the Social Security payroll tax revenues. Thereafter, however, the government must rely solely upon the pay-as-you-go payroll tax revenues. The problem is that payroll taxes will cover only 78 percent of the scheduled payouts after 2037. This declines to 75 percent by 2084. Unless current law is changed permitting government to draw upon nonpayroll sources of revenue, benefits would have to be severely cut or else payroll tax rates would have to rise sharply.
One way of quantifying how much of a challenge this is to the nation is to discount all unfunded annual shortfalls to a current present value. The most common estimate of this “unfunded liability” is $5.4 trillion as of August 2010 data. This is the amount of money that would have to be salted away today such that its interest and principal would cover the annual shortfalls in future years. If current assumptions about future longevity, interest rates, and growth rates prove too optimistic, the unfunded liability could easily reach $15 trillion. Note, however, that this is only a fraction of the size of the unfunded Medicare/Medicaid liability, which is estimated to lie between $25 and $40 trillion.
Another way of quantifying all this is to note that, looking forward 70 years, the average annual shortfall is 1.92 percent of the payroll tax base, or 1.0 percent of forecast GDP. Additionally, the annual cost of Social Security benefits represents about 5 percent of GDP at present. This is projected to increase to 6.1 percent by 2035, and then decline to about 5.9 percent by 2050 and then to remain at that level. Once again, while this deficit is large, it is not daunting and there are many ways to eliminate it. Before turning to a summary of some proposed solutions, let me cite a useful caustic comment by Professor Paul Krugman of Princeton University that accurately puts the Social Security shortfall into broader perspective:
The Congressional Budget Office report finds that extending the life of the trust fund into the 22nd century with no change in benefits would require additional revenues equal to only 0.54 percent of GDP. That is less than 3 percent of federal spending—less than we’re currently spending in Iraq. And it’s only about one-quarter of the revenues lost each year because of President Bush’s tax cuts. Given these numbers, it’s not at all hard to come up with fiscal packages that would secure the retirement program, with no major changes, for generations to come.17
Despite his admittedly liberal bias, Krugman on this occasion is right that remedies requiring small changes are at hand. Let’s investigate some of these.
Proposed Solutions
Before detailing some solutions that have been proposed, it is important to reiterate a point Federal Reserve Bank Chairman Bernanke has stressed: Reform is much less painful now, up front, than it will be later on. For example, raising the payroll tax rate to 14.4 percent from the current rate of 12.4 percent during 2009, or else cutting benefits by 13.3 percent during 2009 would have largely resolved the system’s problems indefinitely. But if no changes in tax rates or benefits are made until 2035, these amounts must increase to 16 percent and 24 percent respectively.
We conclude with a brief summary of several solutions that have been proposed for shoring up Social Security.
1. The Congressional Budget Office Study of July 2010: This reported the effects of a series of policy options designed to eliminate the “actuarial balance” shortfall, which over the 75 year horizon is 0.6 percent of U.S. GDP. On today’s GDP of $14.5 trillion, this amounts to about $90 billion per year. The amount would grow in proportion to GDP growth. One policy option that eliminates the 0.6 percent shortfall would be to raise the payroll tax rate from 12.4 percent to 14.4 percent over the next 20 years. An alternative solution was recently proposed by Stanford University Professor Michael Boskin. He recommends adopting a new and more conservative inflation index to be used in “indexing” benefit payments over time.
2. The AARP Study of February 2010: The American Association of Retired Persons (AARP) has identified six ways of increasing Social Security revenue, and three ways to reduce costs. To raise revenues: (1) raise the cap on taxable earnings to 90 percent—this would reduce the predicted shortfall by 39 percent; (2) increase the payroll tax rate—each 0.5 percent tax hike eliminates 23 percent of the shortfall; (3) raise taxes on benefits paid—this could reduce the shortfall by 10 percent; (4) preserve the estate tax on estates over $3.5 million—this should reduce the shortfall by 27 percent; (5) extend program coverage to newly hired state and local government employees—this would generate a 10 percent shortfall reduction; and (6) invest 15 percent of the Trust Funds into stock and bond index funds—this results in a 10 percent reduction.
On the cost side, the AARP proposes (1) adjusting the cost-of-living-adjustment (COLA) provision so as to reduce outlays by 18 percent of the shortfall; (2) increasing the normal retirement age to 70 so as to reduce the shortfall by 36 percent; and (3) adopting progressive indexing of benefits to prices, not wages, resulting in a further decrease in the shortfall. This last measure is similar to the Boskin proposal. Clearly, a mix of some or all of these nine proposed changes in the system would render Social Security solvent for the long run, assuming that the actuarial and economic assumptions made come true.
3. The 2010 Urban Institute Study: This study recommends the five options of (1) reducing the COLA by one percentage point thereby reducing the shortfall by 75 percent; (2) increasing the full retirement age to 68 thereby reducing the shortfall by 30 percent; (3) indexing the COLA to prices rather than wages, except for the bottom third of workers, thereby reducing the shortfall by 65 percent; (4) raising the payroll income tax cap (currently at $106,800) to cover 90 percent instead of 84 percent of earnings thereby reducing the shortfall by 35 percent; and (5) raising the payroll tax rate by one percentage point thereby reducing the shortfall by 50 percent.
These findings reinforce the understanding that the Social Security funding crisis can be resolved by a combination of relatively painless policy changes aimed at reducing benefits and raising revenues. All that is missing to implement these is leadership.
This concludes our overview of the entitlements crisis. Health-care spending is by far the most serious issue in this debate. I have tried to demonstrate that we can achieve the goals both of expanded coverage and reduced total expenditure (as a share of GDP) provided that an all-out attack is made on the supply-curve of the market. In this context, we have seen that more conventional remedies like “bending the cost curve” and outright “cost control” either have no meaning, or else do not amount to solutions at all.
What matters is total expenditure control, and this is best achieved by shifting out the supply function more rapidly than the demand function. During all the debates about health care over the past five years, I have never once seen this point raised. To be sure, there are those who preach the need for more supply given the looming shortage of physicians that we confront. But it is not enough to propose increasing supply. It is the supply curve that must be the object of discussion. This is not simply an opinion, but rather a deduction from elementary economic principles, as I stressed earlier.
In the case of Social Security, the problem is both lesser in size and much easier to fix. There are several sets of reforms, any one of which would make the program solvent throughout the current century. But one thing is for sure: We are living longer, and we are all going to have to work longer too.
Finally, in keeping with the spirit of this book, I hope most readers will agree that there is nothing Right wing or Left wing in the health care and pension policies that I have proposed. Rather, it is glorified Common Sense 101 and is thus consistent with the fundamental thesis of this book.