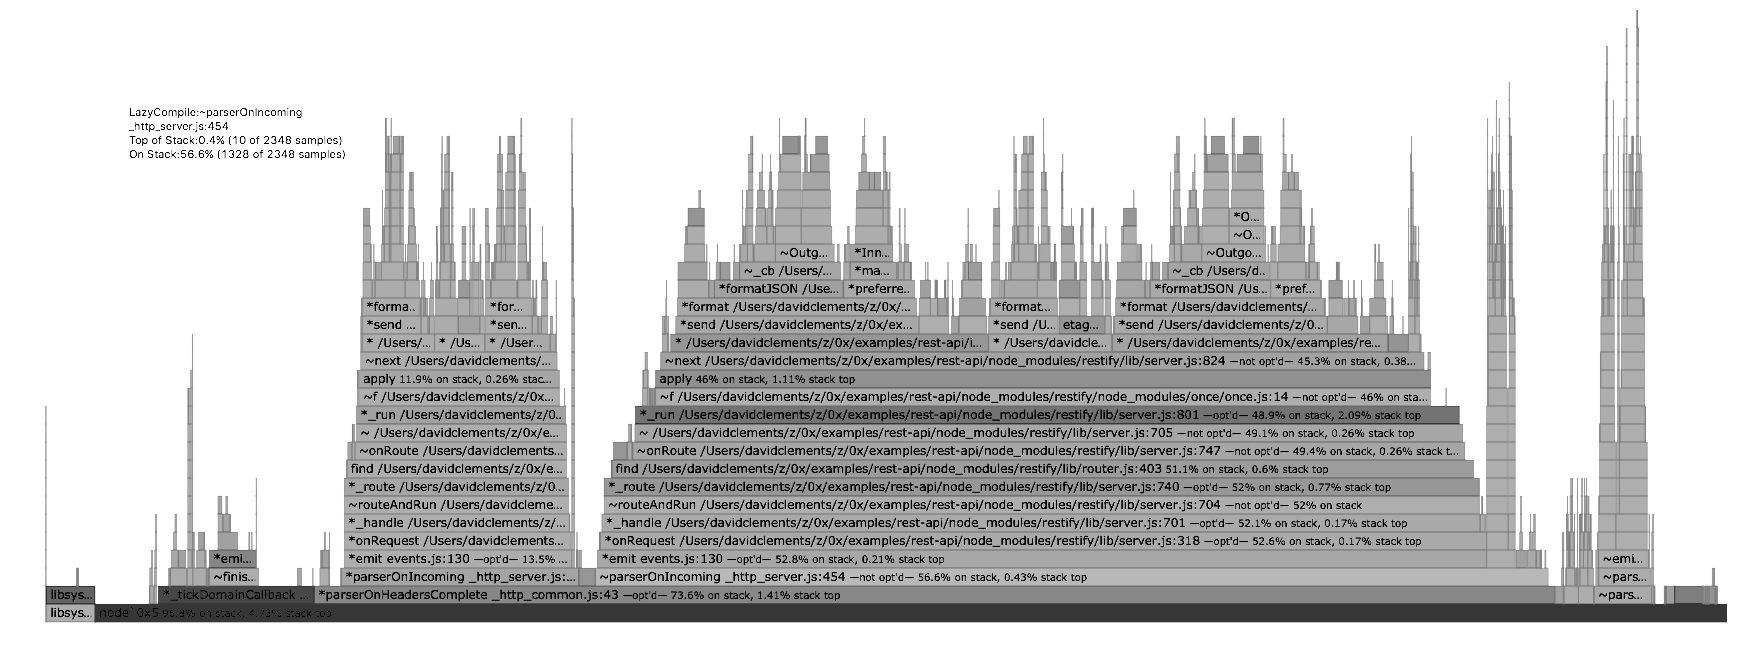
A flamegraph is an extremely powerful visual tool. It helps us to identify hot code paths in our application, and solve performance issues around those hot paths. Take a look at the following screenshot:
Flamegraphs compile stacks capturing during CPU profiling into a graphical representation thats abstracts away the concept of time allowing us to analyze how our application works at a holistic level.
To put it another way, flamegraphs allow us to quickly determine how long each function (from C to JavaScript) has spent on the CPU, and which functions are causing the rest of the stack to be on CPU longer than it should be.
We're going to load-test a single route of an Express server, and use the https://github.com/davidmarkclements/0x flamegraphing tool to capture stacks and convert them into a flamegraph.
This recipe explores the second and third steps of the optimization workflow: Generate a flamegraph and identify the bottleneck.