Chapter 8
Frequency Analysis
In this chapter, you will learn the following:
• Introduction to Frequency Analysis
• Frequency Analysis of a Wine Glass
• Frequency Analysis of a Pulley Assembly
• Frequency Analysis of a Cantilever Beam
In this chapter, you will learn about frequency analysis, which is used to calculate the natural frequencies of an object. The natural frequencies also known as resonant frequencies. The natural or resonant frequency of an object is defined as the energy required to produce vibration in the object. Every object has different natural frequencies depending on its geometry, material properties, and boundary conditions. A real-world object has an infinite number of natural frequencies in which it vibrates. However, in the finite element analysis, the natural frequencies of an object are considered equal to the number of its degrees of freedom. Each natural frequency of an object is associated with a shape called mode shape, which occurs when the object vibrates at that frequency. When an object vibrates due to an external force with a frequency which matches with one of its natural frequencies, the object undergoes large displacements and stresses, which causes failure of the object. This phenomena of failure is known as resonance. For example, a structure like bridge vibrates due to a frequency that is generated due to many reasons like traffic, high wind speed, or a high footfall. When this frequency matches with one of its natural frequencies of the vibrations then the bridge can fall down.
Introduction to Frequency Analysis
The frequency analysis is used to calculate the natural frequencies of an object and their associated mode shapes. By knowing the natural frequencies of an object, you can ensure that the actual operating frequency of an object will not coincide with any of its natural frequencies to avoid the failure of the object due the resonance.
Case Study 1: Frequency Analysis of a Wine Glass
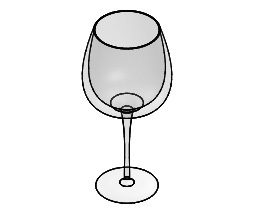
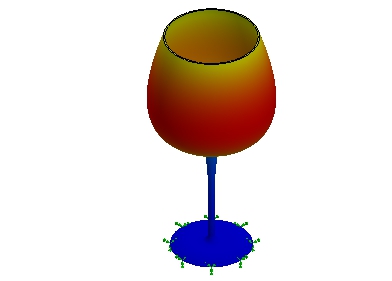
In this case study, you will perform the frequency analysis of a Wine Glass, see Figure 8.1 and determine its first three natural/resonant frequencies and their associated mode shapes. Also, determine the mass participation in the X, Y, and Z directions.
Figure 8.1
Project Description
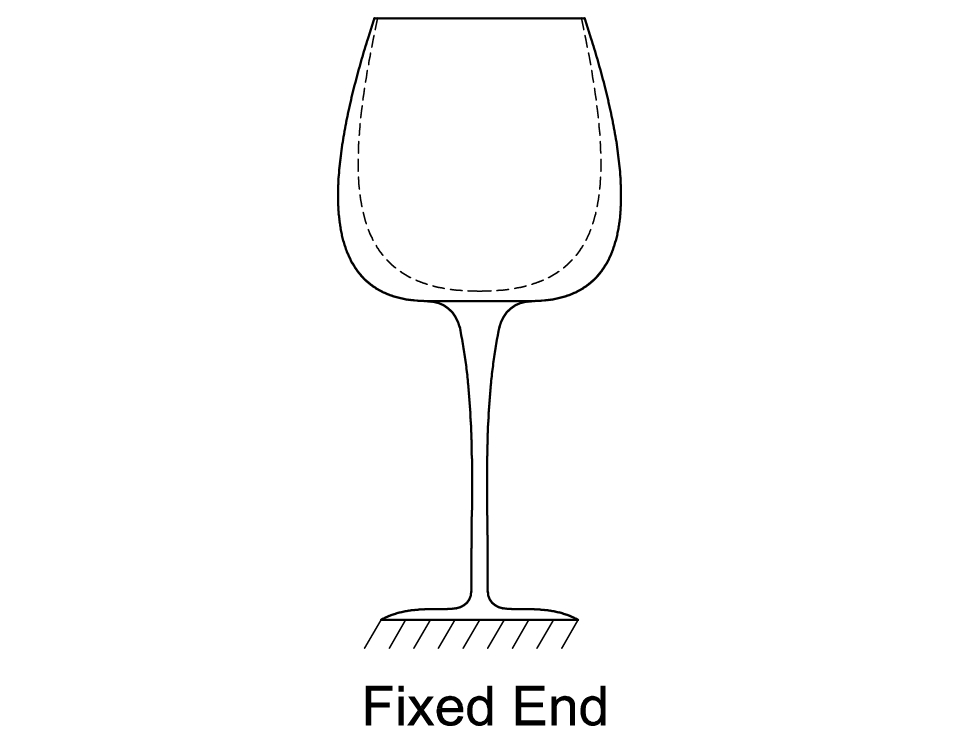
Fix the Wine Glass at its bottom to represent its operation conditions, see Figure 8.2. The Wine Glass is made up of
Glass
material.
Figure 8.2
Project Summary
In this case study, you will run the frequency analysis on a Wine Glass without applying any external force.
NOTE:
You can run the frequency analysis with or without applying the fixtures and loads. However, it is recommended to apply the required fixtures to the model to represent its real operating conditions. Although, applying external loads to the model is optional but, if you do so, their effects are considered in the frequency analysis.
Learning Objectives
In this case study, you will learn the following:
1. Downloading Files of Chapter 8
2. Opening the Wine Glass
3. Starting the Frequency Analysis
4. Defining Properties for the Frequency Analysis
5. Applying the Material and Fixture
6. Generating the Mesh
7. Running the Frequency Analysis
8. Displaying Natural/Resonant Frequencies
9. Viewing Different Mode Shapes
10. Displaying the Mass Participation
11. Saving Results
Section 1: Downloading Files of Chapter 8
1. Login to the
CADArtifex
website
(www.cadartifex.com)
with your user name and password.
2. After login to the CADArtifex website, click on
SOLIDWORKS Simulation > SOLIDWORKS Simulation 2018
. All resource files of this textbook appear in the respective drop-down lists.
3. Click on
Case Studies > C08 Case Studies
. The downloading of
Co8 Case Studies
file gets started. Once the downloading completed, you need to unzip the downloaded file.
4. Save the unzipped
C08 Case Studies
file in the
Case Studies
folder inside the
SOLIDWORKS Simulation
folder.
Section 2: Opening the Wine Glass
1. Start SOLIDWORKS, if not already started.
2. Click on the
Open
button in the
Welcome
dialog box or the
Open
tool in the
Standard
toolbar. The
Open
dialog box appears.
3. Browse to the location
> SOLIDWORKS Simulation > Case Studies > C08 Case Studies > Case Study 1
of the local drive of your system. Next, select the
Wine Glass
and then click on the
Open
button in the dialog box. The Wine Glass is opened in SOLIDWORKS.
Section 3: Starting the Frequency Analysis
1. Click on the
Simulation
tab in the
Simulation
CommandManager
. The tools of the
Simulation
CommandManager
appear.
2. Click on the
New
Study
tool in the
Simulation
CommandManager
. The
Study
PropertyManager
appears at the left of the graphics area.
3. Click on the
Frequency
button in the
General
Simulation
rollout of the PropertyManager to perform the frequency analysis, see Figure 8.3.
4. Enter
Wine Glass Frequency Study
in the
Study
name
field of the
Name
rollout in the PropertyManager, see Figure 8.3.
5. Click on the green tick-mark button in the PropertyManager. The
Wine Glass Frequency Study
is
added in the
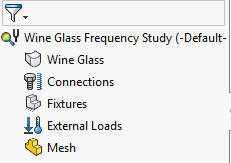
Simulation Study Tree, see Figure 8.4.
Figure 8.4
Section 4: Defining Properties for the Frequency Analysis
Before you start performing the frequency analysis, you need to define its properties.
1. Right-click on the
Wine Glass Frequency Study
(
name of the study
)
in the Simulation Study Tree and then click on the
Properties
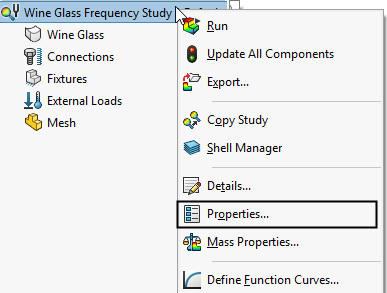
tool in the shortcut menu appeared, see Figure 8.5. The
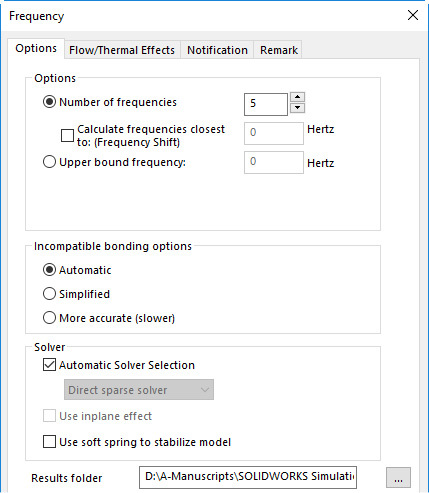
Frequency
dialog box appears, see Figure 8.6.
Figure 8.5
Figure 8.6
2. Enter
3
in the
Number of frequencies
field of the
Options
area in the dialog box to calculate first three natural frequencies of the Wine Glass.
Tip:
You can also calculate the frequencies closest to the frequency of your interest. For doing so, you need to select the
Calculate frequencies closest to: (Frequency Shift)
check box in the
Options
area of the dialog box and then enter the frequency value of your interest. The
Upper bound frequency
radio button is used to specify an upper limit for the frequencies to be calculated. On doing so, the program calculates the frequencies which are below the specified limit.
3. Click on the
OK
button in the dialog box. The first three number of frequencies to be calculated are defined.
Section 5: Applying the Material and Fixture
Now, you need to apply the material and fixture to the model.
1. Invoke the
Material
dialog box by clicking on the
Apply
Material
tool in the
Simulation
CommandManager
.
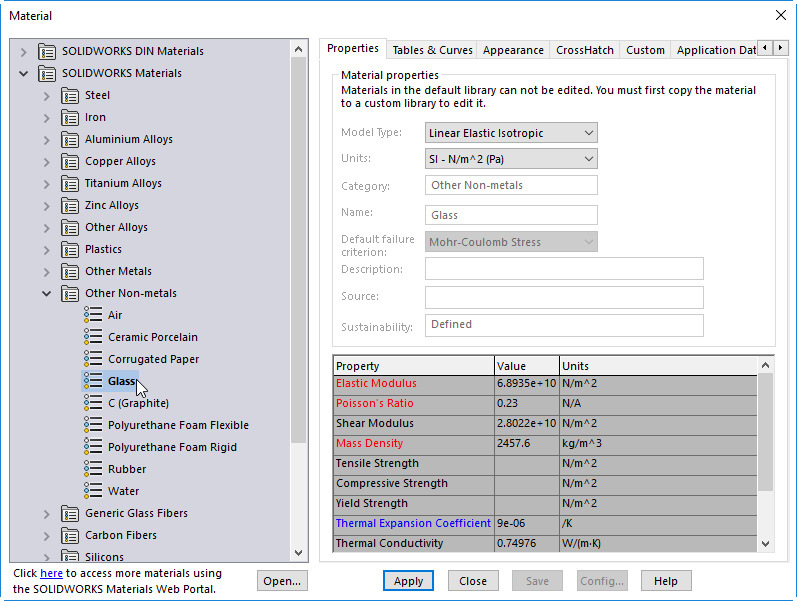
2. Expand the
Other Non-metals
category of the
SOLIDWORKS Materials
library in the
Material
dialog box and then click on the
Glass
material, see Figure 8.7. All the properties of the Glass material appears on the right panel of the dialog box, see Figure 8.7.
Figure 8.7
3. Click on the
Apply
button and then click on the
Close
button in the
Material
dialog box. The Glass material is applied to the model and its appearance changes, accordingly in the graphics area.
Now, you need to apply the Fixed Geometry fixture.
4. Right-click on the
Fixtures
option in the Simulation Study Tree and then click on the
Fixed
Geometry
tool in the shortcut menu appeared. The
Fixture
PropertyManager
appears.
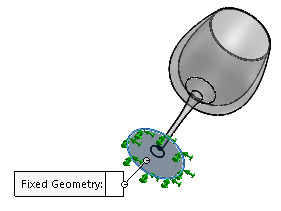
5. Rotate the model such that you can view its bottom face and then select it to apply the Fixed Geometry fixture, see Figure 8.8.
Figure 8.8
6. Click on the green tick-mark button in the PropertyManager. The Fixed Geometry fixture is applied to the bottom face of the Wine Glass. Now, change the orientation of the model back to isometric.
Figure 8.9
Section 6: Generating the Mesh
Now, you need to generate the mesh on the model.
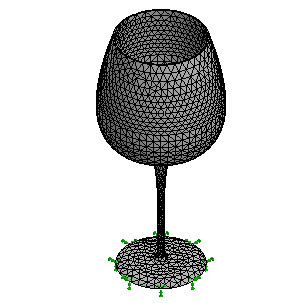
1. Generate the curvature-based mesh with the default mesh parameters by using the
Create Mesh
tool. Figure 8.9 shows the meshed model.
Section 7: Running the Frequency Analysis
Now, you need to run the static study.
1. Click on the
Run This Study
tool in the
Simulation
CommandManager
. The
Wine Glass Frequency Study
(
name of the study
)
window appears which displays the progress of analysis. After the process of running the analysis completes, the
Results
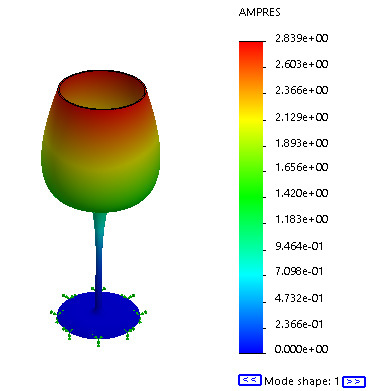
folder is added in the Simulation Study Tree with the amplitude results of specified number of mode shapes. By default, the first mode shape is activated. As a result, the mode shape and the resultant amplitude plot of the first natural frequency appear in the graphics area, see Figure 8.10.
Figure 8.10
Section 8: Displaying Natural/Resonant Frequencies
Now, you need to display the natural/resonant frequencies of the Wine Glass.
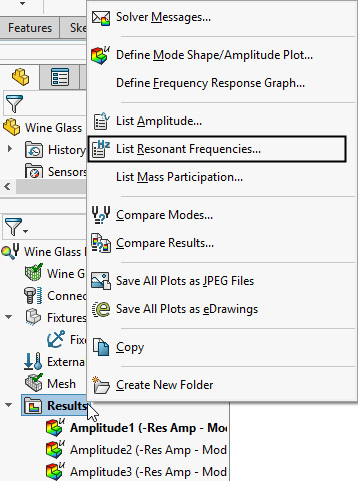
1. Right-click on the
Results
folder in the Simulation Study Tree and then click on the
List Resonant
Frequencies
tool in shortcut menu appeared, see Figure 8.11. The
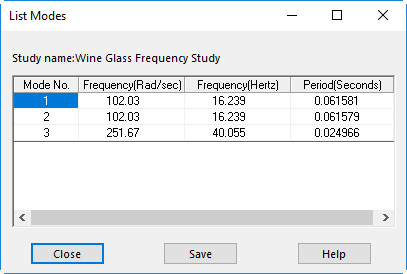
List Modes
window appears, see Figure 8.12.
Figure 8.11
Figure 8.12
The
List Modes
window displays the list of calculated natural/resonant frequencies of the model associated with the respective mode numbers in Rad/sec and Hertz. Also, it displays the corresponding period in seconds for each natural frequency, refer to Figure 8.12.
2. Review the calculated natural frequency of the Wine Glass for different mode numbers. The mode number 1 has the frequency of 6.239 hertz, the mode number 2 has the frequency of 16.239 hertz, and mode number 3 has the frequency of 40.055. You need to ensure that the Wine Glass does not operate in the frequency which matches with any one of its calculated natural frequencies to avoid the failure due to the resonance.
3. Click on the
Save
button in the
List Modes
window. The
Save As
dialog box appears. In this dialog box, browse to the location where you want to save the calculated results of the natural frequencies. Next, click on the
Save
button in the dialog box. The results file is saved with the
.csv
file extension in the specified location. You can open the
.csv
files in the Microsoft Excel.
4. Click on
Close
button in the
List
Modes
window to close it.
Section 9: Viewing Different Mode Shapes
1. By default, the
Amplitude1 (-Res Amp - Mode Shape 1-)
result
is activated in the
Results
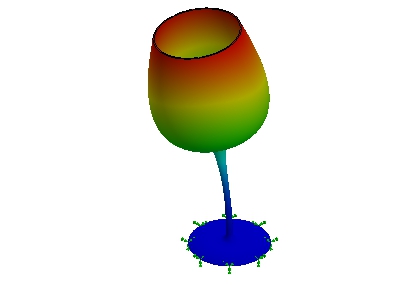
folder of the Simulation Study Tree. As a result, the mode shape 1 of the Wine Glass appears in the graphics area. To display the mode shapes 2 and 3, double-click on their respective results in the Simulation Study Tree. Figures 8.13 and 8.14 show the mode shapes 2 and 3, respectively.
Figure 8.13
Figure 8.14
Tip:
You can rotate the model to view the mode shapes of the model at different orientations.
Section 10: Displaying the Mass Participation
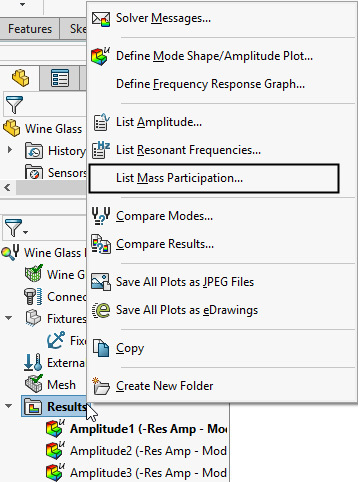
1. Right-click on the
Results
folder in the Simulation Study Tree and then click on the
List
Mass
Participation
tool in the shortcut menu appeared, see Figure 8.15. The
Mass
Participation
window appears, see Figure 8.16.
Figure 8.15
Figure 8.16
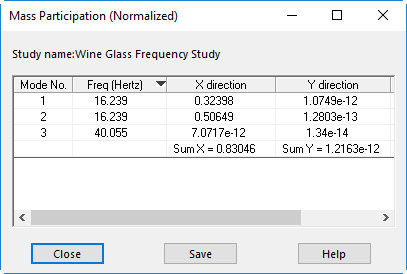
The
Mass Participation
window displays the list of natural/resonant frequencies and the mass participation in the X, Y, and Z directions for each mode number.
2. Review the mass participation for each mode number in the
Mass Participation
window. For example, the mass participation for the mode number 1 is approximately 0.32398 in the X-direction, 1.0749e-12 in the Y-direction, and 0.50649 in the Z-direction.
Section 11: Saving Results
Now, you need to save the model and its results.
1. Click on the
Save
tool in the
Standard
toolbar. The model and its results are saved in the location
> SOLIDWORKS Simulation > Case Studies > C08 Case Studies > Case Study 1
.
2. Close the SOLIDWORKS session.
Case Study 2: Frequency Analysis of a Pulley Assembly
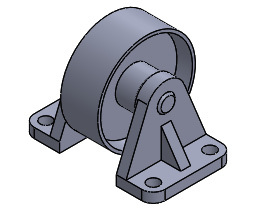
In this case study, you will perform the frequency analysis of a Pulley Assembly, see Figure 8.17 and determine its first five natural/resonant frequencies and their associated mode shapes.
Project Description
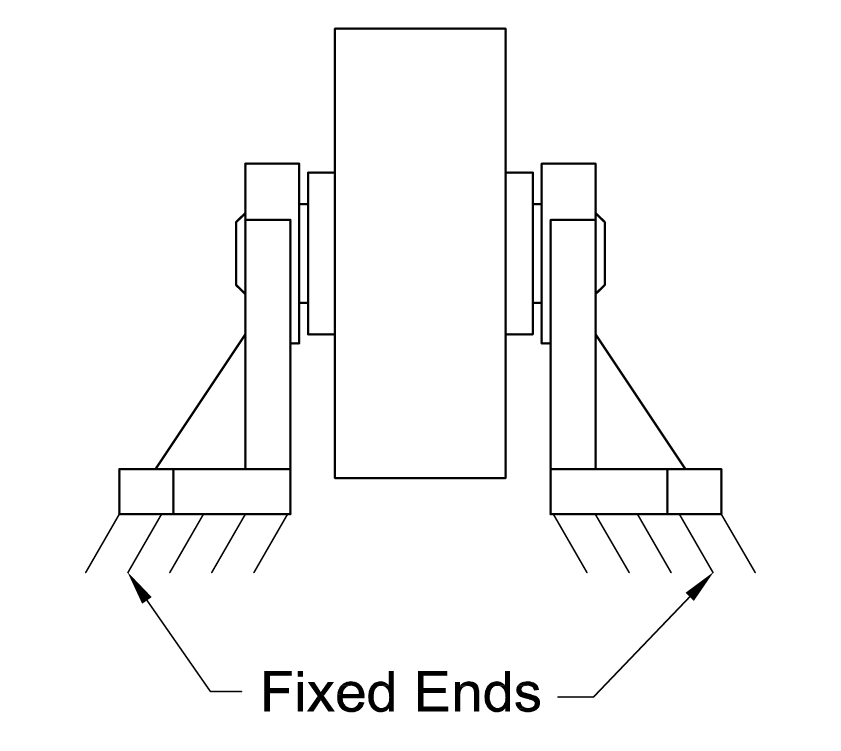
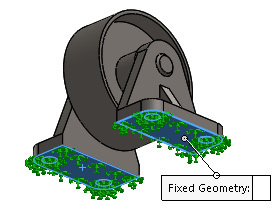
Both the Support components of the Pulley Assembly are fixed at the bottom, see Figure 8.18. All the components of the Pulley Assembly are made up of
Alloy Steel (SS)
material.
Figure 8.18
Project Summary
In this case study, you will run the frequency analysis on a Pulley Assembly without applying any external force.
NOTE:
You can run the frequency analysis with or without applying the fixtures and loads. However, it is recommended to apply the required fixtures to the model to represent its real operating conditions. Although, applying external loads to the model is optional but, if you do so, their effects are considered in the frequency analysis.
Learning Objectives
In this case study, you will learn the following:
1. Starting the Frequency Analysis
2. Defining Properties for the Frequency Analysis
3. Applying Materials and Fixtures
4. Generating the Mesh
5. Running the Frequency Analysis
6. Displaying Natural/Resonant Frequencies
7. Viewing Different Mode Shapes
8. Saving Results
Section 1: Starting the Frequency Analysis
1. Start SOLIDWORKS and then open the Pulley Assembly from the location
> SOLIDWORKS Simulation > Case Studies > C08 Case Studies > Case Study 2
.
NOTE:
You need to download the C08 Case Studies file which contains the files of this chapter by logging to the CADArtifex website (www.cadartifex.com), if not downloaded earlier.
2. Click on the
Simulation
tab in the
Simulation
CommandManager
. The tools of the
Simulation
CommandManager
appear.
3. Click on the
New Study
tool in the
Simulation
CommandManager
. The
Study
PropertyManager
appears on the left of the graphics area.
4. Click on the
Frequency
button in the
General
Simulation
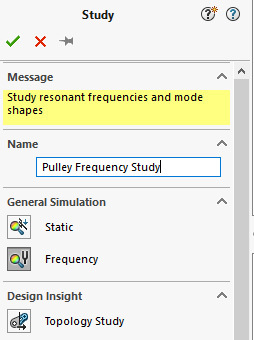
rollout of the PropertyManager to perform the frequency analysis, see Figure 8.19.
5. Enter
Pulley
Frequency
Study
in the
Study
name
field of the
Name
rollout in the PropertyManager, see Figure 8.19.
Figure 8.19
6. Click on the green tick-mark button in the PropertyManager. The
Pulley Frequency Study
is
added in the
Simulation Study Tree.
Section 2: Defining Properties for the Frequency Analysis
Before you start performing the frequency analysis, you can define its properties.
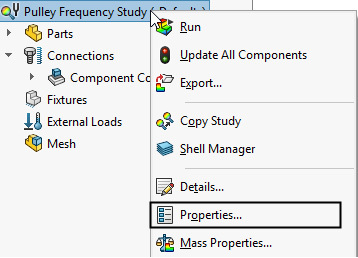
1. Right-click on the
Pulley Frequency Study
(
name of the study
)
in the Simulation Study Tree and then click on the
Properties
tool in the shortcut menu appeared, see Figure 8.20. The
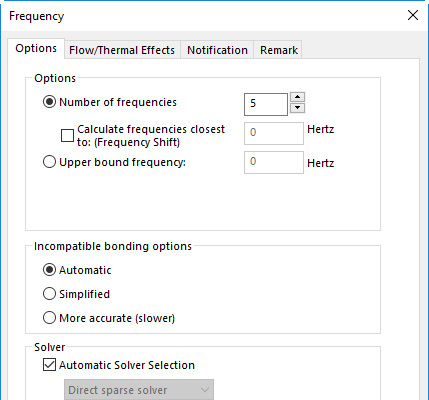
Frequency
dialog box appears, see Figure 8.21.
Figure 8.20
Figure 8.21
2. Make sure that the
5
is entered in the
Number of frequencies
field of the
Options
area in the dialog box to calculate the first five natural frequencies of the Pulley Assembly.
3. Click on the
OK
button in the dialog box.
Section 3: Applying Materials and Fixtures
Now, you need to apply the materials and fixtures to the model.
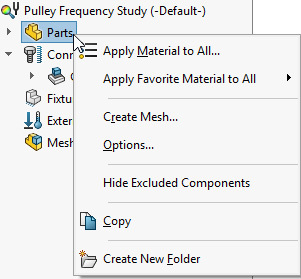
1. Right-click on the
Parts
folder in the Simulation Study Tree and then click on the
Apply
Material to All
tool in the shortcut menu appeared, see Figure 8.22. The
Material
dialog box appears.
Figure 8.22
2. Select the
Alloy Steel (SS)
material in the
Steel
category of the
SOLIDWORKS Materials
library in the dialog box.
3. Click on the
Apply
button and then the
Close
button in the
Material
dialog box. The Alloy Steel (SS) material is applied to all the components of the assembly.
Now, you need to apply the Fixed Geometry fixture.
4. Right-click on the
Fixtures
option in the Simulation Study Tree and then click on the
Fixed Geometry
tool in the shortcut menu appeared. The
Fixture
PropertyManager
appears.
5. Rotate the assembly such that you can view its bottom faces. Next, select the bottom faces of both the Support components of the assembly to apply the Fixed Geometry fixture, see Figure 8.23.
Figure 8.23
6. Click on the green tick-mark button in the PropertyManager. The Fixed Geometry fixture is applied to the selected faces. Now, change the orientation of the assembly back to isometric.
Section 4: Generating the Mesh
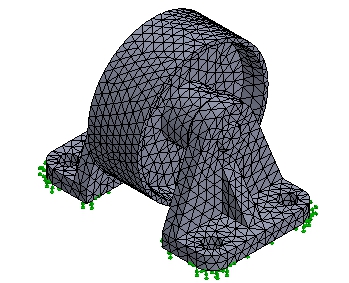
1. Generate the curvature-based mesh with default mesh parameters by using the
Create Mesh
tool. Figure 8.24 shows the meshed assembly.
Figure 8.24
Section 5: Running the Frequency Analysis
1. Click on the
Run This Study
tool in the
Simulation
CommandManager
. The
Pulley Frequency Study
(
name of the study
)
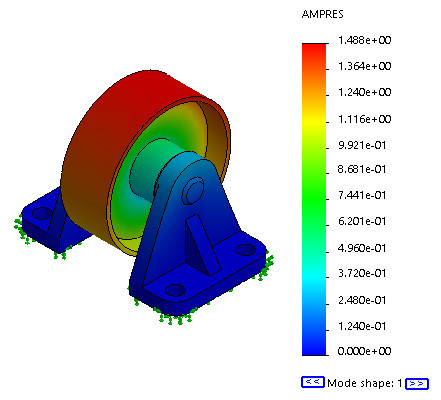
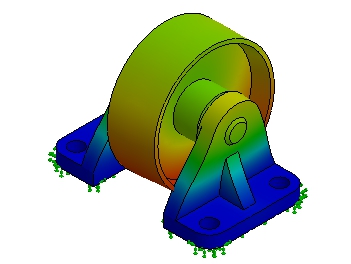
window appears which displays the progress of analysis. After the process of running the analysis is complete, the
Results
folder is added in the Simulation Study Tree. By default, the mode shape and the resultant amplitude plot of the first natural frequency appear in the graphics area, see Figure 8.25.
Figure 8.25
Section 6: Displaying Natural/Resonant Frequencies
Now, you need to display the natural/resonant frequencies of the Pulley Assembly.
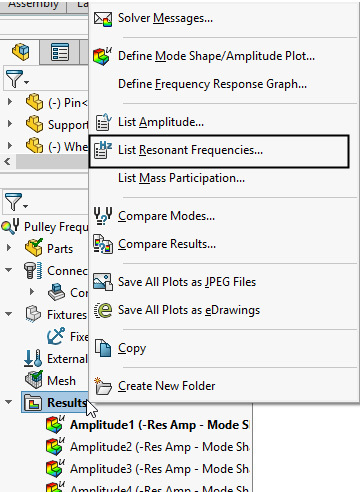
1. Right-click on the
Results
folder in the Simulation Study Tree and then click on the
List
Resonant
Frequencies
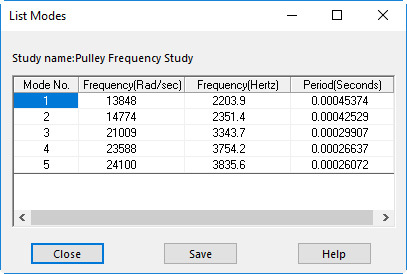
tool in shortcut menu appeared, see Figure 8.26. The
List
Modes
window appears, see Figure 8.27.
Figure 8.26
Figure 8.27
The
List Modes
window displays a list of calculated natural/resonant frequencies in Rad/sec and Hertz for each mode number. Besides, it displays the corresponding period in seconds for each mode number, see Figure 8.27.
2. Review the calculated natural frequency of the Pulley Assembly for each mode number. The mode number 1 has the frequency of approximate 2203.9 hertz and the mode number 2 has the frequency of approximate 2351.4 hertz. You need to ensure that the Pulley Assembly does not operate in the frequency which matches with any of its calculated natural frequencies to avoid the failure due to the resonance. Next, close the
List Modes
window.
Section 7: Viewing Different Mode Shapes
1. By default, the
Amplitude1 (-Res Amp - Mode Shape 1-)
result
is activated in the
Results
folder of the Simulation Study Tree. As a result, the mode shape 1 of the Pulley Assembly appears in the graphics area, see Figure 8.28. To display the other mode shapes, double-click on the respective results in the Simulation Study Tree. Figure 8.29 shows the mode shape 2 of the assembly.
Figure 8.28
Figure 8.29
Section 8: Saving Results
1. Click on the
Save
tool in the
Standard
toolbar. The model and its results are saved in the location
> SOLIDWORKS Simulation > Case Studies > C08 Case Studies > Case Study 2
.
2. Close the SOLIDWORKS session.
Hands-on Test Drive 1: Frequency Analysis of a Cantilever Beam
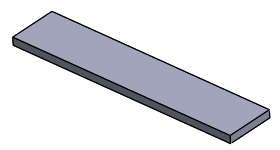
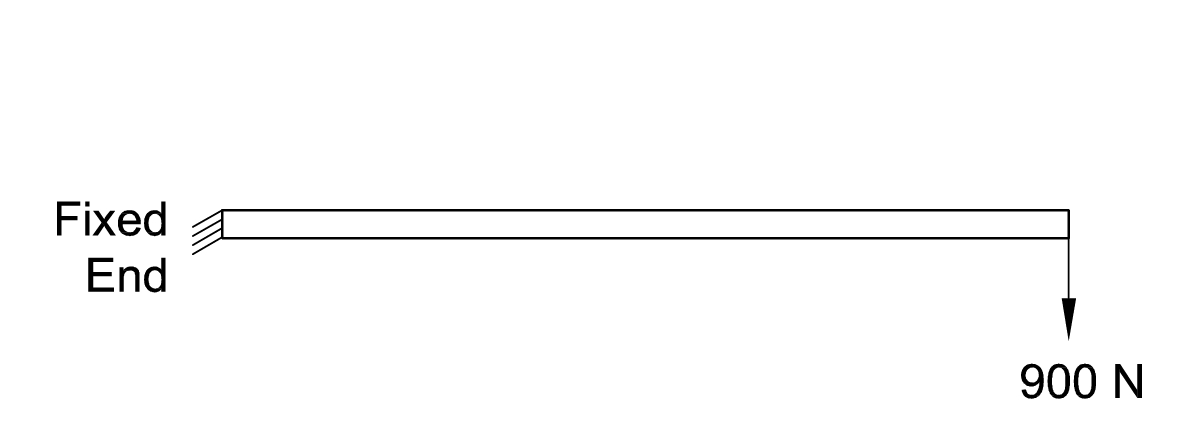
Perform the frequency analysis of a Cantilever Beam, see Figure 8.30 and determine its first five natural/resonant frequencies and their associated mode shapes.
Figure 8.30
Project Description
The Cantilever Beam is fixed at its left end and the downward load of 900 N is acting on its free end (right), see Figure 8.31. The Cantilever Beam is made up of
AISI 1035 Steel (SS)
material.
Figure 8.31
Project Summary
In this case study, you will run the frequency analysis on a Cantilever Beam with 900 N download load on its right end.
Summary
In this chapter, you have learned how to perform the frequency analysis to calculate the natural/resonant frequencies, the mode shapes associated to each natural frequencies, and the mass participations in X, Y, and Z directions.
Questions
•
The natural frequencies of an object are also known as
________
frequencies.
•
Every object has different natural frequencies depending on its
________
,
________, and ________
.
•
Each natural frequency of an object is associated with a shape called
________
shape.
•
When an object vibrates due to an external force with a frequency which matches with one of its natural frequencies, the object undergoes large displacements and stresses due to
________
.
•
The
________
tool is used to invoke the
List Modes
window, which displays the list of calculated natural frequencies.
•
The
________
tool is used to invoke the
Mass Participation
window, which displays the list of natural frequencies and the mass participation in the X, Y, and Z directions.
•
You can save the results of the natural frequencies in an external file having
________
file extension.
