Chapter 9
Drop Test Analysis
In this chapter, you will learn the following:
• Introduction to Drop Test Analysis
• Drop Test Analysis of a Cylinder
• Drop Test Analysis of a Helmet
• Drop Test Analysis of a Hard Drive
In earlier chapters, you have learned about the failure of a design due to the stresses developed beyond the yield strength of the material, which is also known as the material failure of a design. You have also learned about the failure of a design due to buckling and fatigue. In this chapter, you will learn about the failure of a design due to falling on a floor. In real-world conditions, the most common failure of many products are due to the accidental drop during transport, installation, repairing, or handling. Therefore, it is important to design a product that is impact resistant by performing the drop test from specific height or velocity.
Introduction to Drop Test Analysis
The drop test analysis is used to analyze the effect of dropping an object (part or assembly) on a rigid or flexible floor. In this analysis, SOLIDWORKS Simulation calculates the impact of a part or an assembly with the floor.
Case Study 1: Drop Test Analysis of a Cylinder
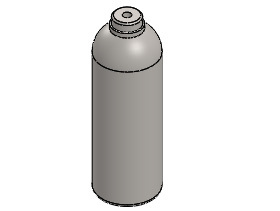
In this case study, you will perform the drop test analysis of a Cylinder, see Figure 9.1 and evaluate its effect of dropping on a rigid floor from the height of 2 feet.
Figure 9.1
Project Description
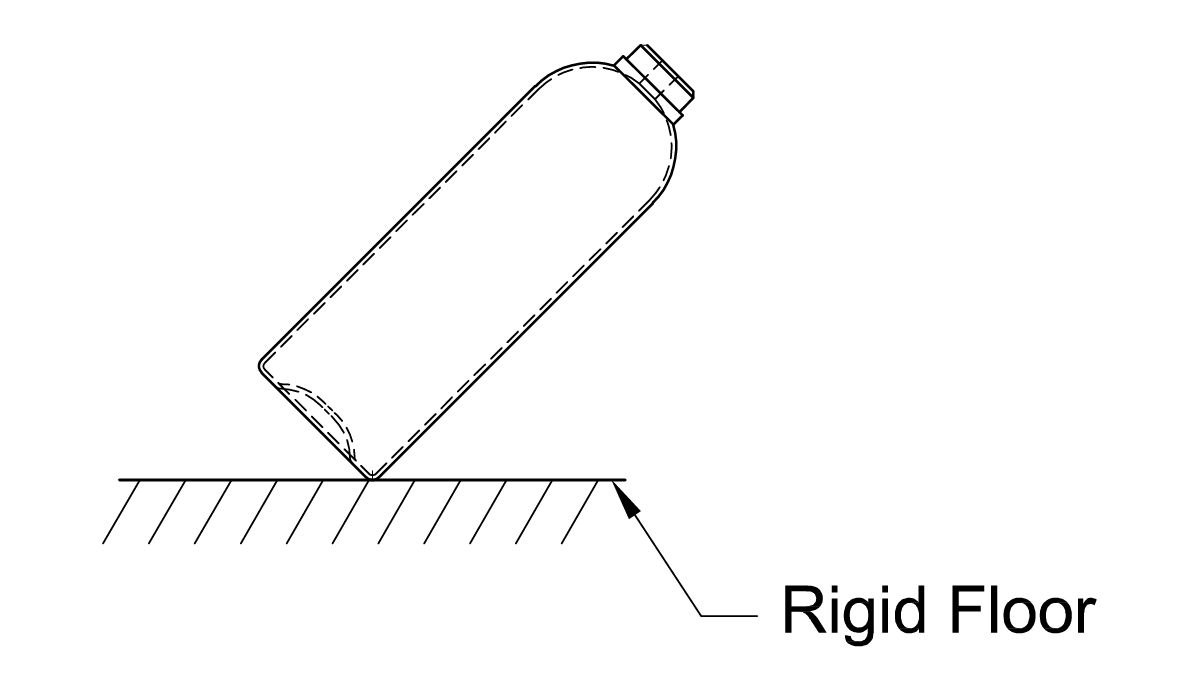
Determine the impact of the Cylinder with the rigid floor when falling from the height of 2 feet at an angle, see Figure 9.2. Note that the 2 feet height is measured from the lowest point of the Cylinder. The Cylinder is made up of
Plain Carbon Steel
material.
Figure 9.2
Project Summary
In this case study, you will run the drop test analysis on a Cylinder. In drop test, you no need to define any boundary conditions (fixtures and loads).
Learning Objectives
In this case study, you will learn the following:
1. Downloading Files of Chapter 9
2. Opening the Cylinder
3. Starting the Drop Test Analysis
4. Defining Drop Test Setup
5. Applying the Material
6. Defining Result Options
7. Generating the Mesh
8. Running the Drop Test Study
9. Animating the Stress Result
10. Saving Results
Section 1: Downloading Files of Chapter 9
1. Login to the
CADArtifex
website
(www.cadartifex.com)
with your user name and password.
2. After login to the CADArtifex website, click on
SOLIDWORKS Simulation > SOLIDWORKS Simulation 2018
. All resource files of this textbook appear in the respective drop-down lists.
3. Click on
Case Studies > C09 Case Studies
. The downloading of
Co9 Case Studies
file gets started. Once the downloading completed, you need to unzip the downloaded file.
4. Save the unzipped
C09 Case Studies
file in the
Case Studies
folder inside the
SOLIDWORKS Simulation
folder.
Section 2: Opening the Cylinder
1. Start SOLIDWORKS, if not already started.
2. Click on the
Open
button in the
Welcome
dialog box or the
Open
tool in the
Standard
toolbar. The
Open
dialog box appears.
3. Browse to the location
> SOLIDWORKS Simulation > Case Studies > C09 Case Studies > Case Study 1
of the local drive of your system. Next, select the
Cylinder
and then click on the
Open
button in the dialog box. The Cylinder model is opened in SOLIDWORKS.
Section 3: Starting the Drop Test Analysis
1. Click on the
Simulation
tab in the
Simulation
CommandManager
. The
tools
of the
Simulation
CommandManager
appear.
2. Click on the
New
Study
tool in the
Simulation
CommandManager
. The
Study
PropertyManager
appears at the left of the graphics area.
3. Click on the
Drop
Test
button in the
Specialized
Simulation
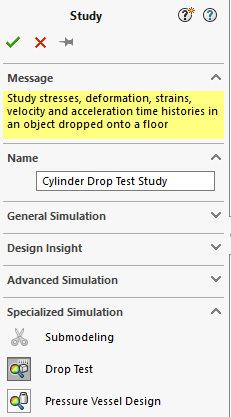
rollout of the PropertyManager to perform the drop test analysis.
4. Enter
Cylinder Drop Test Study
in the
Study
name
field of the
Name
rollout in the PropertyManager, see Figure 9.3.
5. Click on the green tick-mark button in the PropertyManager. The
Cylinder Drop Test Study
is
added in the
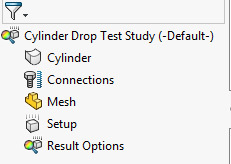
Simulation Study Tree, see Figure 9.4.
Figure 9.4
Tip:
It is evident from the Simulation Study Tree that the loads and fixtures (restraints) are not required to perform the drop test.
Section 4: Defining Drop Test Setup
Before you start performing the drop test analysis, you need to define the drop test setup.
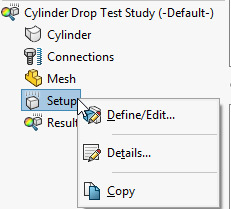
1. Right-click on the
Setup
option in the Simulation Study Tree and then click on the
Define/Edit
tool in the shortcut menu appeared, see Figure 9.5. The
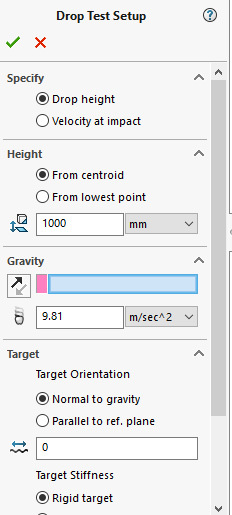
Drop Test Setup PropertyManager
appears, see Figure 9.6.
Figure 9.5
Figure 9.6
The
Specify
rollout of the PropertyManager is used to specify the type of drop test setup. By default, the
Drop
height
radio button is selected in this rollout. As a result, you can specify the drop test setup for an object dropping from an height on a floor. On selecting the
Velocity at impact
radio button, you can specify the drop test setup for an object falling with a velocity on a floor.
2. Make sure that the
Drop height
radio button is selected in the
Specify
rollout of the PropertyManager, see Figure 9.6.
The options in the
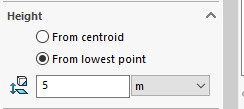
Height
rollout are used to specify the height from which the object is dropped from rest. On selecting the
From centroid
radio button, the height is measured from the centroid of the object to the floor in the direction of gravity. On selecting the
From lowest point
radio button, the height is measured from the lowest point of the object to the floor.
3. Select the
From lowest point
radio button in the
Height
rollout of the PropertyManager.
4. Select the
ft
(feet)
option in the
Unit
drop-down list and then enter
2
in the
Drop
height
field of the
Height
rollout, see Figure 9.7.
Figure 9.7
The
Gravity
rollout is used to define the direction and acceleration value of gravity. You can select a reference plane, an edge, or a planar face to define the direction of gravity. Note that if you select a reference plane or a planar face as the direction of gravity then the gravity will be applied in the direction normal to the selection.
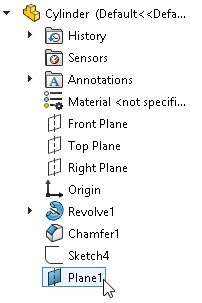
5. Expand the FeatureManager Design Tree, which is now at the top left corner of the graphics area and then click on the
Plane1
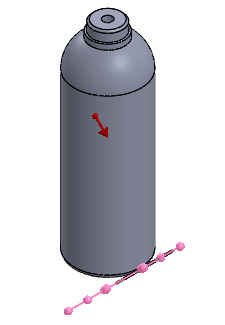
to define the direction of gravity, see Figure 9.8. The direction of gravity is defined normal to the plane selected. Also, an arrow pointing towards the direction of gravity appears in the graphics area, see Figure 9.9.
Figure 9.8
Figure 9.9
NOTE:
If needed, you can flip the direction of gravity by clicking on the
Reverse Gravity Reference
button in the
Gravity
rollout of the PropertyManager.
The options in the
Target
rollout are used to define the orientation and type of impact (target) plane. By default, the
Normal to gravity
radio button is selected in this rollout. As a result, the impact (target) plane is defined normal to the direction of gravity. You can also define the impact (target) plane, parallel to a reference plane. For doing so, select the
Parallel to ref. plane
radio button. The
Target orientation reference
field appears in this rollout. Next, select a reference plane. On doing so, the impact (target) plane is defined parallel to the selected reference plane.
6. Make sure that the
Normal to gravity
radio button is selected in this rollout to define the target plane normal to the direction of gravity.
Figure 9.10
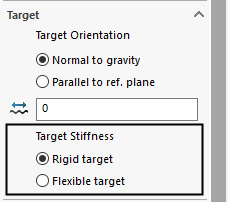
The
Target Stiffness
area of the
Target
rollout is used to define the type of target plane, see Figure 9.10. By default, the
Rigid target
radio button is selected in this area. As a result, the rigid floor is used as the target. On selecting the
Flexible target
radio button, you can define the flexible target by specifying its properties such as stiffness, mass density, and thickness of the flexible target plane in the respective fields of the
Stiffness and thickness
rollout of the PropertyManager. Note that this rollout appears only when the
Flexible target
radio button is selected.
7. Make sure that the
Rigid target
radio button is selected in the
Target Stiffness
area of the
Target
rollout of the PropertyManager.
Tip:
You can also set the coefficient of friction between the object and the impact (target) plane by using the
Friction
Coefficient
field of the
Target
rollout in the PropertyManager.
8. Click on the green tick-mark button in the PropertyManager. The drop test setup is defined.
Section 5: Applying the Material
Now, you need to apply the material to the model.
1. Invoke the
Material
dialog box by clicking on the
Apply
Material
tool in the
Simulation
CommandManager
.
2. Apply the
Plain Carbon Steel
material to the Cylinder and then close the
Material
dialog box.
Section 6: Defining Result Options
Now, you need to define the result options such as how long you want to run the analysis after the impact and number of result plots to be saved.
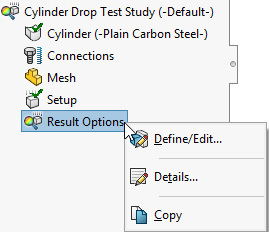
1. Right-click on the
Result
Options
option in the Simulation Study Tree and then click on the
Define/Edit
tool in the shortcut menu appeared, see Figure 9.11. The
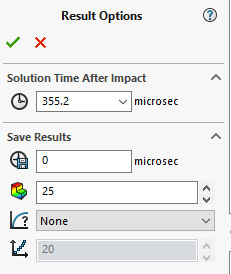
Result
Options PropertyManager
appears, see Figure 9.12.
Figure 9.11
Figure 9.12
The
Solution Time After Impact
field of the
Result
Options
PropertyManager
is used to specify how long you want to run the analysis after the impact. By default, SOLIDWORKS Simulation automatically calculates the appropriate time by using the
3L/Ve
formula. Where,
L
is the largest length of the object boundary box size and
Ve
is the square root of the modulus of elasticity.
The
Save Results Starting From
field of the
Save
Result
rollout of the PropertyManager is used to specify the time from when program will start saving the results. By default, the
0
is specified in this field. As a result, the program start saving the results immediately from the moment of first impact. The
No. of Plots
field is used to specify the number of result plots, the program will save.
2. Accept the default specified options in the
Result Options PropertyManager
and then click on the green tick-mark button.
Section 7: Generating the Mesh
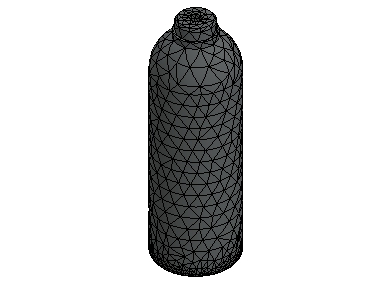
1. Generate the curvature-based mesh with the default mesh parameters by using the
Create Mesh
tool. Figure 9.13 shows the meshed model. In this figure, the reference plane is hide.
Figure 9.13
Section 8: Running the Drop Test Study
1. Click on the
Run This Study
tool in the
Simulation CommandManager
. The
Cylinder Drop Test Study
(
name of the study
)
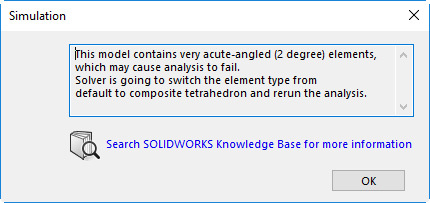
window appears which displays the progress of analysis. During the analysis, if the
Simulation
warning message appears, as shown in the Figure 9.14. Click on the
OK
button to continue with the analysis process.
Figure 9.14
After the process of analysis completes, the
Results
folder is added in the Simulation Study Tree with the stress, displacement, and strain results. By default, the
Stress
result is activated in the
Results
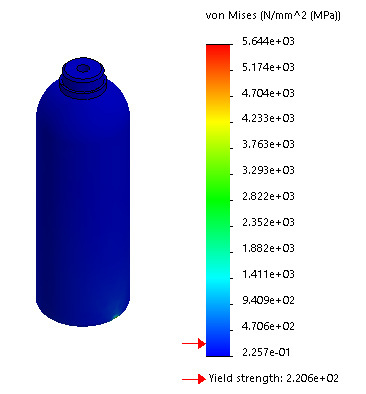
folder. As a result, the stress distribution on the model after the impact and the von Mises stress plot appear in the graphics area, see Figure 9.15.
Figure 9.15
Notice that the maximum Von Mises stress in the model at impact is
5.644e+03
(5,644.486) N/mm^2 (MPa) which significantly exceeds the yield strength of the material that is
2.206e+02
(220.594) N/mm^2 (MPa). The yield strength of the material is indicated by the red pointer in the von Mises stress plot.
Section 9: Animating the Stress Result
Now, you need to animate the stress result to validate the impact with respect to time.
1. Right-click on the
Stress1 (-vonMises-)
option in the
Results
folder of the Simulation Study Tree. A shortcut menu appears. In this shortcut menu, click on the
Animate
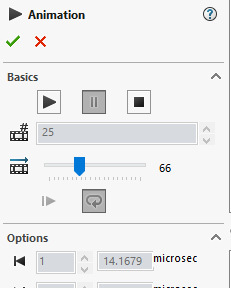
option. The
Animation
PropertyManager
appears, see Figure 9.16. Also, the animated effect of the object dropping on a rigid floor appears in the graphics area.
Figure 9.16
2. Zoom to the impact portion of the Cylinder to view its impact with the rigid floor, closely.
3. To save the animation as AVI file, select the
Save as AVI
file
check box in the PropertyManager. Next, specify the path to save the file.
4. After reviewing the animated effects of the deformed shape, click on the green tick-mark button in the PropertyManager to exit the PropertyManager and save the AVI file in the specified location.
Section 10: Saving Results
Now, you need to save the model and its results.
1. Click on the
Save
tool in the
Standard
toolbar. The model and its results are saved in the location
> SOLIDWORKS Simulation > Case Studies > C09 Case Studies > Case Study 1
.
2. Close the SOLIDWORKS session.
Case Study 2: Drop Test Analysis of a Helmet
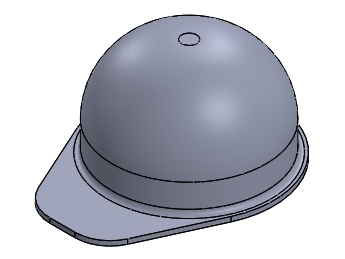
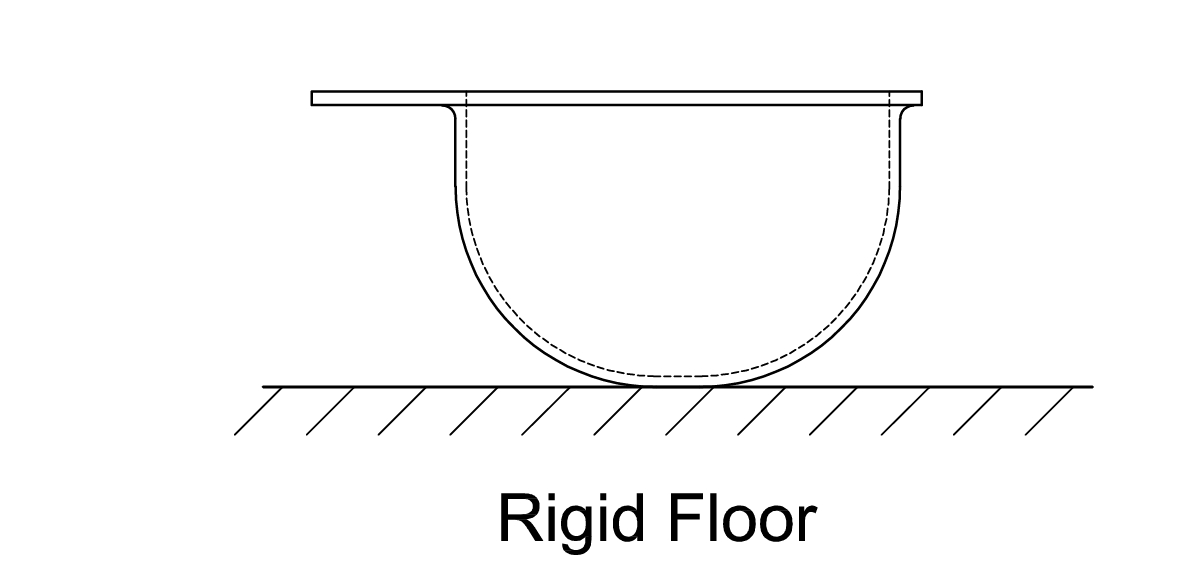
In this case study, perform the drop test analysis of a Helmet, see Figure 9.17 and evaluate its effect of dropping on a rigid floor from the height of 5 meters.
Figure 9.17
Project Description
Determine the impact of the Helmet with the rigid floor when falling from the height of 5 meters, see Figure 9.18. Note that the 5 meters height is measured from the lowest point of the Helmet. The Helmet is made up of
ABS
material.
Figure 9.18
Project Summary
In this case study, you will run the drop test analysis on a Helmet.
Learning Objectives
In this case study, you will learn the following:
1. Starting the Drop Test Analysis
2. Defining Drop Test Setup
3. Applying the Material
4. Defining Result Options
5. Generating the Mesh
6. Running the Drop Test Study
7. Displaying the Time History Plot
8. Animating the Stress Result
9. Saving Results
Section 1: Starting the Drop Test Analysis
1. Start SOLIDWORKS and then open the Helmet from the location
> SOLIDWORKS Simulation > Case Studies > C09 Case Studies > Case Study 2
.
NOTE:
You need to download the C09 Case Studies file which contains the files of this chapter by logging to the CADArtifex website (www.cadartifex.com), if not downloaded earlier.
2. Click on the
Simulation
tab in the
Simulation
CommandManager
. The tools of the
Simulation
CommandManager
appear.
3. Click on the
New
Study
tool in the
Simulation
CommandManager
. The
Study
PropertyManager
appears at the left of the graphics area.
4. Click on the
Drop Test
button in the
Specialized
Simulation
rollout of the PropertyManager.
5. Enter
Helmet Drop
Test
Study
in the
Study
name
field of the
Name
rollout in the PropertyManager.
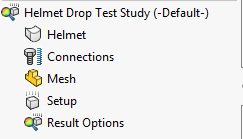
6. Click on the green tick-mark button in the PropertyManager. The
Helmet Drop Test Study
is
added in the
Simulation Study Tree, see Figure 9.19.
Figure 9.19
Section 2: Defining Drop Test Setup
Now, you need to define the drop test setup.
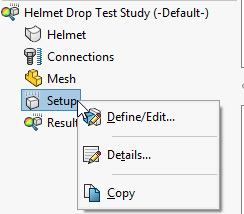
1. Right-click on the
Setup
option in the Simulation Study Tree and then click on the
Define/Edit
tool in the shortcut menu appeared, see Figure 9.20. The
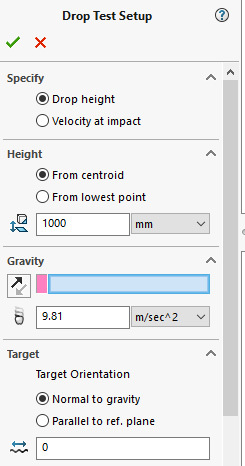
Drop Test Setup PropertyManager
appears, see Figure 9.21.
Figure 9.20
Figure 9.21
2. Make sure that the
Drop height
radio button is selected in the
Specify
rollout of the PropertyManager.
3. Select the
From lowest point
radio button in the
Height
rollout of the PropertyManager.
4. Select the
m
(meter)
option in the
Unit
drop-down list and then enter
5
in the
Drop
height
field of the
Height
rollout, see Figure 9.22.
Figure 9.22
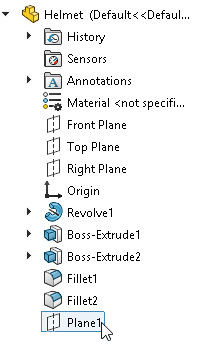
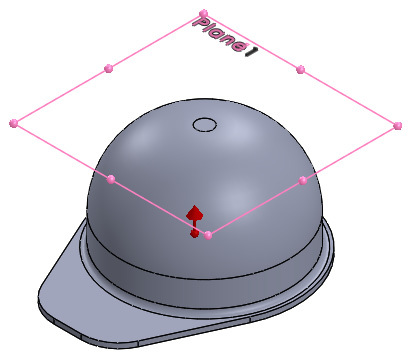
5. Expand the FeatureManager Design Tree, which is now at the top left corner of the graphics area and then click on the
Plane1
to define the direction of gravity, see Figure 9.23. The direction of gravity is defined normal to the plane selected. Also, an arrow pointing towards the direction of gravity appears in the graphics area, see Figure 9.24.
Figure 9.23
Figure 9.24
6. Make sure that the direction of gravity is towards the reference plane selected, see Figure 9.24. If needed, you can flip the direction of gravity by clicking on the
Reverse Gravity Reference
button in the
Gravity
rollout of the PropertyManager.
7. Make sure that the
Normal to gravity
radio button is selected in the
Target
rollout of the PropertyManager.
8. Make sure that the
Rigid target
radio button is selected in the
Target Stiffness
area of the
Target
rollout.
9. Click on the green tick-mark button in the PropertyManager. The drop test setup is defined.
Section 3: Applying the Material
Now, you need to apply the material to the model.
1. Invoke the
Material
dialog box by clicking on the
Apply
Material
tool in the
Simulation
CommandManager
.
2. Apply the
ABS
material to the Helmet and then close the
Material
dialog box.
Section 4: Defining Result Options
Now, you need to define the result options such as how long you want to run the analysis after the impact and number of result plots to be saved.
1. Right-click on the
Result
Options
option in the Simulation Study Tree and then click on the
Define/Edit
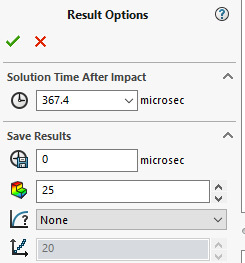
tool in the shortcut menu appeared. The
Result
Options
PropertyManager
appears, see Figure 9.25.
Figure 9.25
2. Enter
30
in the
No. of Plots
field of the PropertyManager as the number of plots to be saved by program for all nodes.
3. Click on the green tick-mark button in the PropertyManager.
Section 5: Generating the Mesh
1. Generate the curvature-based mesh with the default mesh parameters by using the
Create Mesh
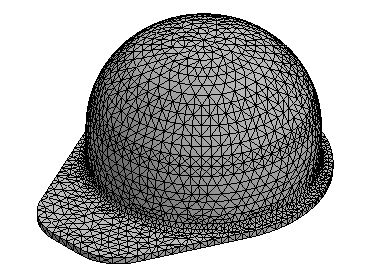
tool. Figure 9.26 shows the meshed model. In this figure, the reference plane is hide.
Figure 9.26
Section 6: Running the Drop Test Study
1. Click on the
Run This Study
tool in the
Simulation
CommandManager
. The
Cylinder Drop Test Study
(
name of the study
)
window appears which displays the progress of analysis. After the process of analysis completes, the
Results
folder is added in the Simulation Study Tree with the stress, displacement, and strain results. By default, the
Stress
result is activated in the
Results
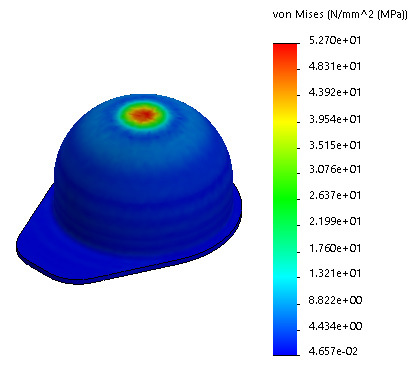
folder. As a result, the stress distribution on the model after the impact and the von Mises stress plot appear in the graphics area, see Figure 9.27.
Notice that the maximum von Mises stress in the model at impact is
5.270e+01
(52.700) N/mm^2 (MPa).
Figure 9.27
Section 7: Displaying the Time History Plot
1. Right-click on the
Results
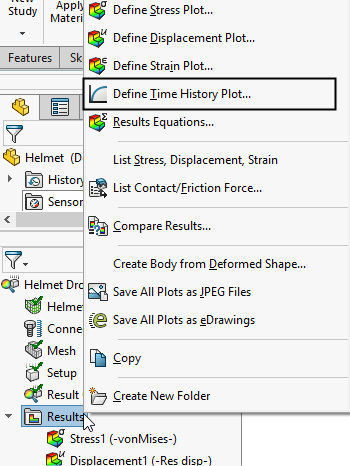
folder in the Simulation Study Tree. A shortcut menu appears, see Figure 9.28.
Figure 9.28
2. Click on the
Define Time History Plot
tool in the shortcut menu. The
Time History Graph PropertyManager
appears, see Figure 9.29.
Figure 9.29
Notice that in the
Response
rollout of the PropertyManager, all the nodes of the model appear in a field. You can select a node or multiple nodes in this field, whose response graph is to be generated. Alternatively, you can click on a node or nodes in the graphics area.
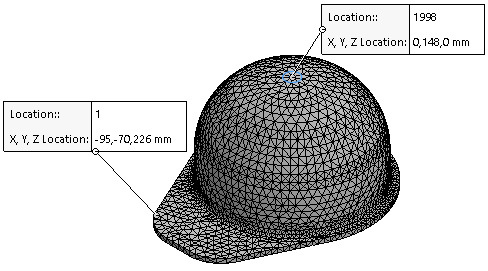
3. Click on a node at the top center (impact area) of the model in the graphics area, see Figure 9.30. The node 1998 at the impact area get selected. Note that the selected node number of the impact area may differ in your case depending on your selection. Also, the node number 1 is selected, by default.
Figure 9.30
4. Make sure that the
Time
option is selected in the
X axis
drop-down list of the PropertyManager.
5. Make sure that the
Stress
and
VON: von Mises Stress
options are selected in the respective fields of the
Y axis
area in the PropertyManager.
6. Select the
N/mm^2 (MPa)
in the
Unit
drop-down list of the
Y-axis
area of the PropertyManager.
7. Click on the green tick-mark button in the PropertyManager. The
Time History Graph
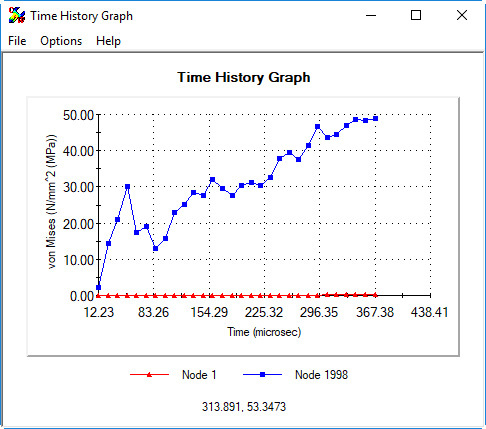
window appears, see Figure 9.31. This window displays the response graphs of the selected nodes (1 and 1998) for the von Mises stress vs solution steps.
Figure 9.31
Notice that the maximum von Mises stress on the selected node (1998) is approximate
50
N/mm^2 (MPa), which occurs at time 367 microseconds from impact.
Section 8: Animating the Stress Result
Now, you need to animate the stress result to validate the impact with respect to time.
1. Right-click on the
Stress1 (-vonMises-)
option in the
Results
folder of the Simulation Study Tree. A shortcut menu appears. In this shortcut menu, click on the
Animate
option. The
Animation
PropertyManager
appears. Also, the animated effect of the object dropping on a rigid floor appears in the graphics area. You can zoom to the high stress area (impact area) of the object to views its effects closely.
2. After reviewing the animated effects, click on the green tick-mark button in the PropertyManager to exit the PropertyManager.
Section 9: Saving Results
1. Click on the
Save
tool in the
Standard
toolbar. The model and its results are saved in the location
> SOLIDWORKS Simulation > Case Studies > C09 Case Studies > Case Study 2
. Next, close the SOLIDWORKS session.
Hands-on Test Drive 1: Drop Test Analysis of a Hard Drive
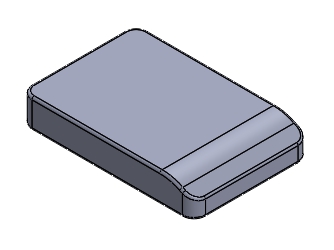
In this case study, perform the drop test analysis of a external Hard Drive, see Figure 9.32 and evaluate its effect of dropping on a rigid floor from the height of 1 meter.
Project Description
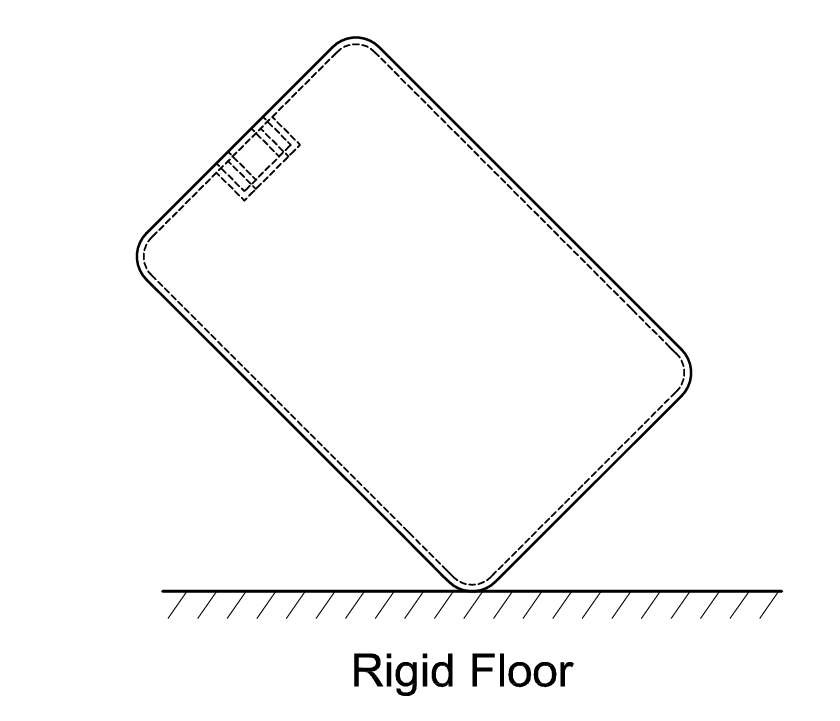
Determine the impact of the Hard Drive with the rigid floor when falling from the height of 1 meter, see Figure 9.33. Note that the 1 meter height is measured from the lowest point of the object. The Hard Drive is made up of
PVC Rigid
plastics material.
Figure 9.32
Figure 9.33
Summary
In this chapter, you have learned how to perform the drop test analysis to calculate the impact of an object with floor.
Questions
•
The drop test analysis is used to analyze the effect of dropping an object on a
________
or a
________
floor.
•
The
________
radio button of the
Drop Test Setup PropertyManager
is used to measure the drop height from the centroid of the object to the floor in the direction of gravity.
•
The
________
radio button of the
Drop Test Setup PropertyManager
is used to define the impact (target) plane, parallel to a reference plane.
•
The
________
radio button of the
Drop Test Setup PropertyManager
is used to specify the drop test setup for an object dropping from an height on a floor.
•
The
________
radio button of the
Drop Test Setup PropertyManager
is used to specify the drop test setup for an object falling with a velocity on a floor.
