Chapter 10. HTTP Tools
This book began with an introduction to HTTP that included simple tools such as cURL and HTTPie (see “Command-Line HTTP” for examples). These are key tools that you’ll see used again and again throughout the book, but there are also a host of other tools which are very handy in particular scenarios; this chapter is dedicated to showing you the other tools in the box.
These are all tools that you can use without changing your application (although we’ll talk about that too, in Chapter 11) so you can quickly inspect traffic in a variety of settings and review what’s happening.
We’ll start with cURL and HTTPie, and add in two tools that I use extensively when working with JSON services in particular: jq and the Python JSON module. There are also some excellent GUI alternatives to these command-line tools that may fit your needs better. We’ll look at Postman, which is a great graphical tool for working with web requests.
On a more network level, there’s Wireshark, an excellent tool for inspecting traffic as it goes over your network card. There’s ngrok, which allows you to make your local API or website visible externally; I use this regularly when working with local development APIs and with webhooks. We’ll also look at the proxy tools Charles and Fiddler.
Each of these tools will help you to solve different problems, so it’s well worth taking a look at each of them. That way, you’ll know what’s available and where to start when you need to use these tools in your own work.
Easy Command-Line JSON
The trouble with JSON APIs is that they often return a wall of text; some APIs offer pretty printing but otherwise the result is really not designed for humans to read. An example would be something like Example 10-1, which is a simple request to get a list of Pinterest boards for a specific user.
Note
To use the Pinterest API, you’ll need to register an account with Pinterest and then get an access token. They support standard OAuth, but there’s also a handy access token generator, which is the quickest way to get started with these examples.
Example 10-1. Unformatted JSON from the Pinterest API
$ curl https://api.pinterest.com/v1/me/boards/ -H 'Authorization: Bearer AVHk...A'
{"data": [{"url": "https://www.pinterest.com/lorna0641/crochet/", "id": "346636571258417680", "name": "crochet"}, {"url": "https://www.pinterest.com/lorna0641/wood/", "id": "346636571258417677", "name": "wood"}, {"url": "https://www.pinterest.com/lorna0641/sew/", "id": "346636571258417679", "name": "sew"}]}
There are a few things we can do to make this easier to read than the output we get from cURL. One option is to simply use HTTPie, which will parse the JSON and present it in a much prettier format, as you can see in Example 10-2.
Example 10-2. JSON output from HTTPie calling the Pinterest API
$ http -p b https://api.pinterest.com/v1/me/boards/ 'Authorization:Bearer AVHk...A'
{
    "data": [
        {
            "id": "346636571258417680",
            "name": "crochet",
            "url": "https://www.pinterest.com/lorna0641/crochet/"
        },
        {
            "id": "346636571258417677",
            "name": "wood",
            "url": "https://www.pinterest.com/lorna0641/wood/"
        },
        {
            "id": "346636571258417679",
            "name": "sew",
            "url": "https://www.pinterest.com/lorna0641/sew/"
        }
    ]
}
Tip
When investigating a new API or working closely with a particular endpoint, it’s always worth checking if there is a built-in “pretty print” mode. Many APIs offer this and it can be valuable when a human needs to inspect the output. I’d also recommend this feature as an excellent thing to consider adding to your own APIs.
There are also JSON-specific tools that I use with cURL to output the JSON in a more readable way. These tools also have a side advantage in that they are designed to work with any JSON data that you have, not just with web requests.
One nice option is to just pipe your JSON through the Python JSON module from cURL. I use this a lot since it’s usually available if you have Python installed, which I do. To add this to a curl command, only two things need to change:
-
Add the
-sswitch to yourcurlcommand to suppress the progress output, since this will confuse things. -
Pipe the output of cURL to
python -mjson.tool.
Another tool that is a bit more featured is the excellent jq. This does a great deal more than just pretty-print your JSON, but that’s mostly what I use it for! It’s available for easy install on most platforms (it’s included in my package manager on Ubuntu, for example) and is recommended if you work regularly with JSON.
The commands to pipe cURL output through to other processors are pretty similar and I think it helps to see them side by side.
First, the original curl command again:
curl https://api.pinterest.com/v1/me/boards/ -H 'Authorization: Bearer AVHk...A'
The next example uses the Python module:
curl -s https://api.pinterest.com/v1/me/boards/ -H 'Authorization: Bearer AVHk...A' | python -mjson.tool
Finally, we can use jq to format the JSON nicely; the "." just tells jq to work with the entire document it receives:
curl -s https://api.pinterest.com/v1/me/boards/ -H 'Authorization: Bearer AVHk...A' | jq "."
Any of the formatting options are great, and we also saw the HTTPie example earlier. HTTPie and jq also support color-formatted output, which can be easier to read, but this depends on your taste and also the tools easily available on your platform. Being aware of which tools are available and what they do will really help you to work efficiently with APIs of all kinds—including your own.
Graphical cURL Alternatives
Working with HTTP doesn’t have to mean the command line; there are some great tools around that can do everything cURL can do, but present it in a more intuitive interface. One really excellent, cross-platform example is Postman. In the previous examples we looked at fetching some JSON data from an endpoint that needed an Authorization header. We can easily do the same with Postman; its interface is shown in Figure 10-1.
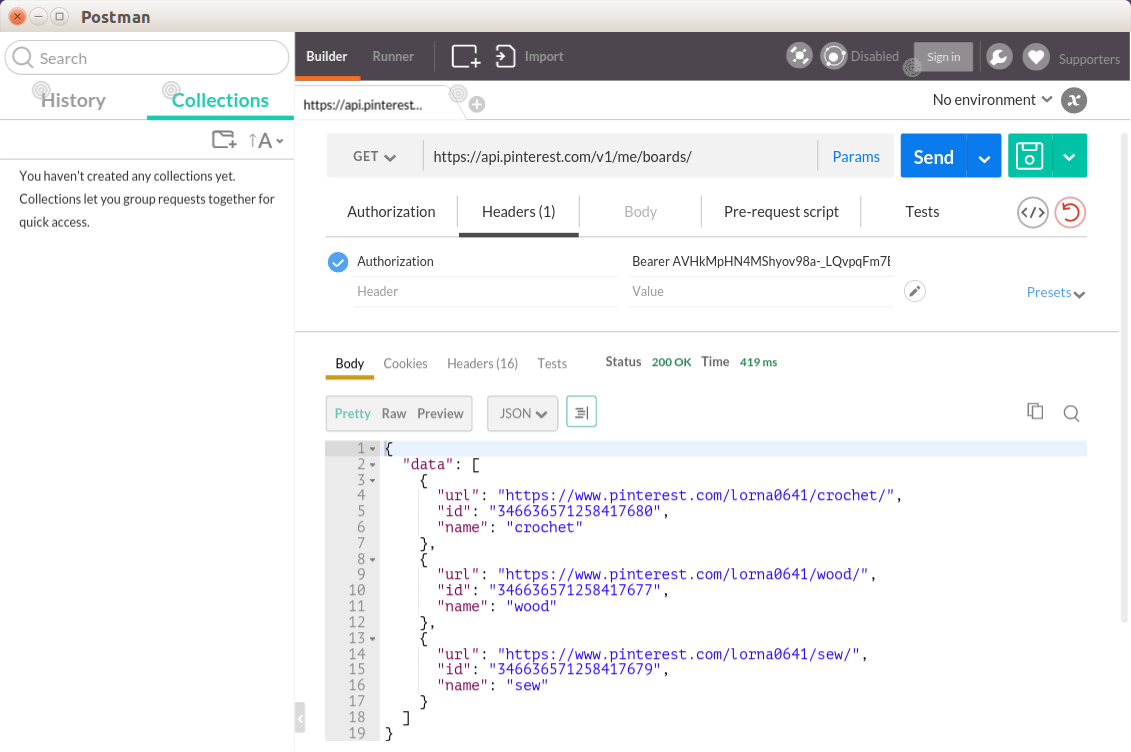
Figure 10-1. Using Postman to send HTTP requests
The main advantages of using Postman are that you can save and even group your existing requests into collections, making it easy to return to earlier examples at a later date. It is easy to change individual aspects of your request, such as the data and headers to send, without needing to edit a long command string. The output is easy to see and work with, and there are also some great time-saving features such as the ability to have Postman do your OAuth authentication steps for you when you need to fetch an access token.
There are a wide selection of tools that perform pretty similar jobs; you’ve seen Postman here (it started life as a Chrome plug-in but is now a standalone application in its own right), but there are others. Firefox has the HttpRequester plug-in, which is very useful. On a Mac, you might also like to try Paw, which comes highly recommended.
Inspect HTTP Traffic with Wireshark
Wireshark is a “network protocol analyzer.” In plain English, that means that it takes a copy of the traffic going over your network card, and presents it to you in a human-readable way. You don’t need to do any configuration of your application or network settings to use it; once it’s installed, it can just start showing us the traffic. Wireshark is cross-platform and open source.
When you run Wireshark, you see a screen like the one in Figure 10-2.
The lefthand column lets you pick which network card you want to capture (this screenshot is from my Ubuntu laptop; you’ll see things a little differently on different operating systems). The “eth0” is your local wired network, “wlan0” is the wireless network, and “lo” is your local loopback. Look out for this if you’re making API calls to localhost as they use “lo” rather than whatever connection your machine uses to access the outside world. If you’re working with virtual machines, you will see more network connections here, so you can pick the one for which you want to see the traffic.
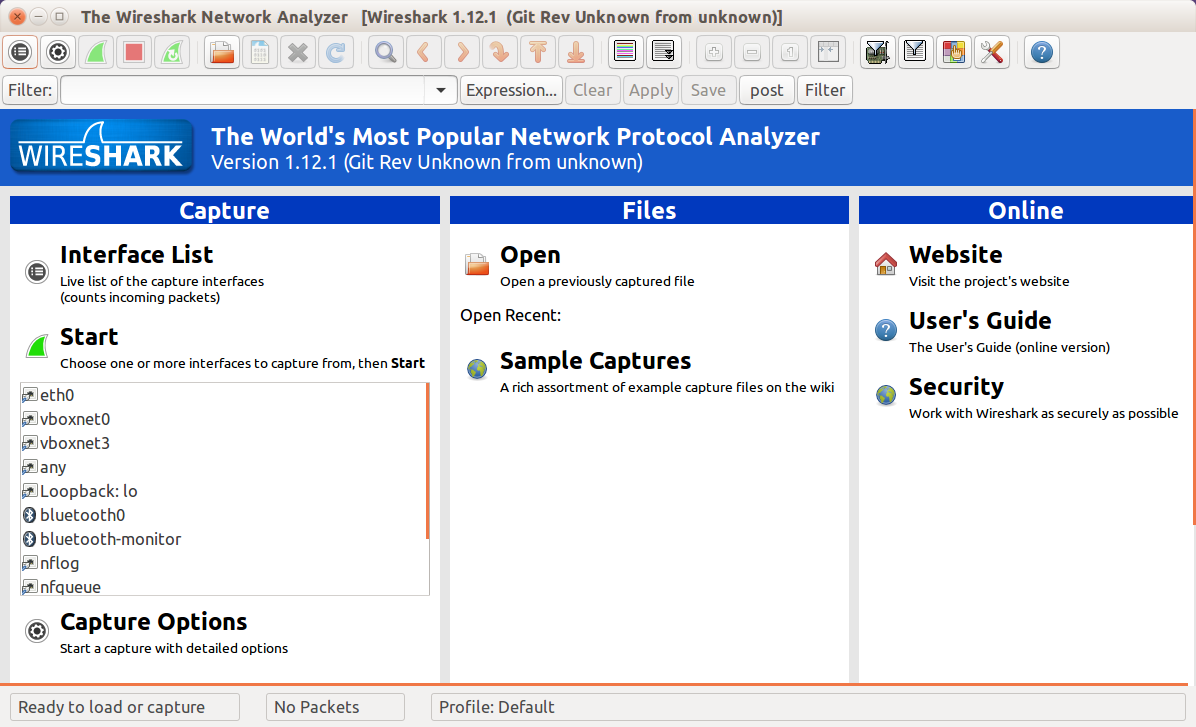
Figure 10-2. Initial screen when starting Wireshark
The other option you might want to use from this initial view is “open.” Wireshark runs on your desktop or laptop and captures the traffic going over a network card on your machine. However, what if it’s not your machine that you need the traffic from? It’s rare to have a server with a GUI that you could install Wireshark on, so instead a command-line program called tcpdump (Windows users have a port called WinDump) can be used. This program captures network traffic and can write it to a file; the resulting files can then be opened in Wireshark to be analyzed.
Whether the traffic is captured live or comes from a file captured elsewhere, what happens next is the same: we view the traffic and start to examine what is happening. When I start a capture on my machine, I see something like Figure 10-3.
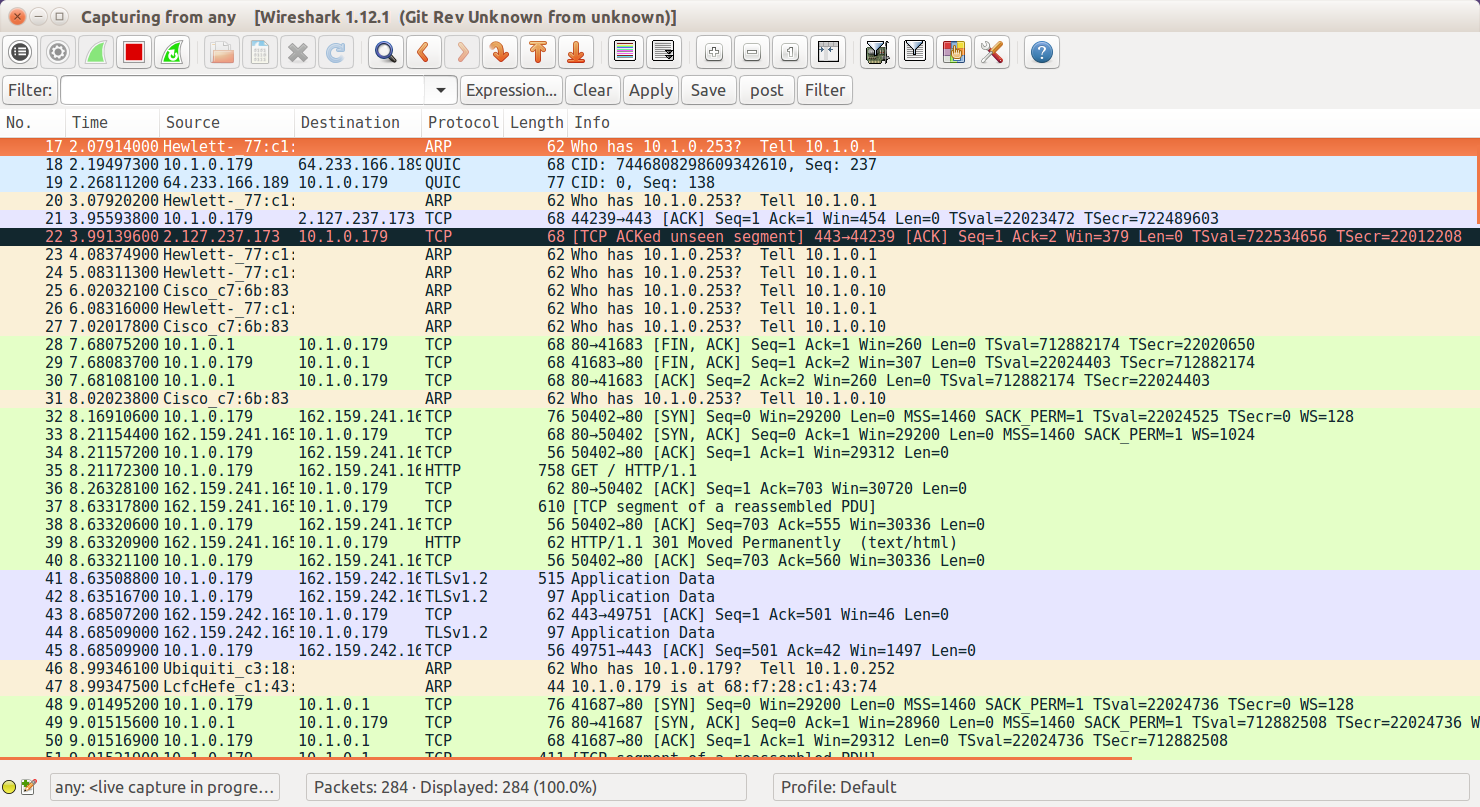
Figure 10-3. Wireshark showing all network card traffic
The first thing to do here is to restrict the amount of traffic being displayed to just the lines of interest by placing *http* in the filter field. Now a list of all the HTTP requests and responses that have been taking place are visible, making it possible to pick out the ones that are useful for solving a given problem.
Clicking on a request makes the detail pane open up, showing all the headers and the body of the request, or response, that was selected. This allows you to drill down and inspect all the various elements of both the body and the header of the HTTP traffic; when debugging, this is a very helpful technique for identifying whether the client is sending an incorrect request or if the problem is in the server response. You can see an example of a request in Figure 10-4.
To see the requests and responses in the context of one another, right-click on either the request or the response and choose “follow TCP stream.” With this, you can clearly see the requests and responses side by side, with the request shown in red (if you’re reading this in monochrome, look for a blank line separating request and response) and the response shown in blue in Figure 10-5.
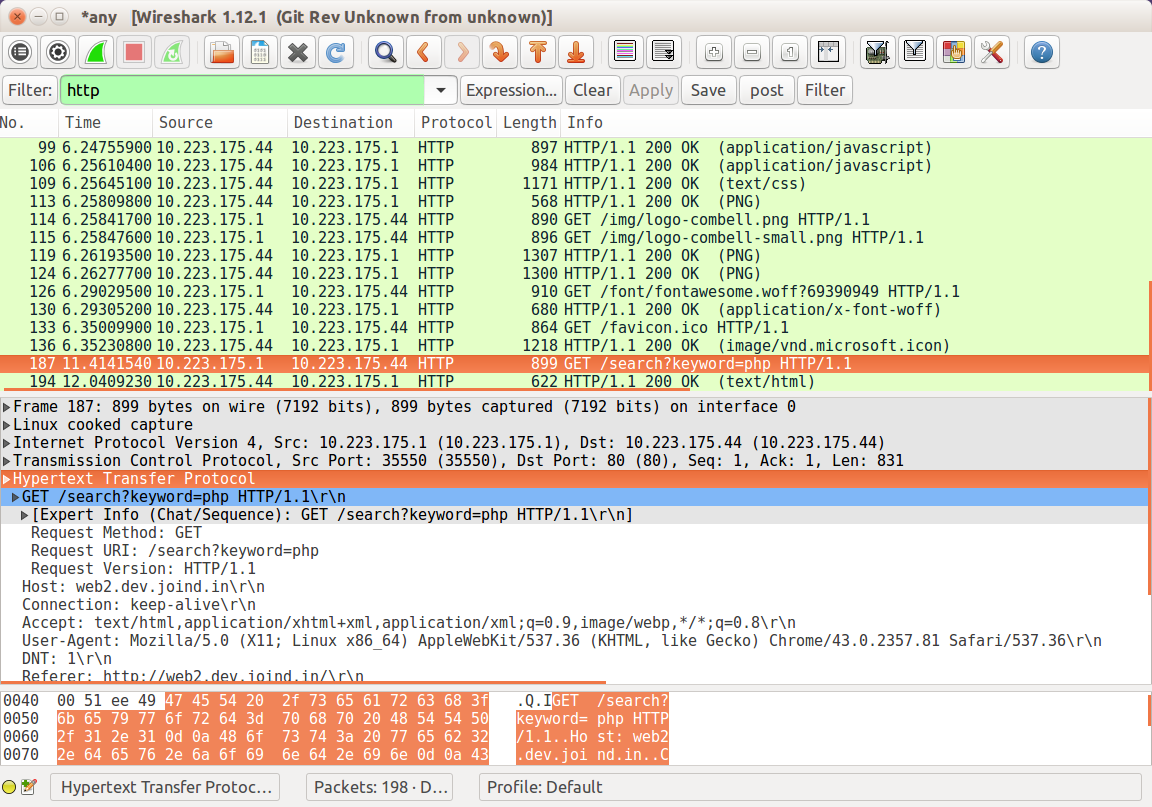
Figure 10-4. Detail of a request including headers in Wireshark
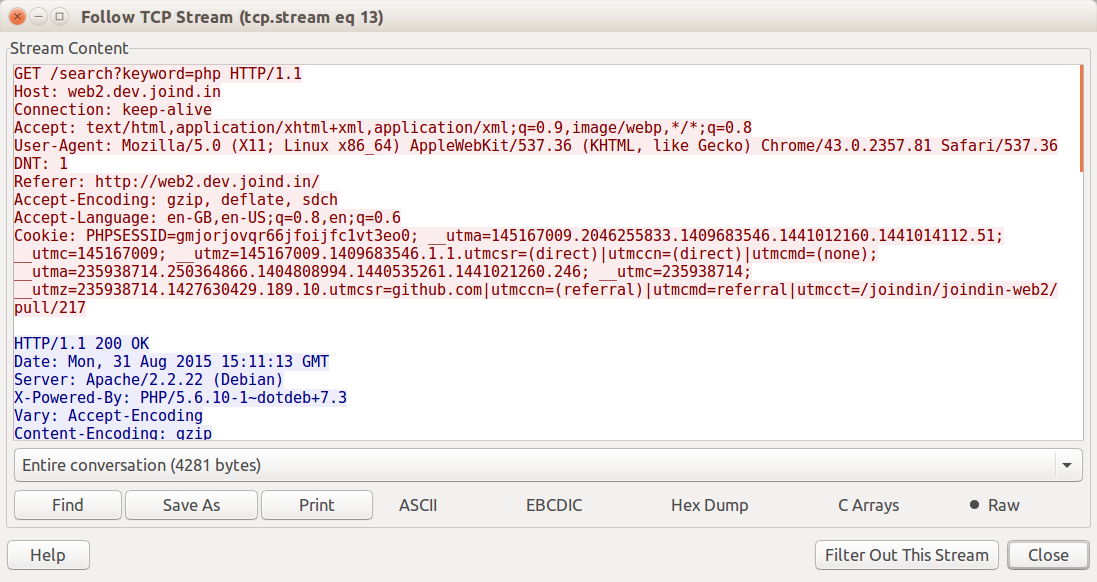
Figure 10-5. Wireshark showing a single TCP stream
Wireshark’s ability to quickly show what’s going on at the HTTP level without modifying the application is a huge advantage. Often, it’s the first tool out of the box when something that “usually works” has suddenly stopped—and it will very quickly show you that your API is suddenly returning an HTML error message rather than the JSON that the client was expecting!
Wireshark can also handle SSL if it has access to the server certificate for the SSL connection. This is by design; SSL is intended to be difficult to intercept and report on, but that does make things tricky for developers. If you own the server that is serving the SSL traffic then you can add the certificate to Wireshark and it will be able to decrypt it, but otherwise Wireshark is unable to inspect this type of traffic.
While Wireshark is easiest to use with applications running on the same machine, it’s also possible to capture from other machines in real time. Mostly this is helpful when working with a development platform that increasingly will be on a virtual machine rather than on your actual laptop.
Before you begin, you should have Wireshark installed on both the host and guest machines (on the guest machine you actually only need something called dumpcap, but I find installing Wireshark brings in the tool I need and all the dependencies). You should also be able to connect to the virtual machine via SSH; if you’re using Vagrant to manage your virtual machines, you can usually do this with the vagrant ssh command.
The way this works is to run dumpcap inside the guest, and pipe the resulting data straight into Wireshark on the host machine. Since we’re doing this over SSH, the command includes a filter to exclude that SSH traffic. The command therefore looks something like this:
wireshark -k -i <(vagrant ssh -c "sudo dumpcap -P -i any -w - -f 'not tcp port 22'" -- -ntt)
This is pretty complicated since there are so many moving pieces, but you can see the general shape of the command and we’ll pick out the elements one at a time.
-
The parentheses contain a command, the output of which we pipe to Wireshark with
-kto tell it to start capturing immediately. -
The
vagrant sshcommand accepts a-cparameter to tell it to SSH in and immediately run the specified command. The--and-nttswitches tell SSH to use a tty and how to read from it. -
Then in the middle of it all is the command we run on the guest, to run
dumpcapon any interfaces, with a filter to ignore SSH traffic. -
Note that the
dumpcapcommand must be run as root, which makes sense as I’d prefer it if unprivileged users did not have access to all the network traffic on a computer.
This approach means that I can run a live capture on the traffic going over the network interface of a virtual machine development platform, which is very, very useful. You can use this approach to run live capture on other machines as well, by adapting the command to use the appropriate SSH commands for the other machine you want to connect to.
Tunnel Local Traffic Remotely with ngrok
ngrok is a hosted service offering a secure tunnel for your HTTP traffic that is especially useful in a couple of specific scenarios:
-
Wanting to make a local/development website or API available to the outside world, for example for testing by someone else or on a mobile device
-
Wanting an external tool to be able to reach something running locally on my development platform, for example when developing webhook receivers
ngrok is cross-platform, easy to use, and can be very useful for quickly opening tunnels to endpoints that you want to share with others during development. Once ngrok is installed, it is necessary to register to use the service and obtain an authtoken. It’s a one-off process to add this token to your local configuration and then everything is ready.
Note
The original v1 of ngrok was open source. The newer v2 is still free to use for developers but is no longer an open source tool; you will need to register an account in order to use it.
ngrok is a command-line tool that runs on a local machine and specifies which port to expose to the wider world. In this example, I’m working on a simple API endpoint (that you’ll see again in Chapter 11) that is available at http://localhost:8080 on my laptop. It’s useful to be able to make this available to others, perhaps a client or a colleague in another location, and ngrok makes this very easy.
Let’s start by simply exposing that port 8080 endpoint to the world using ngrok:
ngrok http 8080
This opens up a console view showing what URL the tunnel is available on, and also a simple history of the requests made. For example in Figure 10-6 you can see that my localhost:8080 is now available on http://29baf15.ngrok.io. With this running, I can request that URL http://29baf15.ngrok.io from another device or location, and see the code running on my local machine. Under the “HTTP Requests” section, you can see the requests that were made to this endpoint, including one that failed.
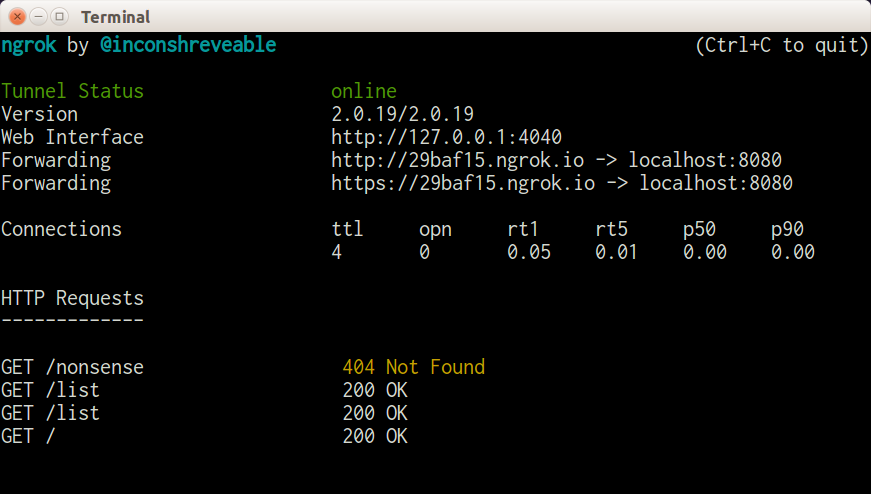
Figure 10-6. ngrok tunnel in action
When the tunnel is no longer needed, simply press Ctrl-C to stop the program and close the tunnel.
ngrok also has some additional features; notice in the screenshot of the console that there is a URL labeled “Web Interface.” This is a brilliant feature: it allows you to list, inspect in detail, and repeat any requests that came in to the tunnel—take a look at Figure 10-7 to see this in action using the same example shown on the console.
The web interface is split into two main sections with a list of requests on the left and the detail of the currently selected request on the righthand side of the page. The individual request can be inspected in many different ways; the default view shows the request and response but headers and raw formats are also available, which can be really useful when chasing an API problem. Especially magical in this view is the “Replay” button on the top righthand side of the detail view! Chapter 11 talks more about adding debugging into your application, but to be able to add logging or other diagnostics and very easily repeat a request that you know replicates a bug is incredibly helpful.
ngrok is a tool that I think every web developer, not specifically API developers, will find useful to have in their proverbial toolbox since it’s just so useful to make your local platform reachable temporarily by others. It has other features, such as being able to register custom or reserved subdomains so that you can bring up the same development endpoints at the same places every time, so it’s well worth a look.
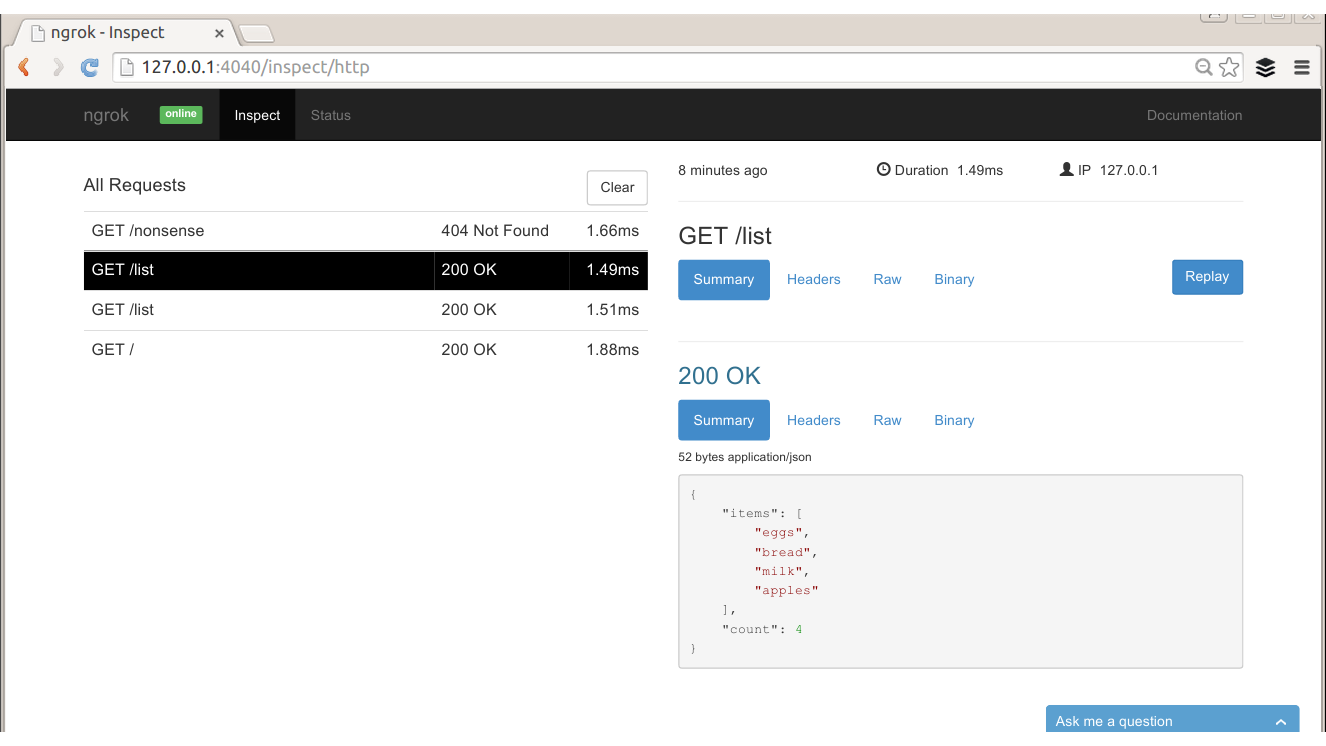
Figure 10-7. The ngrok web interface allows inspection and repeat of requests
Inspect, Edit, Repeat, and Share Requests
There are quite a few tools that provide proxy functionality and run locally on your machine, which are useful features for local API development. This section looks at two excellent tools, mitmproxy and Charles, but there are others—for example, you might want to check out Fiddler if you’re on a Windows platform.
mitmproxy is an open source Python tool that acts as a proxy. It offers easy inspection of traffic as well as the ability to replay and change requests. It’s also possible to save requests or collections of requests if you want to share a whole session, either to revisit later on or to send to colleagues or attach to an issue in an issue tracker.
mitmproxy is entirely console-based, so it’s easy to run on your development machine, or on virtual machines or other servers during development. You can see it in action in Figure 10-8.
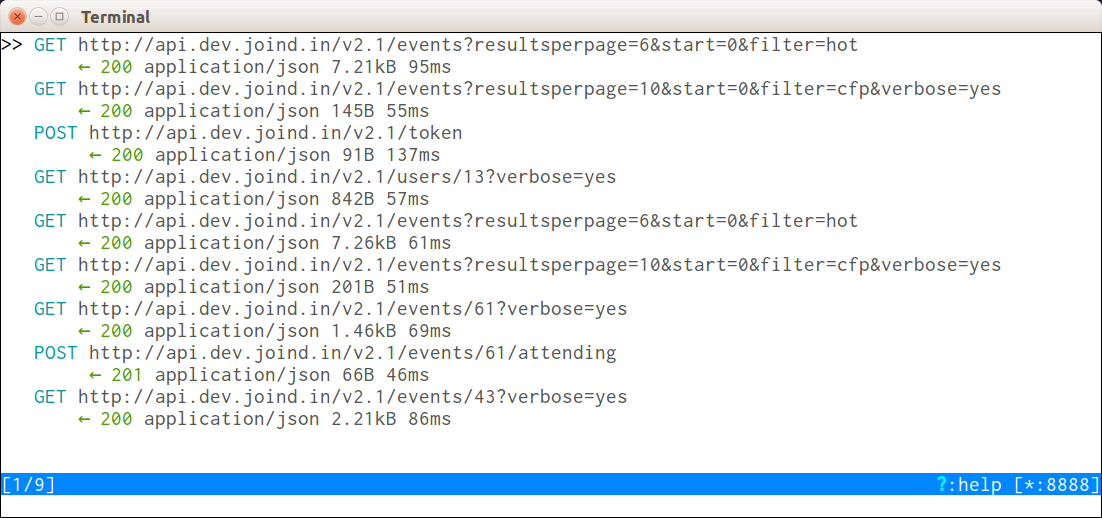
Figure 10-8. mitmproxy capturing traffic
mitmproxy is very lightweight and easy to install, and will run anywhere. The project is actively developed on GitHub.
Charles is a paid-for product (a single license is $50 at the time of writing), but it’s one that is absolutely invaluable, especially when working with mobile devices or when more advanced features are needed. Charles logs a list of requests and allows you to inspect them, similar to Wireshark, but it works in quite a different way since it is a true proxy, and requests are passed through Charles rather than the network traffic being duplicated.
Getting set up with Charles is straightforward; it automatically installs and will prompt you to install a plug-in for Firefox to enable proxying through Charles by default. If you’re working with a web page making asynchronous requests, this is an excellent setup.
For those not using Firefox, you need to ask your application to proxy through Charles. Since it’s common to have proxies in place, particularly on corporate networks, this is fairly easy to do on most devices; there are advanced settings when creating a network connection that will allow you to do this. You will need to enter the IP address of your machine, and the port number (8888 by default, but you can change it in the proxy settings in Charles) into the proxy settings fields when creating and editing the network settings. When a new device starts proxying through your machine, you’ll get an alert from Charles that lets you allow or deny access.
Once everything is up and running, click on the “Sequence” tab and you’ll see a screen similar to Figure 10-9.
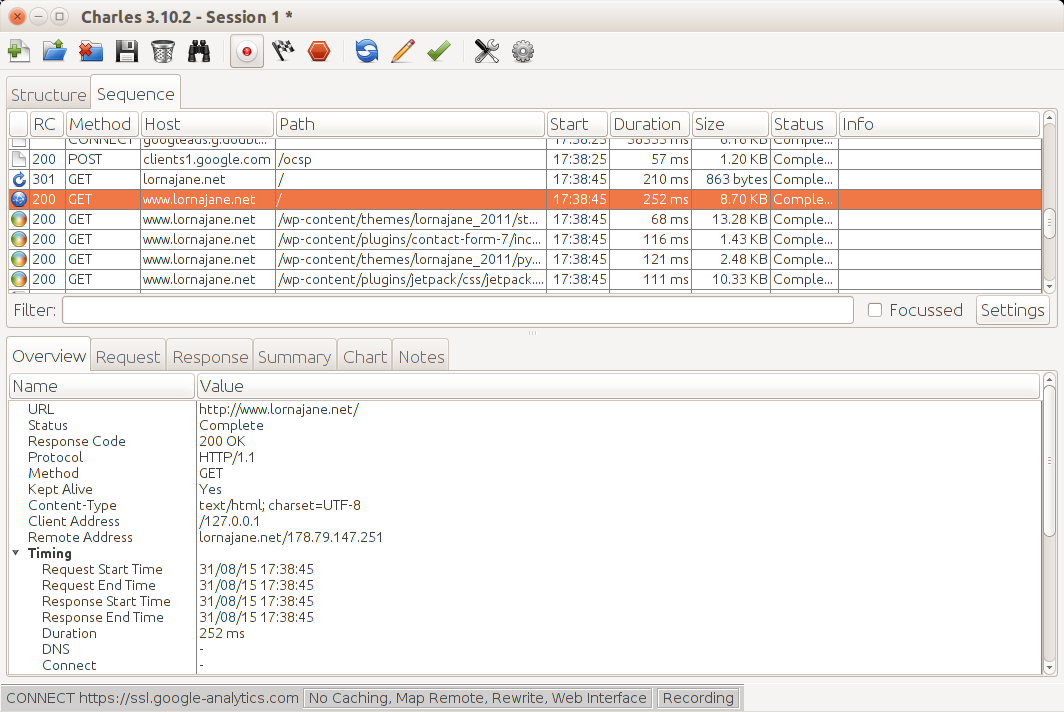
Figure 10-9. Charles showing some web requests in detail
The top part of the pane is a list of requests that came through the proxy, and when you select one of these, the detail shows in the bottom pane. This area has tabs upon tabs, making all kinds of information available for inspection. There are the headers and body of the request and response, including format-aware information on the response so if you receive JSON, XML, or HTML for example, it will be helpfully decoded and displayed as appropriate.
If there’s a particular response that allows you to observe a bug, you might like to repeat it; Charles makes this much easier than having to click around the same loop again to replicate the bug. Simply locate the request you want in the top pane, and right-click on it to see “Repeat” in the context menu. This is really helpful for debugging, especially as you can export and import sessions from Charles, so you can pass this information around between team members. If one developer is able to replicate the bug but not necessarily fix it at that moment, the session can be saved and attached to the ticket in the issue tracker for another developer to pick up at a later date. Very efficient!
Probably the nicest feature of Charles is its ability to show you SSL (Secure Socket Layer, or https) traffic without needing the private key from the server (which Wireshark requires). SSL is, by its very nature, not something than can be observed from the outside, so usually the result is something like the image in Figure 10-10.
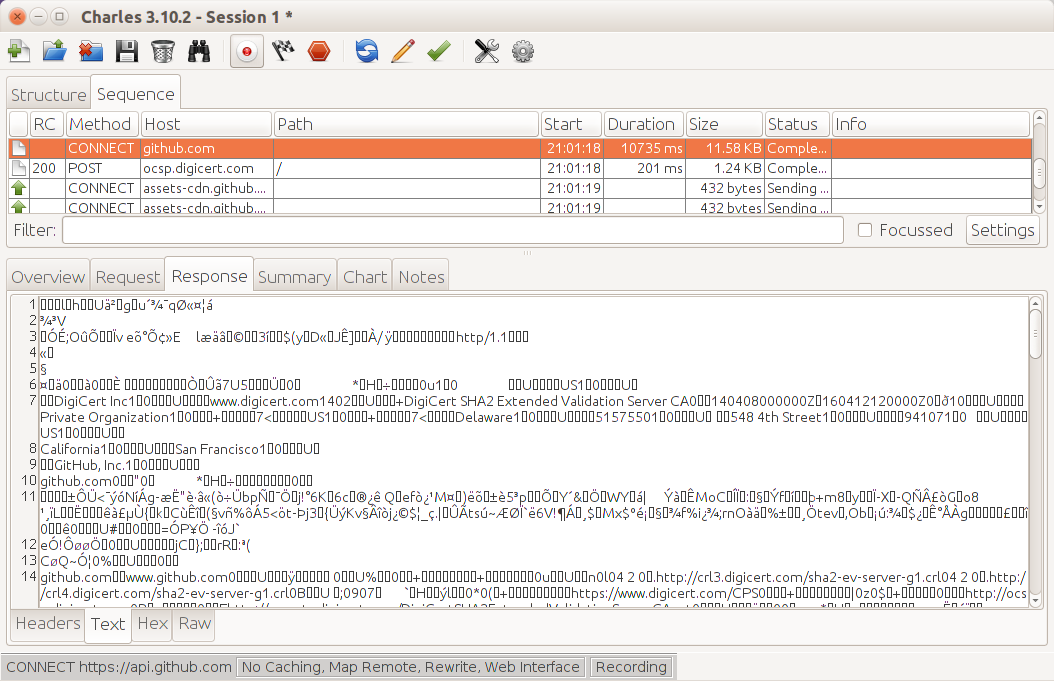
Figure 10-10. Charles showing https traffic without decrypting
Charles allows you to inspect SSL by performing a classic “man in the middle” attack. The traffic between Charles and the remote site is encrypted using the correct certificate as normal, but the traffic between Charles and your browser or other client is only signed by Charles. This means that in order to use this feature in Charles you will need to actively enable Charles’ SSL certificates (look in the “SSL” tab on the proxy settings screen) and then accept the Charles CA on the device or client that is sending the SSL traffic.
Charles offers the ability to throttle all traffic that passes through it. Throttling traffic allows you to simulate a selection of real-world network speeds, including 3G for a mobile phone. This is a key part of the development process, especially if your application and server are on a fast corporate network; the real world can look quite different! I will never forget testing games on phones in an underground car park to find out what happened when there was no reception—very glad that nowadays I can just push that traffic through Charles to test these things.
There are two similar features for rewriting requests that I use when passing traffic through Charles. The first is simply called “Rewrite”—it makes it possible to change headers or bodies of requests or responses, restrict them to specific sites, and use regexes to match and change specific elements. This can be handy for all kinds of reasons: trying out a new remote service, or testing whether a change of headers fixes a particular problem. I also use the “Map Remote” feature, which is really helpful when requests arrive at Charles needing a consistent change to their URL. This is perhaps most useful for hardcoded image URLs, but I also use it when using Charles to route a mobile app to a local version of an API rather than the official one.
Using Charles to proxy traffic from a mobile device, whether to rewrite or just to inspect it, is a very useful feature. To set it up:
-
Configure the device networking to be on the same network as Charles, and set the proxy to be the IP address of the machine running Charles and the port number it is running on (the default is 8888).
-
Either use an app on your device or the mobile browser
-
When you first set this up, Charles needs you to confirm that you want to allow this device to proxy through your machine. This is good; it means you’re not running an open proxy on your laptop
-
The traffic is visible in Charles.
While I mostly use Charles for development purposes, particularly for testing issues on mobile apps where I want to diagnose an issue but I don’t want to rebuild the app itself, it’s also pretty interesting just to set up the proxy on your device, use your favorite apps, and look at the traffic that they send.
Proxying PHP Applications
Some of these tools, such as Charles, require you to redirect your web traffic through them. We’ve seen simple examples of how to use a web browser with an add-on or a mobile device to proxy, but what about a PHP application running on your local machine or a development virtual machine? When we work with APIs often the requests are actually made by PHP itself rather than by a client, so an alternative approach is needed.
One option is simply to change the endpoint that we’re calling to such that it points to Charles, and then rewrite the request when it arrives at Charles so that it goes on to the right place. That will work, but it’s rather a blunt instrument. Instead, we can configure PHP to use proxy settings when making requests.
Proxy Settings for Guzzle
The Guzzle library, which has been used in examples throughout this book, observes a standard environment variable called HTTP_PROXY (frustratingly, command-line cURL respects the same environment variable but in lowercase). You can set the environment variable in your web server config; for example, I’m using Apache and want to proxy through Charles on my host machine which the guest sees as 10.0.2.2, so I add the following line to my vhost configuration:
SetEnv HTTP_PROXY http://10.0.2.2:8888
Remember to restart Apache after adding this to the vhost configuration, and you should start to see that requests made by Guzzle are proxied through Charles.
Proxy Settings for HTTP Stream Handling
PHP’s stream handling doesn’t observe the standard environment variable, but it is easy to add proxy settings to the stream context used. In the situation where there is already an $options variable with some settings in it, and again the code should proxy via Charles on 10.0.2.2, the following should be added:
$options['http']['proxy']="tcp://10.0.2.2:8888";$streamContext=stream_context_create($options);
Pass in this context to the stream and it will proxy requests through the address you specify. Notice that the proxy address starts with tcp:// rather than http://, a common (and very tempting) mistake.
Finding the Tool for the Job
This chapter covered a selection of tools for varying tasks, although there is some overlap, for example, in tools you can use to inspect traffic (in that particular case I usually run Wireshark immediately and then move on to Charles for more detailed debugging, as it’s more HTTP-aware but requires me to proxy my traffic through it). I strongly recommend you take the time to play with and get to know these tools and any additional or alternative ones you come across. Knowing what tools are available and how they can help you means being able to rescue yourself and your projects from a tight spot if you need to. I hope you won’t ever need to play “hero” when something goes wrong but if you do, you’ll be glad you invested some time in stocking your toolbox.