HUMANS HAVE TINKERED WITH PLANTS and animals since before the dawn of recorded history. For example, it is thought that dogs were domesticated from wild wolves about 15,000 years ago. All the crops we eat today, including wheat, rice, and corn, are the products of thousands of years of breeding for larger grains, edibility, flavor, and other desirable characteristics. In addition to the domestic dog, horses, cows, goats, and pigs were bred from their wild ancestors. Obviously, domestication was a great success, for we now have many varieties of these useful crops and animals suited for different parts of the world and used for different purposes. Yet, despite this obvious success, until about a hundred years ago we did not know how inheritance worked. Breeders could generally state that many traits appeared to be inherited. But when it came to details of that inheritance, some traits seemed to be blends of features from both parents, whereas other traits appeared to copy the trait from only one parent. Sometimes traits from grandparents not expressed in the parents reappeared. Occasionally some useful traits seemed to arise completely anew! How were breeders to make any sense of these observations?
Breeders had trouble understanding how inheritance worked because many traits represent the manifestation of many genes and can also be affected by the environment. Many traits of great interest fall into this category, such as the amount of milk produced by cows, the size of a fruit, the amount of oil in canola seeds, the color of our skin, and our propensity for high blood pressure, just to name a few. We will look into these more complex traits determined by many different genes in chapter 12.
Near the end of the nineteenth century, many plant breeders were keenly interested in how inheritance worked. They began to realize that what was needed was a systematic study of hybridization, or crossbreeding, between closely related plants possessing obvious differences in a single trait or just a few traits. Fortunately, a serendipitous choice of traits that were under the control of single genes enabled them to make sense of inheritance. Gregor Mendel was the first to figure out how inheritance worked for single-gene traits. His careful choice of plant, peas, and their character, as well as his statistical analysis of many offspring, revealed the bases of inheritance. But his discovery went unappreciated until 1900, long after his death in 1884.
Because many of the early studies of inheritance used plants, let’s take a few moments to learn a bit about plant biology and reproduction. Most plants, unlike animals, are hermaphrodites; that is, one individual possesses both male and female parts. The pollen grains are like the sperm cells of the flower. They are contained in a structure called the anther. The ovule is the female reproductive cell that is found at the base of the structure called the style. This structure is topped by a sticky part called stigma that receives the pollen. The fact that plants are hermaphrodites allows scientists to perform controlled crosses that would not be possible with animals. For example, plants can be selfed, short for self-fertilized or self-pollinated. Selfed means that the male (pollen) and female (ovule) contributions to an offspring come from the same individual. Many plants are easily selfed by enclosing the flower to prevent pollen from another individual from entering the flower that contains both the anther and stigma. In order to perform crosses between different individuals, the anther is removed from the individual that will be contributing the ovule. Pollen from the anther of a different individual is picked up with a fine brush and brushed on the stigma of the first individual. This requires a bit of practice, but, once learned, it is fairly easy to do. Also, many plants produce a lot of seeds, that is, offspring, from a single cross. The ease of controlled crosses, the production of many offspring, and relatively fast generation times make many plants ideal for the study of inheritance.
Early in the study of heredity, most scientists and breeders thought that traits of offspring were due to blending traits of the parents. After all, there were clear examples of such blending, for example, skin color, the heights of many plants, and so on. This interpretation sounded quite reasonable because male and female gametes contribute to the formation of the offspring. Nevertheless, the idea of blending inheritance could not explain many features of inheritance. One common occurrence that could not be explained by blending inheritance is a trait’s skipping generations. That is, a trait is present in the grandparent, not present in either parent, but appears in the offspring.
Crosses of parents that did not exhibit this blending feature were seized upon to try and understand inheritance of traits. That is, exceptions to the generally accepted idea of blending inheritance allowed researchers to ask why some traits did not exhibit this behavior. Edith Saunders, at Cambridge University, England, who later became the president of the Genetical Society, conducted extensive studies in the 1890s. She studied a number of different garden and alpine flowers. For example, she noted that there were two varieties of plants in the cabbage family of alpine plants. The plants are similar in all respects, except that one has hairy leaves while the other has smooth leaves. These plants grew right next to each other in the meadow. Saunders reasoned that if insects freely pollinated the flowers, and the traits shown by the offspring were a blend of parental traits, two distinct forms should not persist for long. So, Saunders brought these plants into her garden in order to experiment with them, under conditions where she could control their pollination. Saunders observed that by cross-pollinating a hairy-leafed plant with a smooth-leafed one, she obtained twenty-one hairy plants and ninety-nine smooth-leafed plants as the offspring (figure 2.1) and no plants with intermediate hairiness. In another example, she used a fragrant garden flower, called stock, that has very smooth leaves. Crossing this smooth-leafed plant with one covered in gray hair from the wild resulted in only smooth or completely hair-covered offspring and nothing in between. Saunders interpreted her results as clear examples of nonblending inheritance. The stage was set for the rediscovery of Mendel’s results.
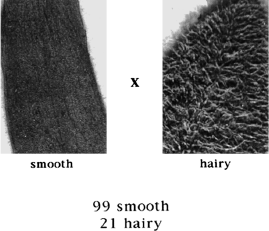
Figure 2.1 Cross Between Smooth-Leafed Plant and Hairy-Leafed Plant. When Edith Saunders crossed smooth-leafed plants with hairy-leafed plants, she obtained only smooth-leafed or hairy-leafed plants. No partially or less hairy leaves were observed. These are images photographed through the microscope illustrate the difference between hairy and smooth leaves. In a cross between these plants, Saunders obtained ninety-nine smooth-leafed plants and twenty-one hairy-leafed plants. Photos of leaves courtesy of Valerie Lynch-Holm. The plants are from the WSU Owenby Herbarium.
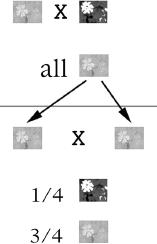
The Dutch botanist Hugo De Vries rediscovered Mendel’s work in 1900. He looked at many different flowering plants, but for each cross, he focused on only a single trait that differed between closely related plants. When De Vries crossed a plant of one type with another plant differing by only a single trait, all the resulting offspring showed the trait of one parent. For example, he crossed a red campion with a white campion. He found that the first generation seedlings all produced red flowers (figure 2.2). When he then allowed these red flowered offspring to self-pollinate, he got 73 percent red and 27 percent white, or close to a 3 to 1 ratio. He did another experiment using the same species of plants, but this time he chose varieties that differed in the hairiness of their leaves. The first generation produced all hairy plants, but a self-pollination of those hairy-leafed offspring produced 72 percent hairy-leafed and 28 percent smooth-leafed plants. Among many such experiments, he saw approximately 75 percent of one type and 25 percent of the other type: a 3 to 1 ratio. From these and other results of his experiments, using a number of different plants, he came up with the following explanations:
• Each parent provides equal genetic contribution to the offspring, so the offspring has two copies of their genetic contribution, one from the mother and the other from the father.
• When considering a single characteristic, one expression is dominant (visibly present) and the other is recessive (not visible). This is the rule of “Dominance.”
• In a plant, these characteristics are combined, but when that plant makes pollen grains or ovules, these characteristics are separated, or segregated, so that each grain of pollen and each ovule retain only one of the two characteristics. This is the rule of “Segregation.”
Figure 2.2 Cross Between Red and White Campion Flowers. The cross-pollination of a red campion with a white campion is depicted at the top. De Vries obtained all red campions from this cross. Then, he self-fertilized, or self-pollinated, these red campions with their own pollen. From this cross, shown below, he observed 25 percent white and 75 percent red campions.
By the time of the rediscovery of Mendel’s work, biologists could stain DNA and had observed that DNA was found in chromosomes. The discovery of chromosomes led to the recognition of two types of cell division. One type, called mitosis, resulted in two daughter cells that had the same number of chromosomes as the parent cell (figure 2.3). Another type of cell division was observed in the formation of gametes, eggs or ovules and sperm or pollen. In the process of making gametes, through a type of cell division, called meiosis, each pair of chromosomes is separated into different gametes. The four resultant cells each have half the number of chromosomes of the parent cell (figure 2.3). These observations of the behavior of chromosomes provide a way to explain the results of the cross of plants differing in a single character. Figure 2.3 shows the simple example of fruit fly with only four pairs of chromosomes. In contrast, humans have twenty-three pairs and peas, for example, have seven pairs of chromosomes. The fruit fly has been and is still used extensively in genetic studies. We will see examples of this use in this chapter and later in the book.
Observing the behavior of chromosomes provides a way to explain the results of crossing plants that differ in a single character. That is, in meiosis (see figure 2.3) the two copies of the chromosomes are segregated into different gametes. When a new individual is formed by the fertilization of an ovule with a pollen grain, both pollen and ovule contribute a set of chromosomes to form the new individual. This interpretation of the behavior of chromosomes during meiosis, combined with the inheritance of characteristics, can be conveniently illustrated by the use of the Punnett square, named after the biologist Reginald C. Punnett (figure 2.4). Figure 2.4.A is an example of a Punnett square showing the chromosomes of an individual. Each parent provides one set of chromosomes in each gamete, egg or sperm. These are shown at the top and left of the square. Then, in the process of making a new individual, the gametes from the parents join to form chromosome pairs in this new individual. The four boxes indicate that four types of offspring appear in equal proportions, that is, one each. Early plant breeders thus understood important features of inheritance and their physical basis without knowing about genes and DNA. Figure 2.4.B shows a Punnett square with symbols for hairy-leafed versus smooth-leafed plants, as in the experiment done by De Vries. The appearance of traits in an organism, whether hairy or smooth or red or white, is called the “phenotype.” This is in contrast to the genetic composition of the individual, called the “genotype.” By convention, capital letters indicate “dominant” characteristics and lowercase letters indicate “recessive” characteristics. The Punnett square in Figure 2.4.B shows De Vries’s first cross between a hairy-leafed parent, shown at the top, and a smooth-leafed parent, shown to the left. All the offspring have one each of H and h genes. Since we know that all the offspring have hairy leaves, the combination of H and h must result in hairy leaves. Thus H, the hairy-leaf trait, dominates over h, the smooth-leaf trait. Then, in Figure 2.4.C, these hairy-leafed offspring are allowed to self-pollinate. The Punnett square shows that the parents’ genotypes are the same since the pollen and the ovules come from the same plant and have one H and one h each. In this case we get one-quarter HH offspring, which, we know from the original hairy-leafed parent, are hairy, and we also get two-quarters or one-half Hh, which are like the hairy offspring of the first cross and the hairy parent of this cross. Finally we get one-quarter hh offspring that have smooth leaves. Thus, what is called the genotype, represented by the bold letters, the composition of genes, determines the appearance of the leaves, or the phenotype. If there is at least one dominant gene, that gene determines the phenotype. If both copies of the gene are recessive, then the trait that is determined by the recessive gene is observed in the phenotype. In other words, a recessive phenotype can only be observed if both copies of the gene are recessive. This type of analysis can be done for the red and white flowers, and one comes out again with 75 percent red and 25 percent white, or a 3 to 1 ratio.
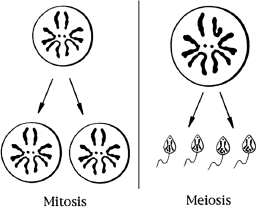
Figure 2.3 Types of Cell Division. Cells have two possible different types of division. In these examples, both begin with one cell equipped with four pairs of chromosomes. Note in this example that there are two tiny, dotlike chromosomes and three additional pairs of chromosomes. One type of division, depicted on the left, is called mitosis, in which one cell doubles the number of chromosomes and then divides them equally into two daughter cells, producing two identical cells. The second type of division is called meiosis. It is shown on the right. Meiosis produces eggs and sperm. This process also begins by doubling the number of chromosomes but then divides them into four cells, each with half the number of chromosomes of the original cell. These examples use the chromosome configuration of the female fruit fly on the left and male fruit fly on the right. Note the hook shaped Y chromosome in the male cell. The chromosomes in both are actually the same size and much smaller in relation to the cell than shown.
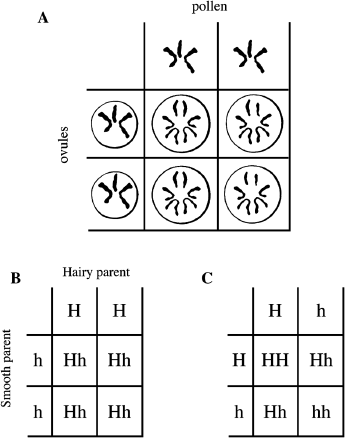
Figure 2.4 The Punnett Square. The Punnett square is a helpful way to visualize what we would expect from a cross. A. A Punnett square is illustrated using fictitious chromosomal compositions of pollen grains (top) and ovules (left). Each gamete, ovule, or pollen has three chromosomes. The four types of offspring resulting from the combination of pollen with ovules are shown in the four boxes. B. DeVries’s first cross between a hairy-leafed plant and a smooth-leafed plant. Note that all offspring are heterozygous with genotype Hh. C. The heterozygous Hh offspring from the cross in B are used as parents in this cross. Note that we expect to get 75 percent hairy and 25 percent smooth-leafed plants.
In cases of single-gene traits where two different forms of the gene exist, we end up with genotypes represented by combinations of upper- and lowercase letters. Because we encounter this situation often, let us now introduce new terms to describe genotypes more precisely. For this, we will use a final example from De Vries’s work, poppies with either a black spot or white spot at the base of the petal. As before, a cross between the two produced all black-spotted plants, showing that the black-spotted characteristic was dominant over the white-spotted one. When De Vries then allowed those black-spotted poppies to self-pollinate, he obtained 75 percent black-spotted and 25 percent white-spotted, as expected. He then saw that among the black-spotted ones, there were two types that could be distinguished by self-pollination. Of the 25 percent, he obtained all black-spotted plants upon self-pollination. With the remainder he again obtained 75 percent black and 25 percent white. These results confirmed the previous ones obtained with the hairy and smooth leaf characteristics. Individuals that carry two identical genes (for example, HH or hh) are called “homozygotes” (adjective = homozygous). Individuals that carry two different genes (for example, Hh) are called “heterozygotes” (adjective = heterozygous).
Carl Correns, another rediscoverer of Mendel’s work, wrote in 1900:
I thought I had found something new. But then I convinced myself that Abbot Gregor Mendel in Brunn, had, during the 1860’s, not only obtained the same results through extensive experiment with peas … as did De Vries and I, but also given the same explanation. (C. Correns, “G. Mendel’s Law Concerning the Behavior of Progeny of Varietal Hybrids,” reprint, Genetics 35, no. 2 (1950): 33–41.)
Correns made another important point, that not all characteristics follow the rules of dominance and segregation. Indeed, even among those plants that he and others used and that follow these rules of dominance and segregation, there were other characteristics that appeared to be a blend of the parents. So why do we discuss rules of inheritance when they do not seem to be universal? We will see that the rules of inheritance, now called Mendelian inheritance, are the simplest manifestations of heredity because they correspond to the actions of single genes. Once we fully understand this simplest form of inheritance involving single genes, we will be able to tackle more complicated forms that involve many genes (see chapter 12).
One complex type of inheritance that may appear as blending inheritance is called “incomplete dominance.” An example of this is seen in the four-o’clock plant, named so because its flowers open toward evening. This plant, like the campion, can be found in red and white varieties. However, unlike the campion, when a red flower is crossed with a white flower, we get pink flowers! This seems like a perfect example of blending. But what happens when we now self-pollinate the pinks? We might expect to get all pink flowers, since the flower colors of the parents seem to blend to form the flower colors of the progeny. Instead, we get 25 percent white, 50 percent pink, and 25 percent red. Thus, clearly this is not an example of blending inheritance. Let us analyze this result in the same way as we did the campion flowers. In that case, red-flowered offspring of crossing red flowers with white flowers could be represented by the Rr genotype. Self-pollination of these heterozygous red flowers (Rr) produced 25 percent white and 75 percent red. But we also realize that 50 percent of these red flowers were heterozygous (Rr) and 25 percent were homozygous (RR). We can understand the basis for inheritance in four-o’clock flower color if the heterozygous individuals (Rr) are pink rather than red (figure 2.5). These are pink because the dominant (R) form of the gene is weakly expressed and it takes two copies of R to get red.
Mendel and the rediscoverers of his laws of genetics were particularly fortunate in their choice of organism: plants. Indeed, in the overwhelming majority of plants, the same individual carries the pollen grains, the male gametes, and the ovules, the female gametes. Therefore, when gametes are formed, both pollen grains and ovules will have a similar genetic composition. For example, if the plant is homozygous AA or aa, all gametes will contain a copy of A or a. If the plant is an Aa heterozygote, half the pollen grains will carry an A and the other half will carry an a. This also holds true for the ovules. Such a situation very rarely occurs among animals because the two sexes are usually differentiated and the genetic composition of their gametes is harder to determine. Nevertheless, as we will see in the next section, later geneticists have taken advantage of sex differentiation in animals to further our understanding of genes and chromosomes.
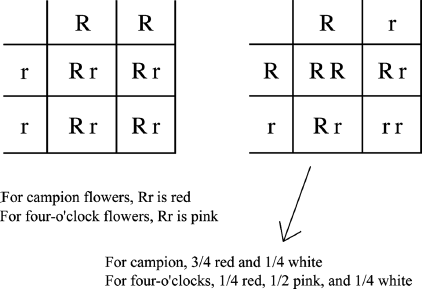
Figure 2.5 Incomplete Dominance Illustrated by the Four-o’clock Flower. We represent red flowers with RR and white flowers with rr. Offspring are all Rr. In the case of the four-o’clock flower, Rr is not red but pink. We can see that this is not a case of blending inheritance because when we self-pollinate the pink flowers, we get back one-quarter RR, which are red, onehalf Rr, which are pink, and one-quarter rr, which are white. Thus we observe 75 percent colored flowers and 25 percent white flowers, as in de Vries’s experiment with campions.
In this section we will see how the chromosome theory of inheritance was put on firm footing thanks to the study of genes located on those chromosomes that determine the sex of an individual. We will also see that, in many animals, specific chromosomes called sex chromosomes determine sex.
In 1910, Thomas Hunt Morgan of Columbia University in New York demonstrated that genes reside on chromosomes. It was known then that males and females of the fruit fly Drosophila melanogaster had different chromosomes. Fruit flies, though small, can be easily sexed by observing them under the microscope. The males have a rounded end to their abdomen while the females have a pointed end. The sexes both have three pairs of similar chromosomes, but females contained an extra pair of chromosomes called X chromosomes while males contained a single X chromosome paired with a chromosome that looked different from the X, called the Y chromosome (see figure 2.3). Thus, the Y chromosome is not found in the female fruit fly.
Fruit flies usually have red eyes, but one day Morgan spotted a white-eyed male fly in the midst of his large fly collection. Intrigued by this difference, he mated this male with normal, red-eyed females. The offspring generated all red-eyed flies. Morgan’s conclusion was that red pigmentation was dominant over white in eye color. He then did what Mendel, De Vries, and others had done before him: he allowed these first-generation flies to mate and produce a second generation (this is equivalent to self-pollination in plants). He expected to get a 3 to 1 ratio of red-eyed flies to white-eyed flies. To his surprise, Morgan observed that no white-eyed females appeared in this second generation, although red-eyed males and females as well as white-eyed males did appear. Thus there was a difference in the inheritance of the eye-color trait among males and females.
Taking this difference in the results among males and females as a cue, Morgan hypothesized that the trait was located on the sex chromosomes, which, he knew, differed between males and females. If, for example, the trait was only found on the X chromosome, we can try to explain the above result using the Punnett square. Let us designate R as the dominant gene determining red eye color and r as the recessive gene determining white eye color. The white-eyed male would be XrY, with only one copy of the recessive gene, and the red-eyed females were XRXR homozygous dominant. During meiosis, the chromosomes segregate and yield gametes that contain one Xr and one Y (for the male), or gametes containing a single XR (for the females). Note that the Y chromosome in this hypothesis carries no R or r. If we arrange these gametes as in figure 2.4, we get the Punnett square shown in Figure 2.6.A. That is, if the gene for eye color was on the X chromosome and the white-eye trait was recessive, no offspring would show a white-eye phenotype. Because red color is dominant, heterozygous females would be red eyed and males would be red eyed as well because they carry the dominant R gene only.
Then Morgan crossed these offspring with each other, that is, the red-eyed male with the heterozygous red-eyed female. Among the offspring, he obtained both red-eyed and white-eyed males, but only red-eyed females. This result can be explained using the Punnett square shown in Figure 2.6.B. That is, the red-eyed males (XRY) and heterozygous red-eyed females (XRXr) would produce both red-eyed (XRY) and white-eyed (XrY) males, but only red-eyed (XRXR and XRXr) females. To test this hypothesis of genes’ residing on sex chromosomes, Morgan mated his original white-eyed (XrY) male with the first-generation daughters, which all had red eyes (XRXr), as we saw. He used the genotypes derived from his analysis and predicted that this cross should produce red-eyed and white-eyed offspring of both sexes as shown in Figure 2.6.C. Indeed, there were equal proportions of red-eyed females, white-eyed females, white-eyed males, and red-eyed males among the offspring of this cross. Thus, the recessive white-eyed trait could, after all, exist in females. What’s more, the four categories of flies were present in roughly equal numbers in the offspring. From this, Morgan derived the following: Traits determined by genes on the X chromosome are always transmitted from mothers to sons, since, to be sons, they must get their Y chromosomes from their fathers. The single X chromosomes in males must come from their mothers. The Y chromosome does not carry the genes that are on the X chromosome, so whether the gene on the X chromosome is dominant or recessive, it cannot be masked by another copy of the gene on the Y chromosome. In males, any gene present on the X chromosome is always expressed. Indeed, in all the cases where males have two different sex chromosomes, called in this case the “heterogametic” sex (XY), and the females have two of the same sex chromosomes, that is, the “homogametic” sex (XX), fathers do not contribute an X chromosome to their male offspring; they contribute only a Y chromosome. Mothers, however, contribute X chromosomes to both sons and daughters, while fathers only transmit an X chromosome to their daughters. This is exactly what happens in humans as well.
Morgan thought that if his hypothesis was correct he could perform another cross in which he knew the genotype of the parents from the phenotype and he should be able to predict the results of the cross. This was the case with a cross involving a white-eyed female and a red-eyed male. Each of these two parents could only have one genotype, that is XrXr and XRY. Morgan predicted that he would get all red-eyed females and all white-eyed males. The result of this cross gave offspring that fully confirmed his original hypothesis. You should build a Punnett square for this cross and convince yourself that Morgan was right. Thus, in one fell swoop, Morgan demonstrated that a trait (eye color) could be associated with a chromosome (the X chromosome). In addition, we understand why sex ratios in fruit flies, and in other animals whose sex is determined by sex chromosomes, are 50 percent males and 50 percent females; the Punnett square readily demonstrates why (see also figure 2.6). Therefore, Mendelian traits do indeed reside on chromosomes, and specific chromosomes determine sex, also in a Mendelian fashion. Innumerable crosses in a large number of species have confirmed this.
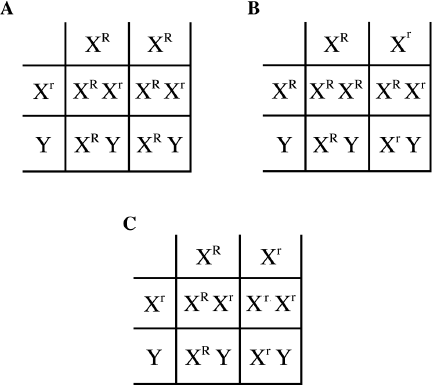
Figure 2.6 A Sex-Linked Trait Illustrated by Red (Normal) and White (Mutant) Eye Color of Fruit Flies. A. When Morgan crossed a white-eyed male with a normal red-eyed female, he got all red-eyed flies. Note that each of the four offspring has one copy of XR. B. In the next cross, Morgan crossed the red-eyed female and red-eyed male offspring from the previous cross with each other. Their progeny are red- and white-eyed males, but the females all have at least one R so are all red-eyed. C. Finally, he crossed the original white-eyed male with the red-eyed females that he produced in the first cross. This resulted in equal number of red-eyed and white-eyed females and males.
Now, not all life forms rely on sex chromosomes to determine sex. In plants, there are no sex chromosomes that differentiate male from female. In some insects and worms, females are XX and males have only one X chromosome and no Y chromosome. In birds and fishes, males are the homogametic sex, that is, they have two identical sex chromosomes, and females are the heterogametic sex, with two different sex chromosomes. However, in some reptiles, it is the incubation temperature of eggs that determines the sex of the developing embryo. Some species produce mostly females at high temperature, while at low temperature males predominate. In other species, more males are produced at intermediate temperatures and females are produced at high and low temperatures. This is due to the effect of temperature on hormone production in these animals. Thus there are a variety of ways in which Mother Nature determines sex in different organisms.
This introduction to the rules of inheritance has relied on simple cases where a trait is determined by a single gene. In this particular context, one form of the gene, the dominant form, confers an easily visible trait (phenotype) to an organism. The other form of the gene, the recessive form, only confers a different trait when it is present in a homozygote. Thus, the dominant form “masks” the recessive form in a heterozygote. We have also seen that genes reside on chromosomes and that individual organisms contain pairs of chromosomes. The mother contributes one half of the pair, and the father contributes the other half. In some organisms, such as fruit flies and humans, sex is determined by chromosomes. The segregation of sex chromosomes explains the 1 to 1 sex ratio of these organisms.


