Chapter 8
Using SNORT
Abstract
We show how to set up and use SNORT as a way of testing network intrusions. We demonstrate how to use the tool to sync signatures and apply it to security zones. Last, we demonstrate how to use visual tools like Snorby to facilitate practical use of the tool.
Keywords
SNORT
Snorby
intrusion detection
SNORT, developed in 1998 and which is now maintained by Cisco, is an industry leading Intrusion Detection System/Intrusion pretension System (IDP/IPS). The tool looks at traffic in real time and triggers a response based on patterns (SNORT rules). Snort is based on libcap, an open source tool for capturing packets. Using protocol analysis and content inspection, SNORT can detect different types of attacks in the network including Distributed Denial of Service (DDoS), buffer overflow, CGI attacks, SMB probes, and stealth port scans. When SNORT finds a pattern match in the traffic, it can perform an action. The most common action for SNORT to perform is log the event in “syslog.” In our layered zone security model, I will recommend that SNORT systems not only be deployed at the Internet facing interfaces, but also between zones. This will help improve internal security as it will help capture internal attacks directly from staff or through infected system. In addition, we will coordinate captured events to mitigate, isolate, document, and notify in the event of an attack.
The first thing we have to do is install SNORT. Now, Kali Linux has SNORT available to it, but what we need to do is build dedicated SNORT “Probes,” because we will be deploying them throughout the network. As a rule, we will want to have one probe (along with a Firewall) between zones.
There are a couple of options of deploying this configuration. For internal zone-to-zone connections, it may be acceptable to use a single high powered server to do both firewalling (IPTables) and IPS/IDS (SNORT). The next level up would be to separate firewalling and IPS/IDS into two separate servers. As a general rule, you want raw traffic to first hit the firewall, letting it take care of most attacks, then you want to pass the traffic flows through the IPS/IDP detectors for further processing, before the traffic is dumped into the next zone. Keep in mind, too, that traffic is bidirectional (which means flows both ways).
Building and IDS Appliance with SNORT
If you build your own Intrusion Detection System (IDS) using SNORT, you will not only save money but have fine tune control over the appliance. The first step we have to do is to source the appliance parts. Given that IDS can be processor intensive, the first recommendation that I have is to choose an Intel “K” series 6xxx processor. You want the core speed to be at least 3.3 GHz with a minimum of a quad core. The reason for this is that deep packet inspection (which is the process of looking at deeper layers of content within traffic) is mostly a linear operation per thread, thus the need for a very fast core. Different threads can be distributed across cores for parallel processing, thus the multicore. Furthermore, this is a case where I would build the system from parts as opposed to having a well-known PC provider build the system. I simply prefer the control of quality, and I find that even with the “Best” integrator server, some corners are cut. Now that we have the CPU locked down, you will need an LGA 1151 socket based motherboard. My personal preference is an Asus Series 9 or greater, because they have great quality and support. In addition, I am also going to recommended that you overclock the CPU core to 4.0+ GHz. The trick to this is using the right water cooled heat sink. Here, you simply cannot beat Corsair (specifically the Corsair Hydro Series H100i GTX Extreme). Again, the reason why we are driving high linear clock speed is we want the deepest packet inspection at 10G rates. Next, we need the right kind of RAM. I recommend at least 32 GB of DDR3 RAM. I recommend Corsair Vengeance Pro Series 32GB (4 × 8GB) DDR3 DRAM 2800MHz C12 Memory Kit for DDR3 Systems (CMY32GX3M4A2800C12R). Next, we will need to add a 10G NIC. Picking the right NIC is really important; therefore, I recommend the Intel EN Converged Network Adapter X520 Network adapter. This adapter has two 10G ports. We will use one port if we set up the appliance as an IDS or both ports if we set up the appliance as an Intrusion Pretension System (IPS). In addition, picking a good quality case and power supply is critical. For the power supply, I recommend a CORSAIR AXi series AX860i 860W Digital ATX12V/EPS12V SLI Ready CrossFire Ready power supply. In addition, you will want to make sure the appliance is connected to an uninterrupted Power Supply. Here, I recommend an APC Back-UPS Pro 1500 UPS, 865 Watt, Lead acid based UPS. In our system, we will have three Ethernet interfaces, eth0 will be the NIC on the motherboard, we will use this NIC for management. This NIC should be connected to a secure zone. We will only do management through this NIC, never through the traffic NIC. Eth1 and Eth2 will be out Intel NICs. If you are using the system as a IDS, you will want to configure a bidirectional SPAN port on the switch connecting the trusted side of the firewall to the LAN. If you are using the system as an IPS, you will want to pass traffic from the firewall, into Eth1 than Eth2 to the LAN switch.
Once you have the system build, you will need to configure the core OS. For this, we will be using CentOS 7 x64 or higher (https://www.centos.org/). Download the ISO and place it on a USB stick or burn it to a DVD and boot off that device. You will be prompted for a user name and password. Use our standard strong username and password scheme as previously described to give the appliance a root account. Now, go ahead and install CentOS with the default setting. Once the system is finished installing, go ahead and reboot the system and log in. Now is a good time to change the system settings to your preferences, such as the windows manager settings, Shell column and width size and background colors, fonts, etc. Next, we will need to set an IP for our Eth0 interface.
Type

Now add the lines (changing the IP, netmask, gateway, and DNS to yours):
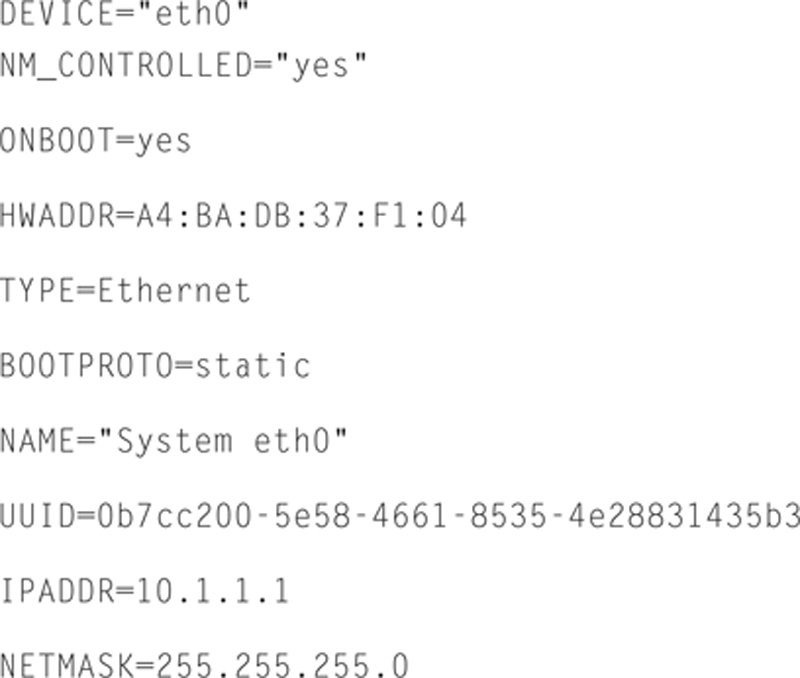
Note that the UUID is just a unique identifier, and must be unique in your entire enterprise. Here is a good site to generate a UUID (https://www.uuidgenerator.net/). Now save this file and exit VI.
Now, we need to reconfigure the default gateway, so type

Then type (changing the gateway accordingly)
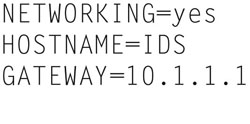
Now save and Exit.
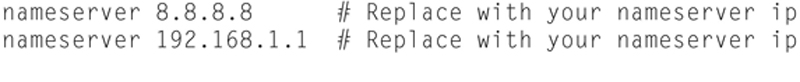
And, we must also change DNS, so type

And type
Finally, we need to restart networking. Type the following:

You can now test your networking by attempting to install Google Chrome Web Browser. To do this, do the following:
Type the following:

and add the following line:
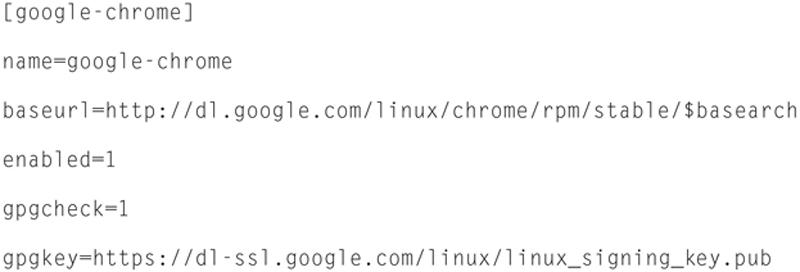
Now save and exit nano.
Next, we need to check availability from Google, so type the following:

You should see version 43 or higher available. Now, we need to install dependencies, so type

Chrome is not normally available, but Richard LLoyd (http://chrome.richardlloyd.org.uk/) wrote a nice install script.
Now, type

Now we need to set permissions, so type

Finally, we will run the installer, so type

Once done, we can launch Chrome by typing

and we will see
Now that we have installed Chrome, obviously networking and DNS are working. We will now improve the kernel and optimize it for SNORT. The first step is we need to update CentOS with the latest patches. To do this, launch a terminal window by clicking in Applications (System Tool bar) > Favorites > Terminal. From here, type the following command to update the system:

Enter your root password and press enter. This will update system service, drivers, app, etc. Later we will build a bash script to update both the system and the SNORT signatures, but we need to do it manually for now (Fig. 8.1).
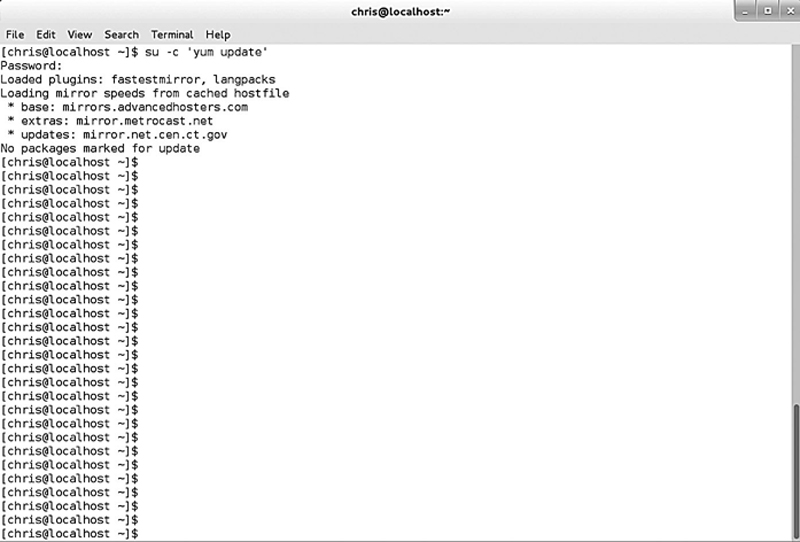
Figure 8.1 Updating the System with the Yum Utility.
Now, since we are using the Intel x540 based NIC, we want to make sure we have the most up to date drivers installed. To do this we need to grab the prerequisites, and type in the following:

Then type

Now you will need to go to http://sourceforge.net/projects/e1000/files/ixgbe%20stable/ to find out the latest stable version of the driver. Once you have this, enter

Replace 3.23.2 with the most stable version of the driver.
You will need to “make” the driver, so type
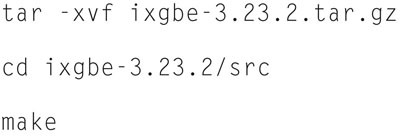
Again, replace 3.23.2 with the most stable version number. If successful, the compiled driver (ixgbe.ko) will be found in the current directory. You can check information about the drive by typing

Now, we need to load the driver. Type in the following:

Now we need to insert the driver into the kernel by typing
sudo insmod ./ixgbe.ko FdirPballoc=3 RSS=16
Finally, check the status by typing:

Now, type

Note the driver will be placed in the following location: /lib/modules/ < kernel-version > /kernel/drivers/net/ixgbe.
The driver will load automatically on next boot. Optionally, you can load the driver at runtime by typing

Now, reboot and relogin to CentOS by typing

Installing SNORT
Now that we have the system ready to go for installing SNORT, log back in to the appliance and open up a terminal window. We first need to install the Data Acquisition Library (DAQ), so type the following:

Note: Goto “https://www.Snort.org/” to check for latest versions and replace the version number.
When asked if “This is OK,” say “y” and press enter.
You should see the following when DAQ is properly installed (Fig. 8.2):
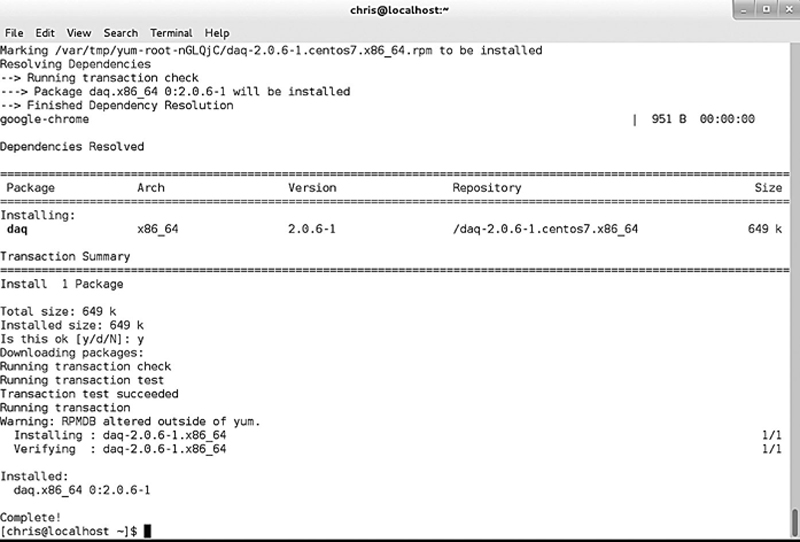
Figure 8.2 Example of a Patch.
Now we need to install SNORT by typing the following:

Note: Goto “https://www.Snort.org/” to check for latest versions and replace the version number.
When asked if “This is OK,” say “y” and press enter.
You should see the following when SNORT is properly installed (Fig. 8.3):
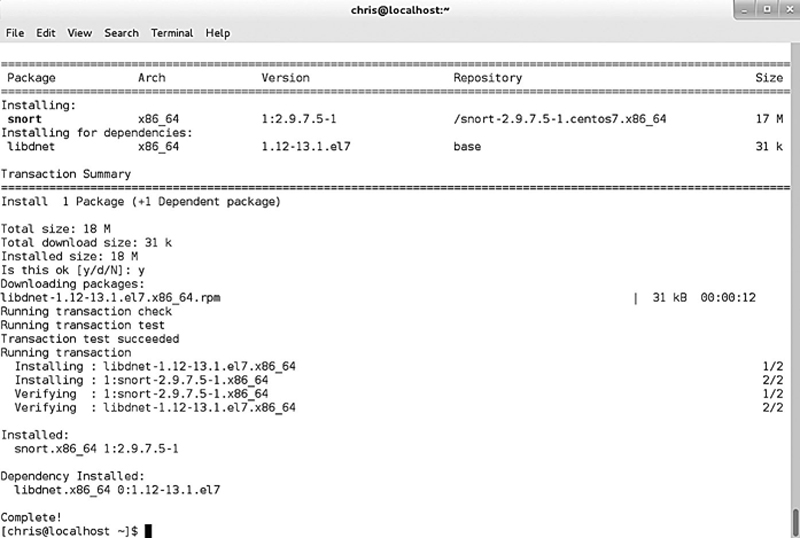
Figure 8.3 The Yum Utility Checking for Dependencies.
Snort is now installed, next you need to sign up for an Oikcode. To sign up, go to https://www.Snort.org/users/sign_in and click “signup”
Go back and login (after you confirm your email address). Where you see your email address in the upper right hand corer, click to see your account preferences, click on “Oinkcode.” Here you will see your code, copy that code and keep it.
Now, let us begin by download the “Community” rule base. In a terminal window, type

You will then see the following (Fig. 8.4):
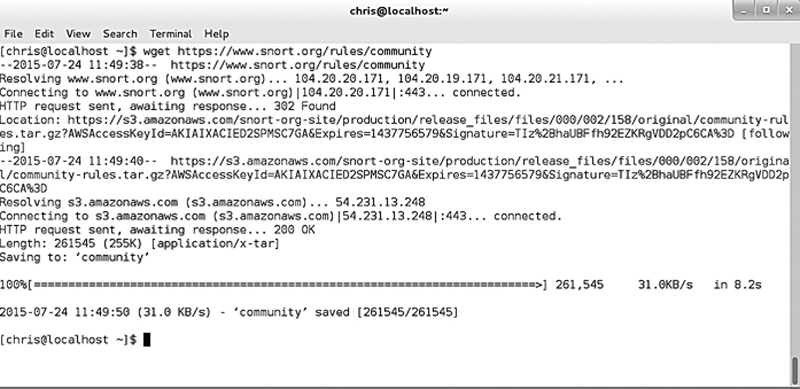
Figure 8.4 The Patching Process Completed.
Now type
sudo tar -xvf community -C /etc/Snort/rules
Now you will want to get registered rules, to do this make sure you have your version of Snort and your “Oinkcode” ready. Type

Replace the version number and “xxxxx” with your code.
Now we need to install the rules, so type

Note: Replace the version number and “xxx” with your Oinkcode.
So now the rules are installed.
Building and Update Script to Update the System and SNORT
It is useful to build a shell script that will update everything, we can crontab the script and have it automatically run. Let us begin by building an “update_all.sh” script.
Type
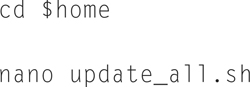
Now add the following script:
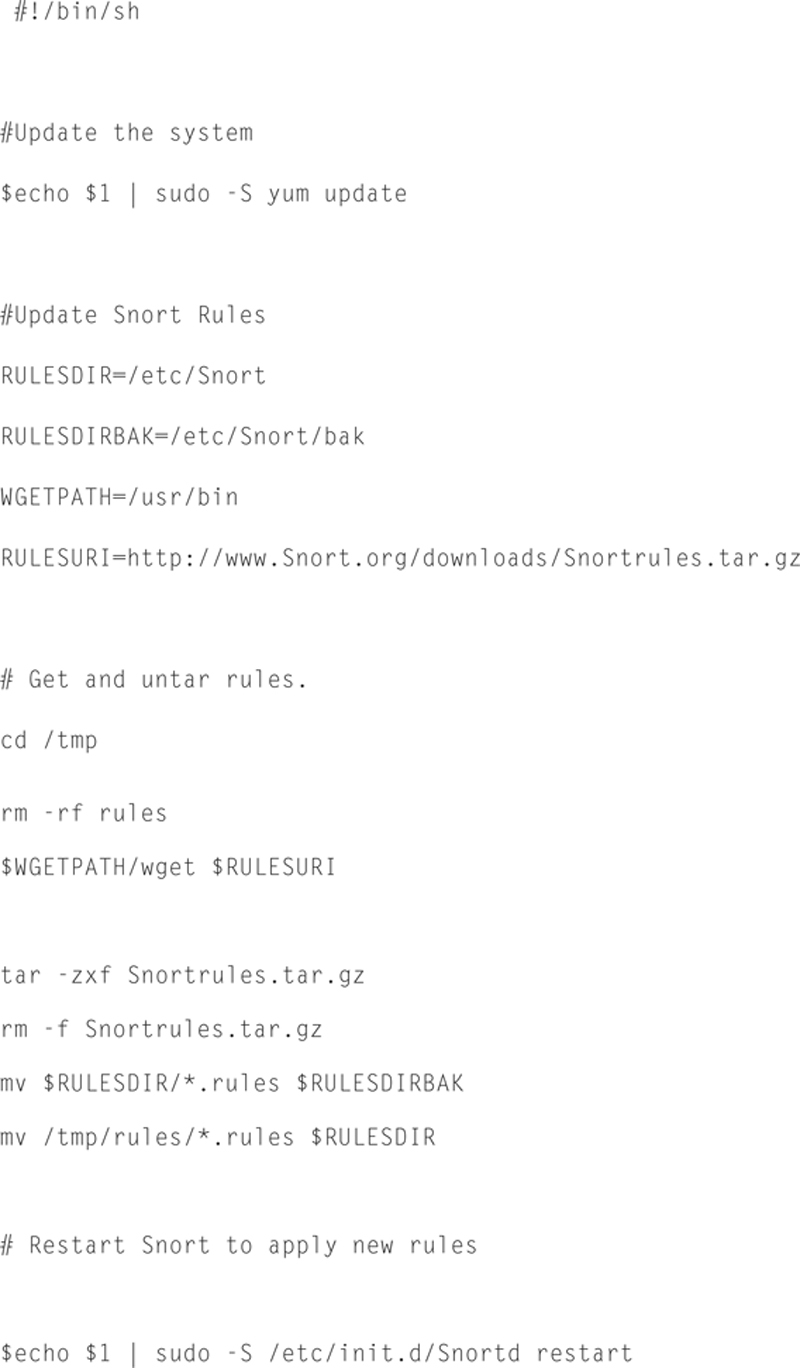
Now save the file. We now need to make the shell script encrypted and runnable, so type

Note: CentOS will not have shc installed by default, this link: (http://bugcy013.blogspot.com/2011/07/converting-shell-scripts-into-binary.html) will describe how to install it.
When you run your shell script, you will get a file called “update_all.sh.x,” which should be an executable. You will just need to, in addition, set some flags:

Now, when you run the script, you need to pass in your root password as a command line argument. I recommend creating a “run_update.sh” script that calls update_all.sh with the root password. Now, this is a choice if you want to do it this way, you can always just manually update by running update_all.sh, but if you do create “run_update.sh” (after making it runnable) you can schedule it with crontab.
I recommend making run_update.sh also executable using the previous procedure. This way you are passing in the root password, but in an encrypted fashion. Obviously, you will need to modify this file whenever you rotate passwords.
To run “run_update.sh” periodically and automatically, type the following:

This will bring up a VI like shell, you will want to add the following line:
0 3 * * * /home/user/run_update.sh.x
Note: change “user” to your actual user account.
Save changes by issuing a “:wq!”, this will run the update script at 3AM every day. There is no need to restart after modifying a crontab. If running the script manually, you should run it at least once per week at a minimum. This way you will always have a current patch OS as well as the most up to date SNORT definitions.
Configuring and Using SNORT
Now that we have SNORT installed and updated, we need to understand how to use it for Intrusion Detection. SNORT may be configured for three possible modes.
Sniffer Mode
In this mode, SNORT will grab packets from the interface and output them on STDOUT (normally the screen)
Packet Logger Mode
This mode will log the packets to the disk
NDIS (Network Intrusion Detection System)
Using SNORT as network intrusion detection system will be our primary use case. Further, we will use SNORT in sniffer mode, which is the simplest mode of SNORT. By changing your directory (or append your Unix shell path) to:

the first thing you will want to do is configure the snort.conf file. If you type the following:

under the set network variables section, you want to find the “ipvar HOME_NET xxxx” and set the network number for the protected network.
Now, you want to change the External network, so change “ipvar EXTERNAL_NET any” to “IPvar EXTERNAL_NET !$HOME_NET.” This will make the untrusted side anything other than the protected network. Save the file and then exit.
Next, let us go into super user mode, type

and authenticate your root password, now change directories to /etc/snort, and type

This will capture relatively simple dump of packets, now you can process the packets a little more using the following command:

Note that pressing CTRL -<C> will exit snort capture session.
Packet Logging mode allows to log packets to disk. To run this, type the following:
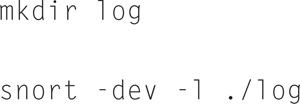
Now when you are done capturing traffic, press <CTRL > -C and change directory to ./log and do a listing, you will notice a log file is created.
Now, if you want to use the captured packets in TCPDUMP, use the “-b” flag, thus type

You can now use the captured traffic in TCPDUMP or open it up in Wireshark. In addition, if you want to tell snort the local network, you can use the “-h 192.168.1.0/24” flag (changing the network number and mask of course to fit your network). Also, if you want to dump a log back to the screen, you can use the “./snort -dv -r {file}” where {file} name is replaced with the log file name. Lastly, if you want to search for specific packet types, you can specify that on the command lien argument such as

This will show all TCP packets in the capture.
Configuring Intrusion Detection Mode
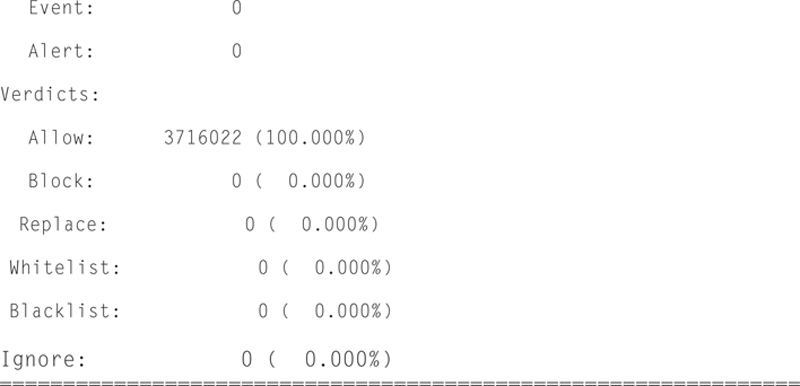
The general format to launch snort in IDS mode is

Here the results will be logged to the ./log directory, the local net will be specified using the “-h” flag, and the rules, as set by the “-c snort.conf” file, will compare against traffic to make IDS decisions. Note, if you do not specify an output directory, the default will be /var/log/snort. In addition, it is recommend not to use the “-v” switch when not debugging, writing output to the screen is very costly.
There are some additional flags you may wish to consider using. Here is a list of some of the relevant flags:
-A fast
This fast alert mode will favor writing a simple alert to the log versus deep inspection. This is purely for saving time and quickly starting the alert process
-A full
This is the default behavior, and upon a trigger event, full rule logging will occur. I recommend keeping this mode, since the appliance recommend is pretty powerful to begin with.
-A none
This turns off all alerting, I strongly discourage you from use of this mode.
-b
This option saves the event as a TCPDUMP capable binary. I recommend using this because the default ASCII is not very useful. If you can capture the event in Wireshark, you can do quick analysis of the event using visual tools that are built in.
You should also know that any command line argument will temporarily override the snort.conf file settings.
Since we already have SYSLOG setup in the network, it is very useful to be able to time correlate attacks to other events. To send alerts to SYSLOG, in the snort.conf file, set the LOG_ALERT and LOG_AUTHPRIV to the central SYSLOG server and use the “-s” flag on the command line to log.
Capturing Packets with DAQ
The DAQ library is a flexible underlay library that may be used in conjunction with Snort to capture packets. We should turn receive offload off on the NIC. Depending upon your NIC, one, none, or both interfaces may need to be set.
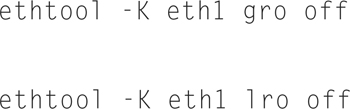
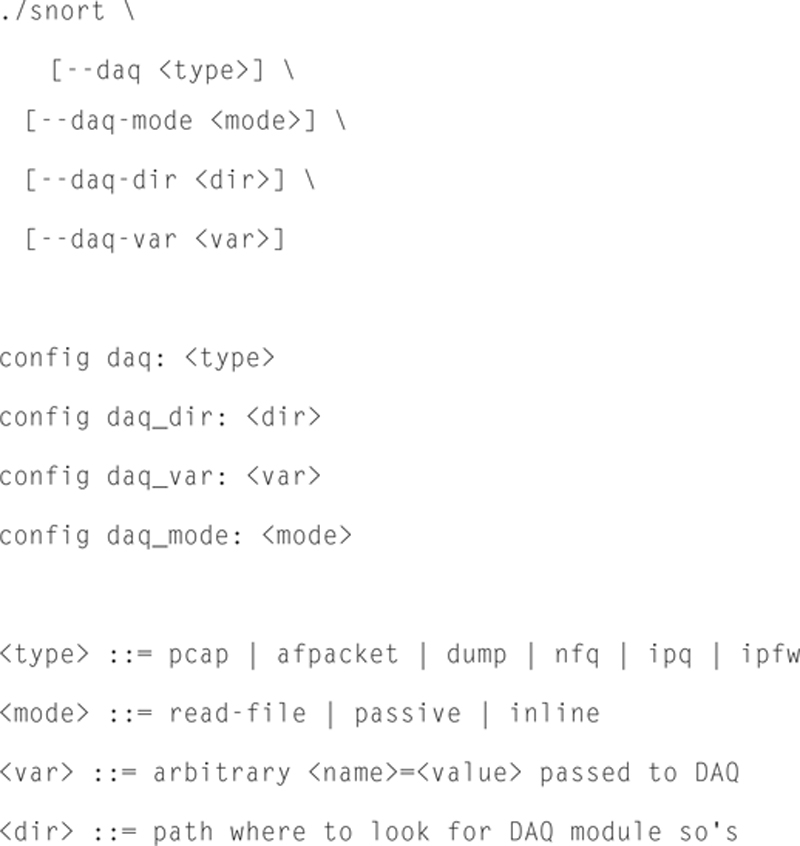
This assumes tat eth1 is the Snort sensor port. Here are the command line options according to snort.org:
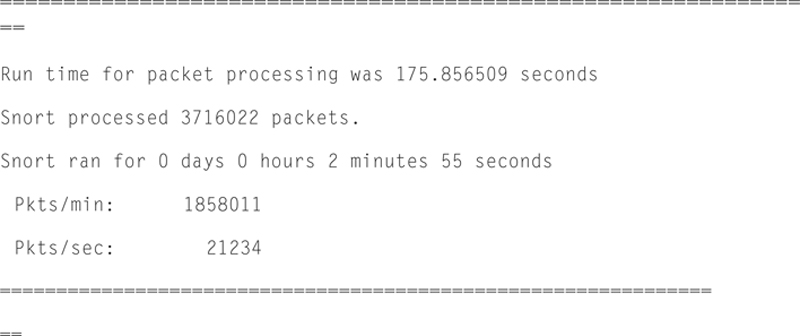
Snort Basic Output
Snort will give you some basic output when the traffic on the measured interface is nonzero. For example, here is a following packet rate message given by Snort:
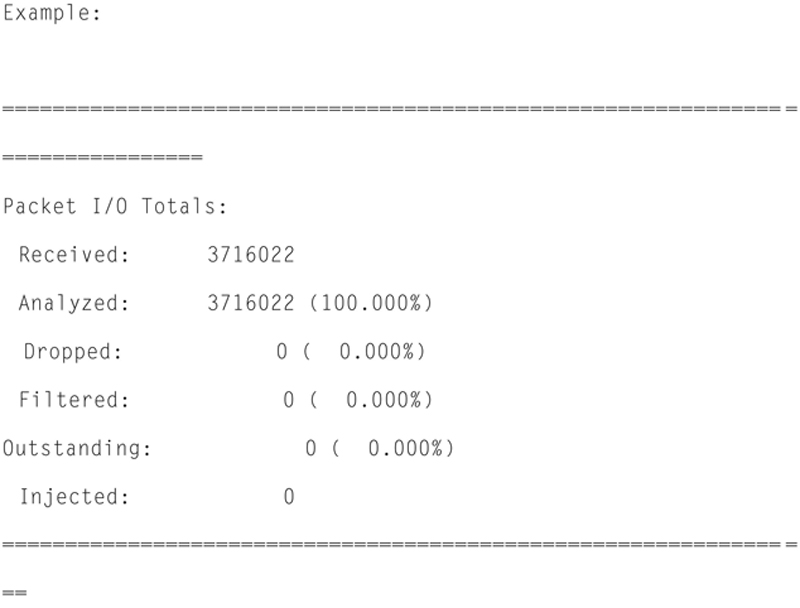
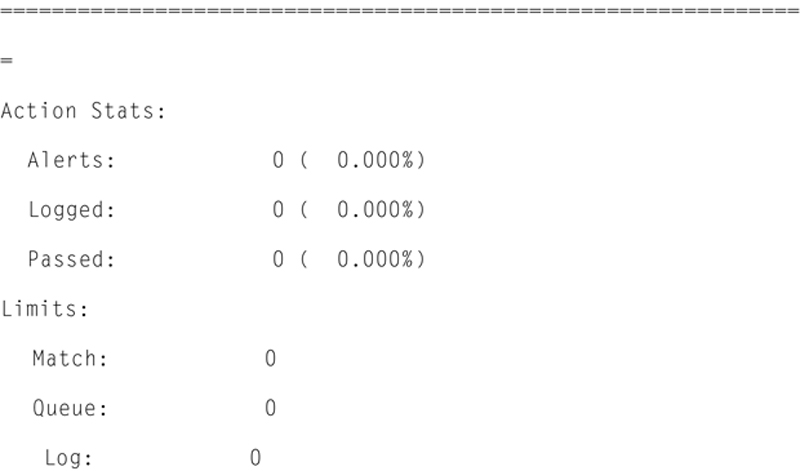
In addition, Snort will give you Packet I/O totals and per protocol totals. For example:
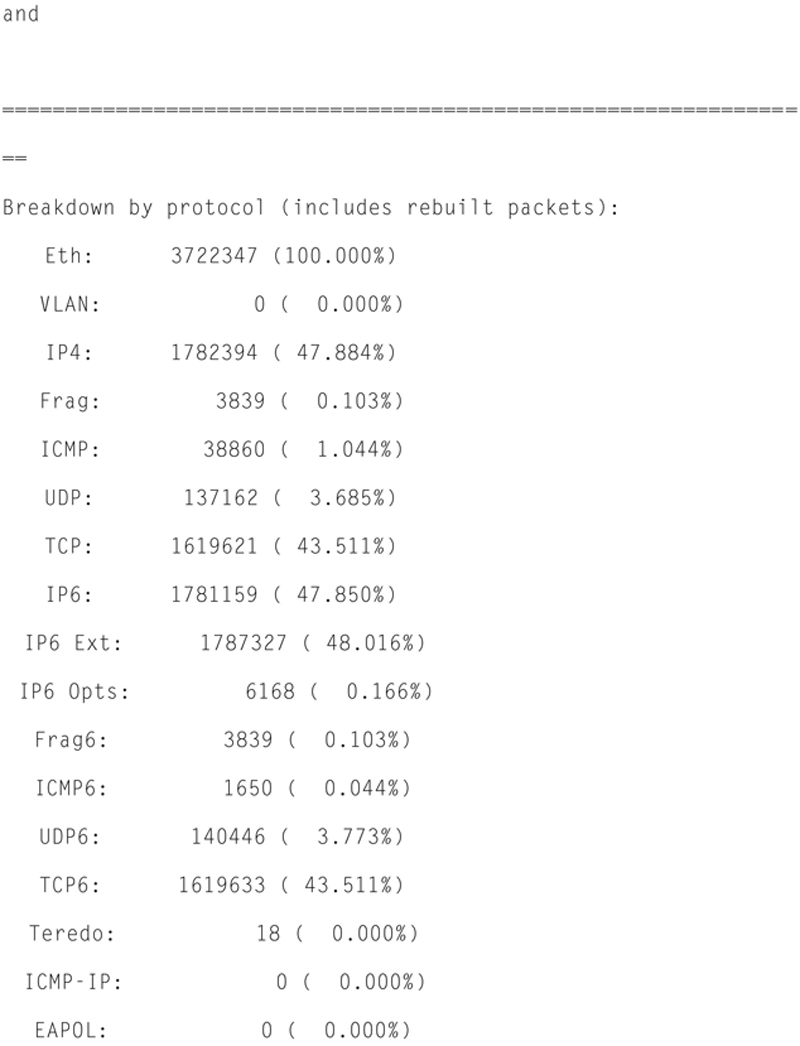
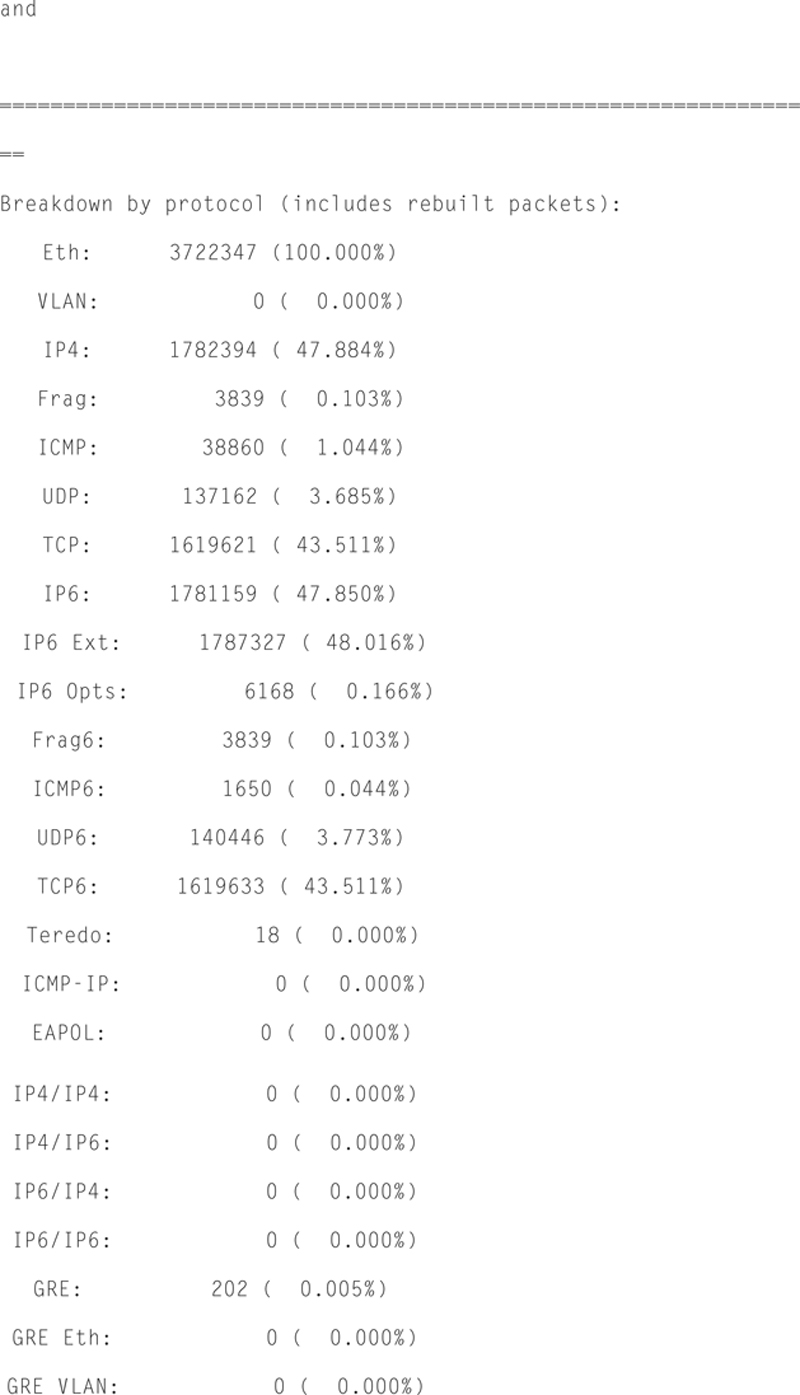
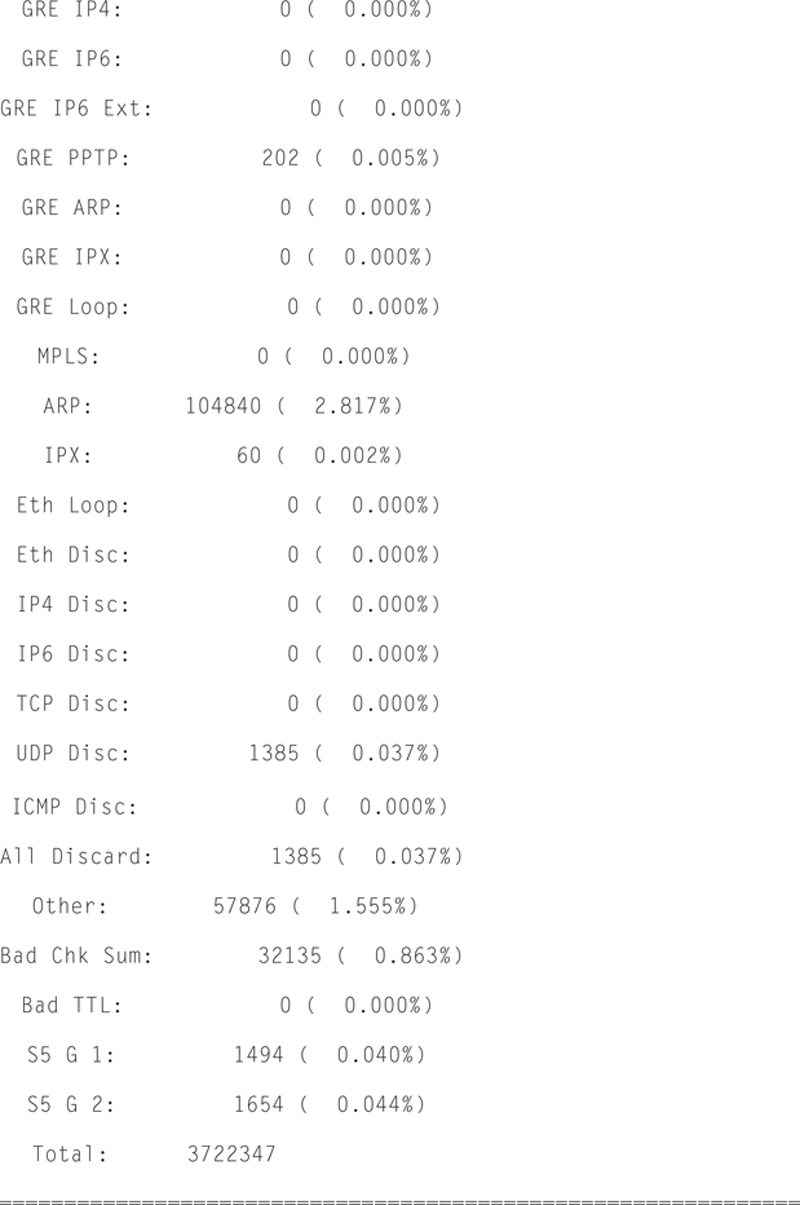
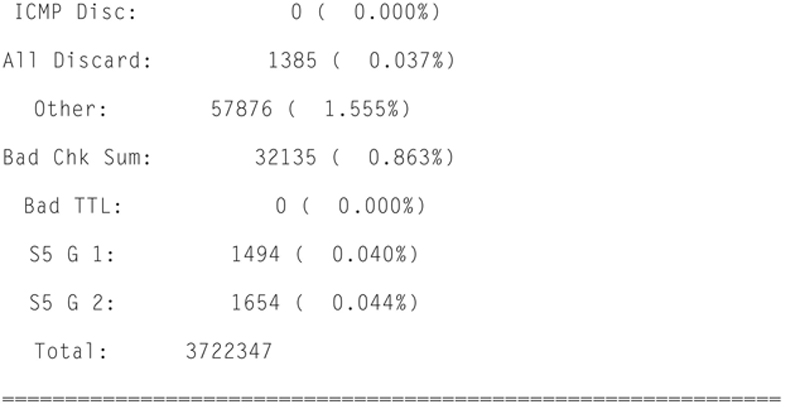
Actions, Limits, and Verdicts
Based on the snort.conf rule set, snort can make decisions and warning. Limits are alerts when a system or configuration resource is met, such as the match limit or queue depth limit being reached.
A verdict is a ruling from Snort per packet. According to Snort.org, the following verdict states exist:
Allow = packets Snort analyzed and did not take action on.
Block = packets Snort did not forward, for example, due to a block rule. “Block” is used instead of “Drop” to avoid confusion between dropped packets (those Snort did not actually see) and blocked packets (those Snort did not allow to pass).
Replace = packets Snort modified, for example, due to normalization or replace rules. This can only happen in inline mode with a compatible DAQ.
Whitelist = packets that caused Snort to allow a flow to pass w/o inspection by any analysis program. Like blacklist, this is done by the DAQ or by Snort on subsequent packets.
Blacklist = packets that caused Snort to block a flow from passing. This is the case when a block TCP rule fires. If the DAQ supports this in hardware, no further packets will be seen by Snort for that session. If not, snort will block each packet and this count will be higher.
Ignore = packets that caused Snort to allow a flow to pass w/o inspection by this instance of Snort. Like blacklist, this is done by the DAQ or by Snort on subsequent packets.
Int Blklst = packets that are GTP, Teredo, 6in4 or 4in6 encapsulated that are being blocked. These packets could get the Blacklist verdict if config tunnel_verdicts was set for the given protocol. Note that these counts are output only if nonzero. Also, this count is incremented on the first packet in the flow that alerts. The alerting packet and all following packets on the flow will be counted under Block.
Int Whtlst = packets that are GTP, Teredo, 6in4 or 4in6 encapsulated that are being allowed. These packets could get the Whitelist verdict if config tunnel_verdicts was set for the given protocol. Note that these counts are output only if nonzero. Also, this count is incremented for all packets on the flow starting with the alerting packet.
Example:
Running Snort as a Daemon
You can run Snort as a daemon, to do this you just need to use the “-D” flag. For example,
Note: relative paths are not supported when running this as a daemon.
Configuring snort.conf File
When it comes down to it, the real power in snort IDS mode comes from how you configure snort.conf, the main configuration file for Snort. According to an article written by Refeeq Ur Rehman (http://www.informit.com/articles/article.aspx?p=101171&seqNum=7), the configuration file is read in by Snort on launch using the “-c snort.conf” flag. Furthermore, when you make changes to the config file, you need to restart the Snort service to commit the change. You can also modify the .snortrc file in your home directory, but this is not common. It is also possible to launch different Snort instances monitoring different NICs if you call a configuration file using the “-c” flag.
The config file is broken up into six sections
Variable Definitions
In this section you can “set” variables that are used throughout the config file. These include networks, paths, and files.
Configuration Parameters
This section allows you to set options.
Preprocessor Configurations
A Preprocessor is a packet transform that “Pre Processes” data before it is passed into the main Snort detection engine. Example of this may be to reassemble IP fragments, or deconstruct intentional evasions.
Output Module Configuration
This section tells Snort how to log data.
Custom Actions
Allows you to build your own actions to call on the occurrence of an event.
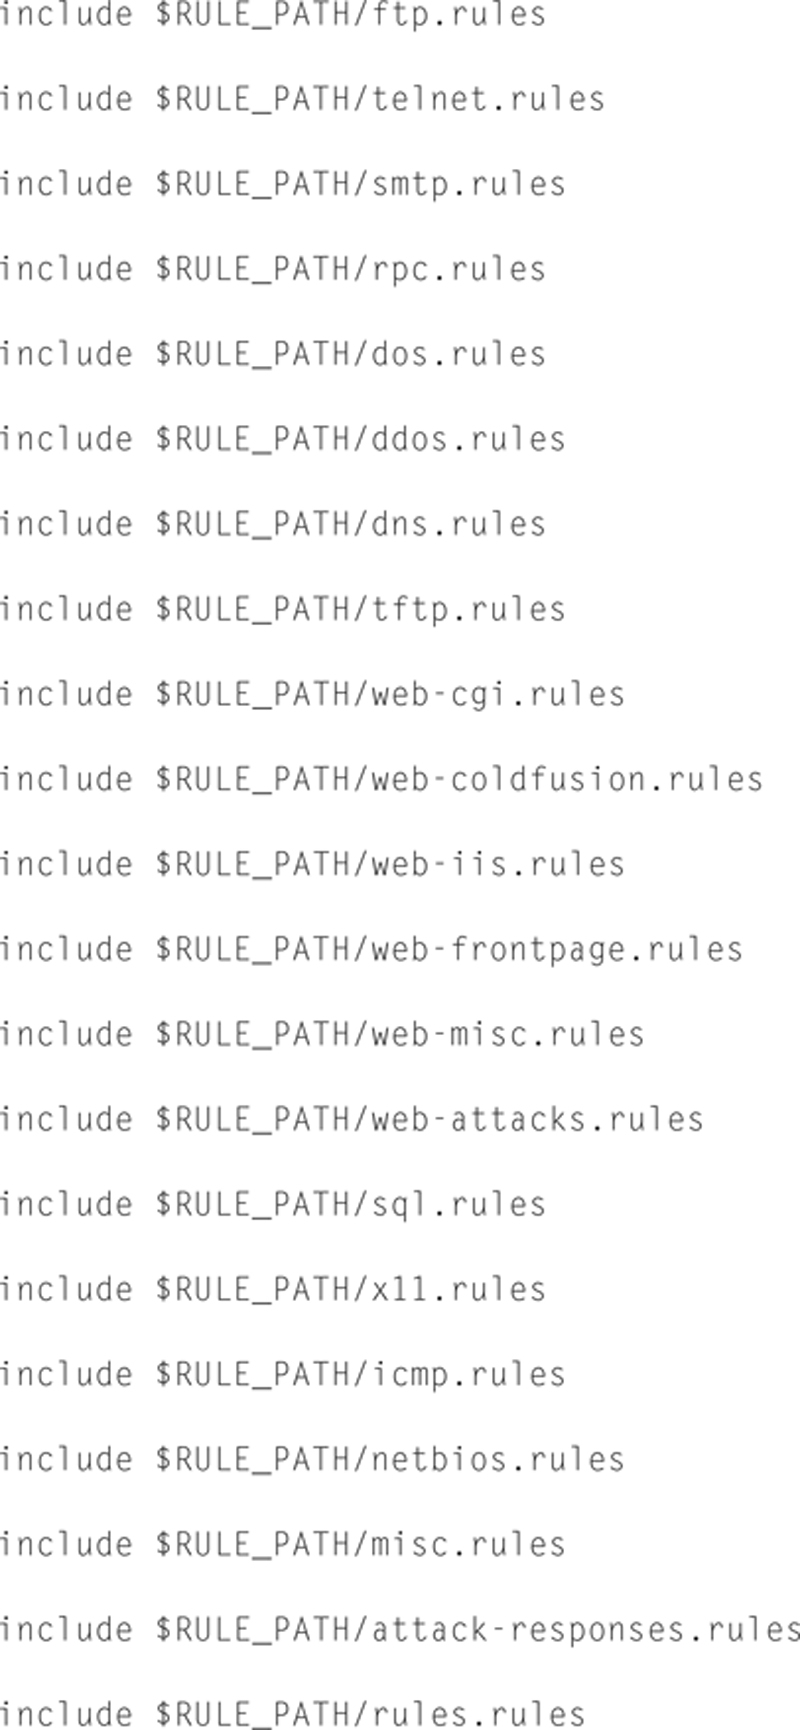
Include Files
This allows you to link in custom rule files.
In the variable definition section you can “set” global scope variables. The format for a variable set is the following:

For example,

would place the network “10.1.0.0/24” and set the value inside HOME_NET. Note that convention is that variables are upper case for later readability and detection.
When using a variable, prepend the variable name with a “$,”thus “$HOME_NET” would resolve to “10.1.0.0/24.”
Variables are convenient because you can change a value at the top of the configuration file and it is reflected globally.
Variables may also be lists. A list is separated by a “,” blocked by “[’ and ’].” Thus, to set a variable as a list, issue the following example:

On Linux, some OS system variables may be used. For example,

will take the Eth0 IP address from the OS and place it in HOME_NET variable.
Snort also has a wildcard “any” variable, useful when testing, so if you set EXTERNAL_NET in the following way:

any value becomes valid.
Another useful trick is to use the “!” operator. For example,
var HOME_NET 10.1.0.0/24
var EXTERNAL_NET !$HOME_NET
will set EXTERNAL _NET to all possible sources, excluding the internal network.
The next section is the config directives. This section allows the user to set many possible general settings in Snort. The general format for setting a Directive i:

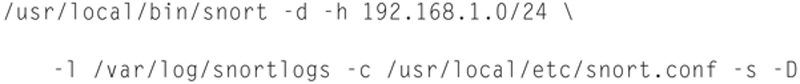
Many directives have command line flag equivalents. The entire set of available directives is
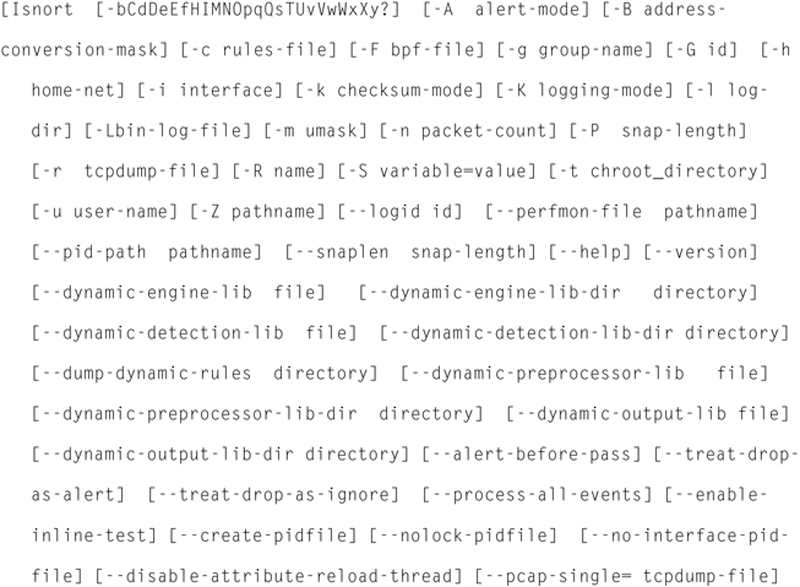
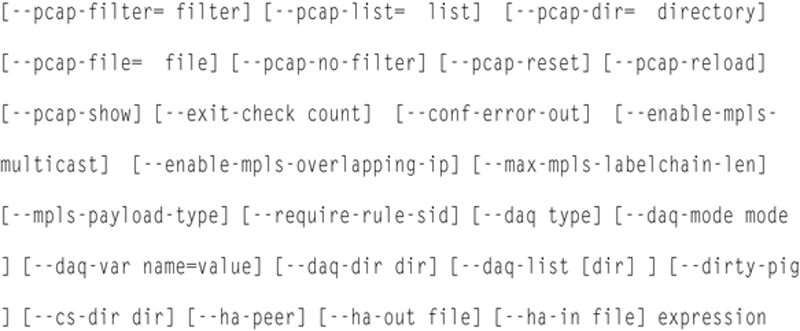
To get a list of available options, go to a terminal window and type:

The next section deals with preprocessors. There is a tradeoff when using more preprocessors. First, the more preprocessors you use the more processing power is needed, since all preprocessors are recursively processed. This can slow down analysis. The flip side is the more preprocessors you have configured, the more accurate the scanning of traffic to detect threats and attacks.
The general format for declaring a preprocessor is

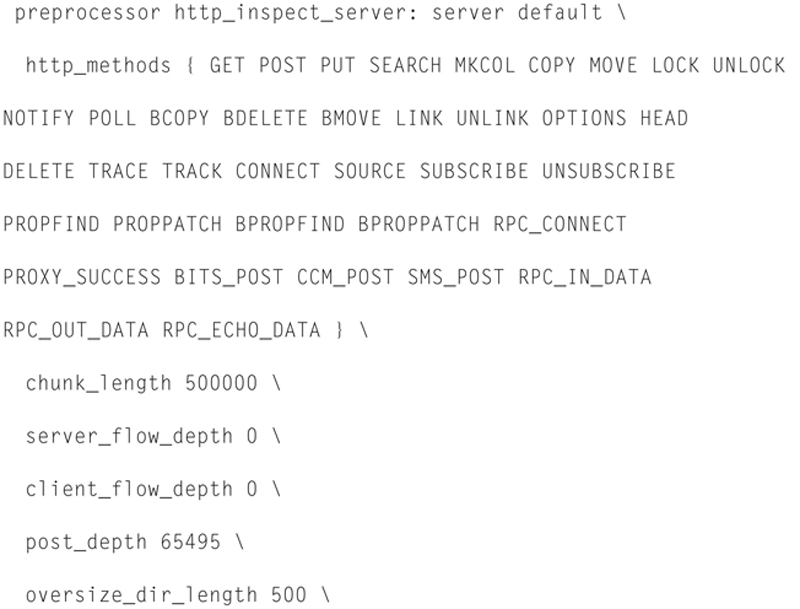
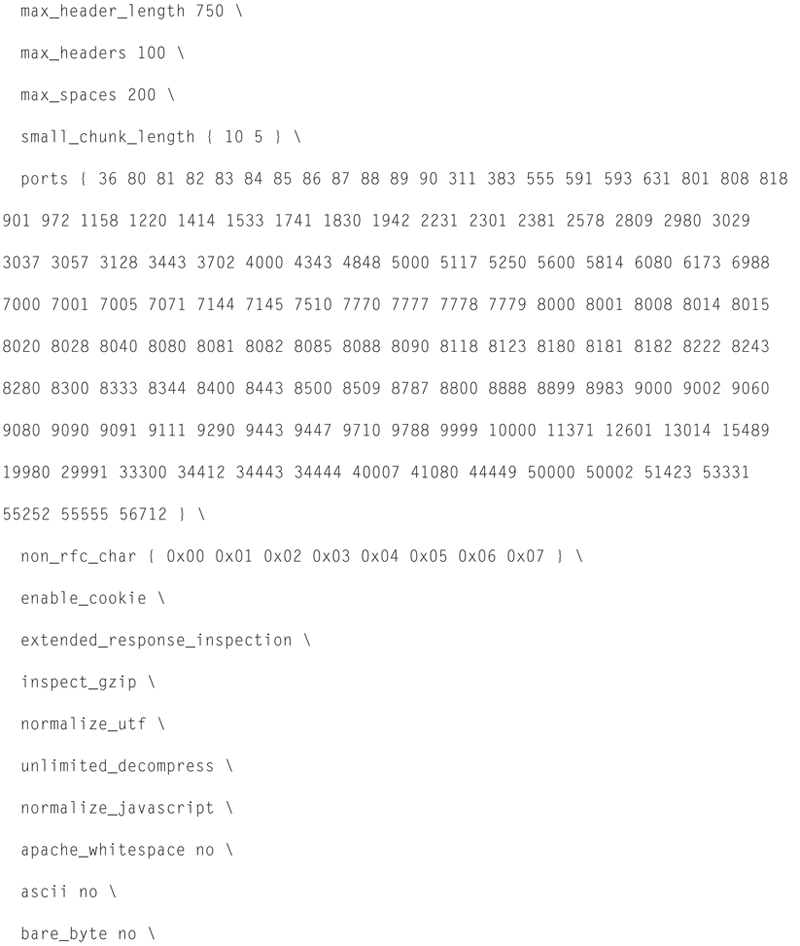
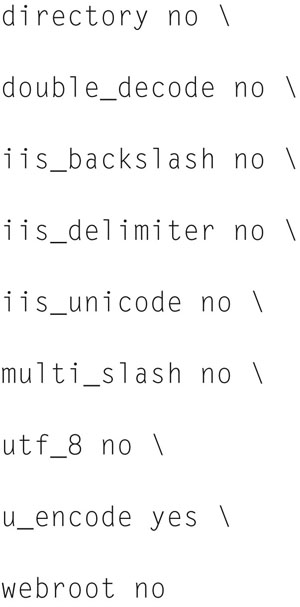
The <preprocessor name> is either a well-known built-in preprocessor such as “frag2” or “stream4” or user defined. The preprocessor can also have arguments, possible multiple arguments separate by a comma. There are hundreds of possible preprocessors available. A good source of available preprocessors and their arguments is here (http://books.gigatux.nl/mirror/snortids/0596006616/snortids-CHP-5-SECT-3.html). One other side note, if a line in snort.conf is too long, standard rules apply as in coding that a ’\’ character will glue the current and previous lien together. This allows you to have better readability since a “line” is separated by a carriage return character.
So, for example, here is a single preprocessor “line” in the config
The next section is the Output Module Configuration. This system allows you to “plug-in” ways of Snort to communicate with you upon detection of a threat. The standard format for this is

For example, if you want to log a threat to a MySQL database (assuming you have MySQL running on the local server), the format would be

Note, you will have to create the database and appropriate tables. For this, I recommend that you look at the following great reference here (http://www.andrew.cmu.edu/user/rdanyliw/snort/snortdb/snortdb_install.html). In addition to logging the event to MySQL, I will also recommend that you also alert to our standard Syslog server previously setup. To configure Snort for this I recommend reading the following reference here (http://www.disects.com/whitepapers/Logging_Snort_alerts_to_Syslog_and_Splunk.pdf). Thus, in our model, threats are notified to you ASAP via Syslog allowing you to quickly perform mitigation actions, but is also logged to the database for law enforcement documentation purposes.
Lastly, the best practice is to “include” rules you define from separate files, to do this simply use the “include” directive. The format for this is

If we put it all together, here is what a sample config file would look like:
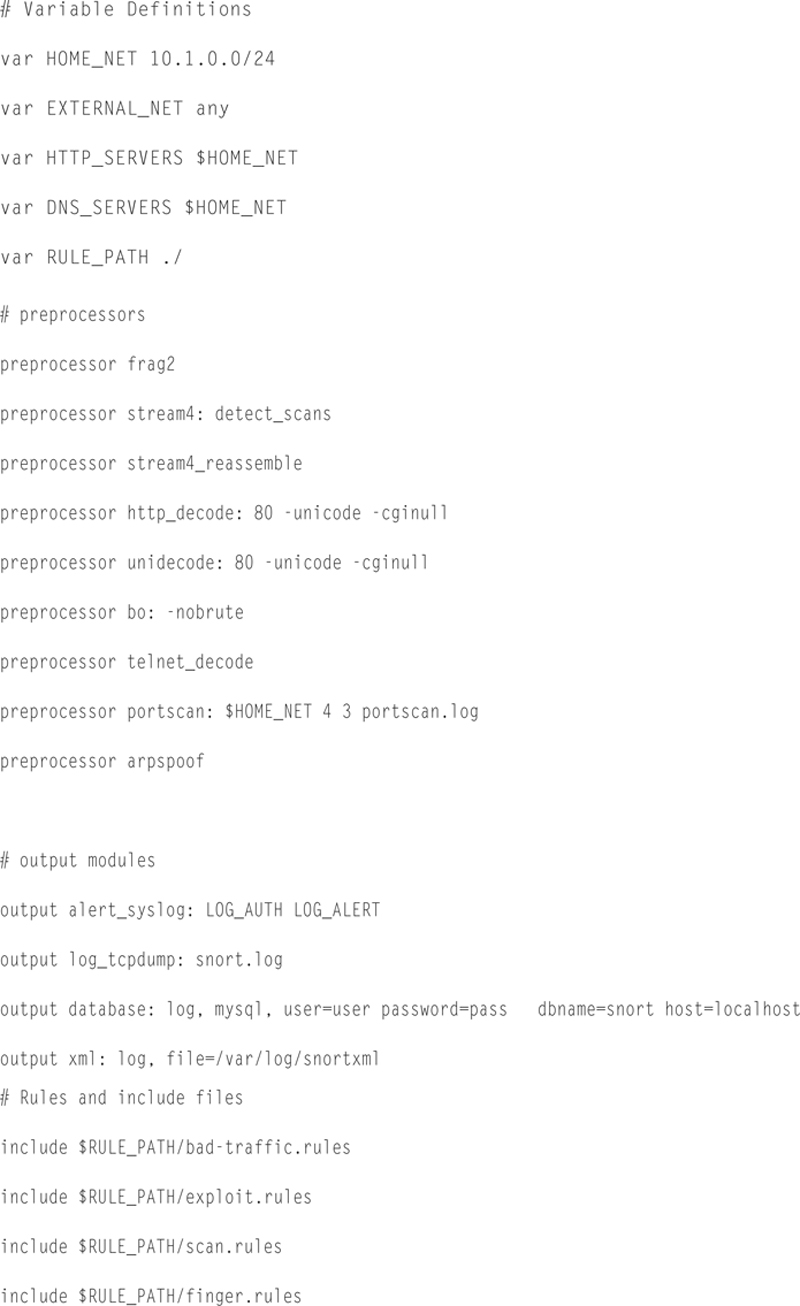
Example SNORT Rules
The rule set inside of Snort is where a lot of the power of the system comes from. Rules are independent of the main Snort process and are dynamically extensible. In fact, the most probable use case is that you will not build Snort rules yourself but will “Subscribe” to a “Stream” (which I strongly recommend). That being said, you should know how rules are formed. Since IDS systems are pattern matchers at heart, rues provide the “pattern” to look for in traffic. There are some basic conventions about rules. First, they are text based and logically organized. It would be bad practice to place all rules in a single file “included” in the snort.conf, or define the rules in snort.conf (you can, just bad practice).
If we look at an example rule
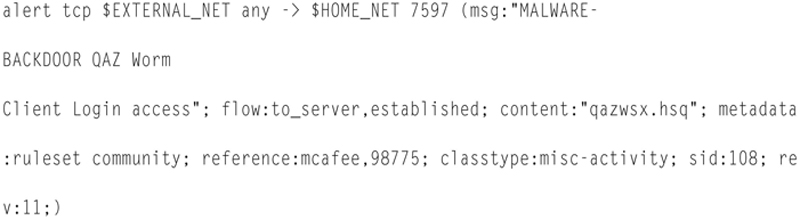
the first command is to “alert” as opposed to “log” etc. This means that when this rule is tripped, the alerting system configured in snort.conf will be used. The next block “tcp $EXTERNAL_NET any -> $HOME_NET 7597” states that is the stream is TCP based from the external net on any TCP port going toward HOME_NET on port 7597, process the rule further. This is an address and transport filter. The next block ‘(msg:“MALWARE-BACKDOOR QAZ Worm Client Login access”;’ is how we log an event. Notice that we can embed variable in this string.
Client Login access”;’ is the test message that is logged, notice that you are allowed to use variables in this string (not shown here). You will also notice that sections in the rule are separated by a “;” character. The next section “flow:to_server,established” is a subfilter for TCP, stating process the rule further to packets going to the server “to_server” and that the TCP session must actually be “established” (3-way TCP open successful). The next section ’ content:“qazwsx.hsq’ tries to find the string in the payload with case sensitivity. The next block “metadata
:ruleset community; reference:mcafee,98775; classtype:misc-activity;” gives metadata around the threat including reference ID, source, class type, severity, and priority. The block “sid:108” is a globally unique identifier for this attack. Note, if you build your own rules, set the “sid” to > 4,000,000. Finally “rev:11” is the revision of this rule. Notice too the entire block is then wrapped in open and close parentheses. This is just one example of a rule, there are literally millions of rules in the total Snort rule space, as well as addition parameters.
Installing Snorby: SNORT Visualized
Snorby (https://github.com/Snorby/snorby) is an HTML5 and Web 2.0 front end to help you visualize Snort events. Here is an example of what you will see with Snorby (Fig. 8.5):
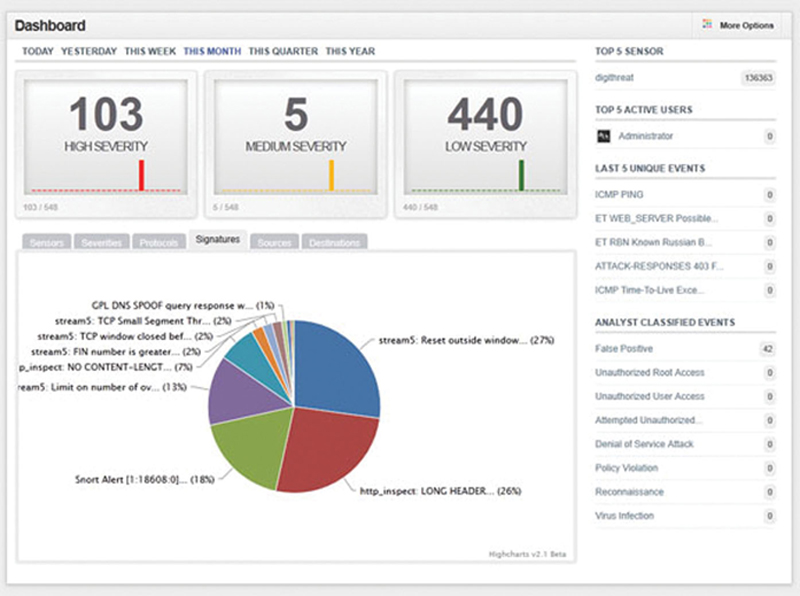
Figure 8.5 Snorby Dashboard.
Snorby makes trending and analysis much easier and should be used in complement to Syslog and MySQL logging. Here are the steps to install Snorby on CentOS:
Open up a terminal window and go into super user mode by typing

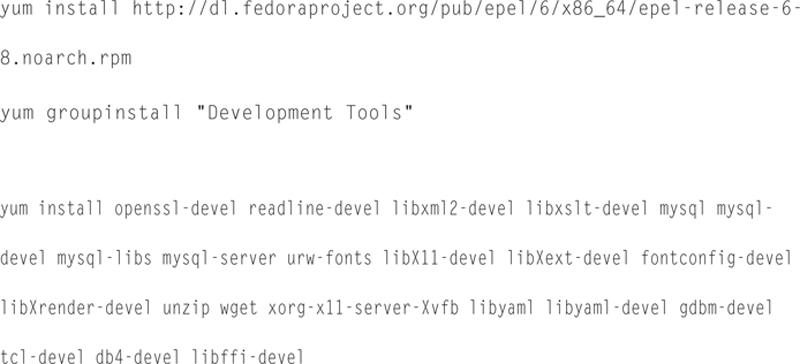
Now, we need to install some base packages, type in the following, pressing return at the end of each line. If asked for permission, always say “y” for yes.
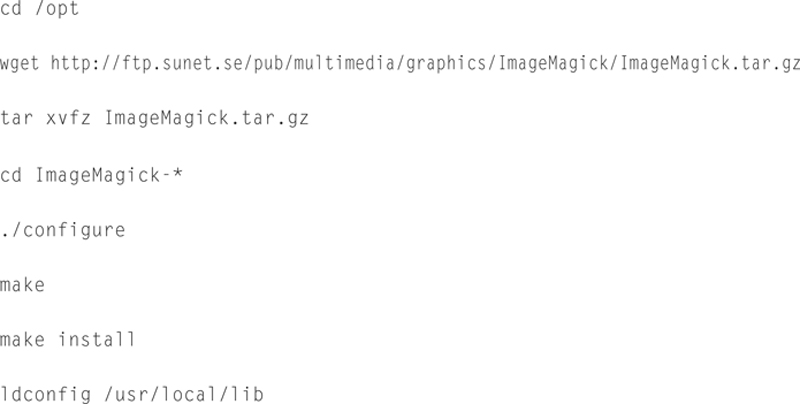
Now we are going to download and install ImageMagick:
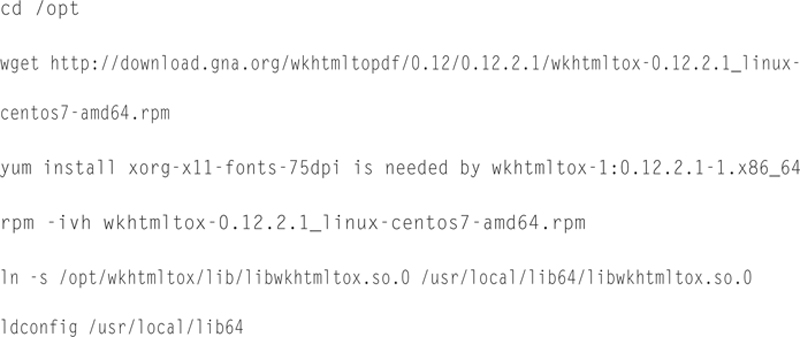
Now to install some more libraries
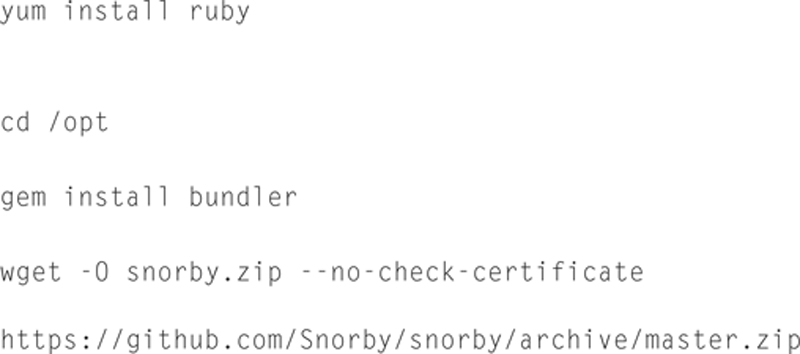
Now we need to install Ruby, Bundler, and Snorby:
Now we need to create an MySQL database for Snorby. Type the following:
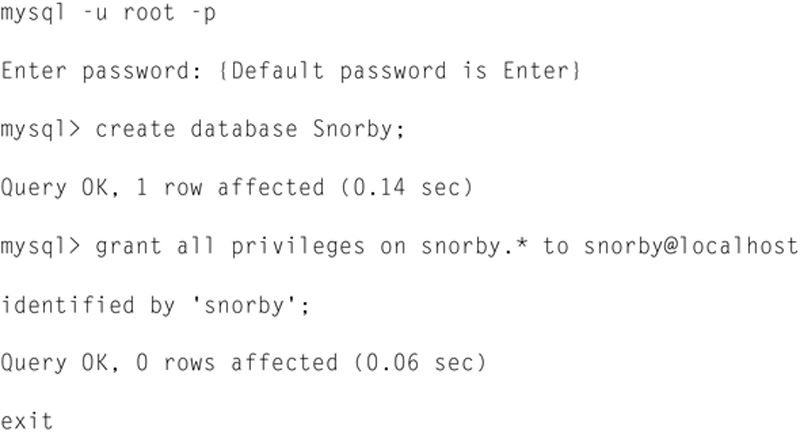
Now we need to create the tables
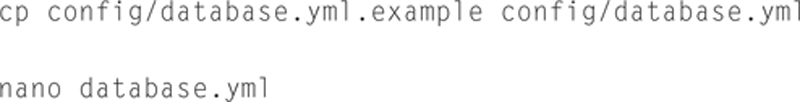
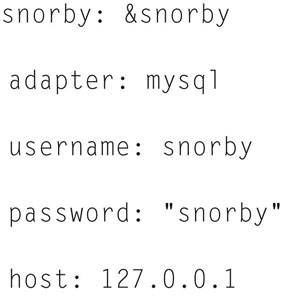
Edit this file to reflect
Now edit your ruby Gemfile file, and make the following changes:
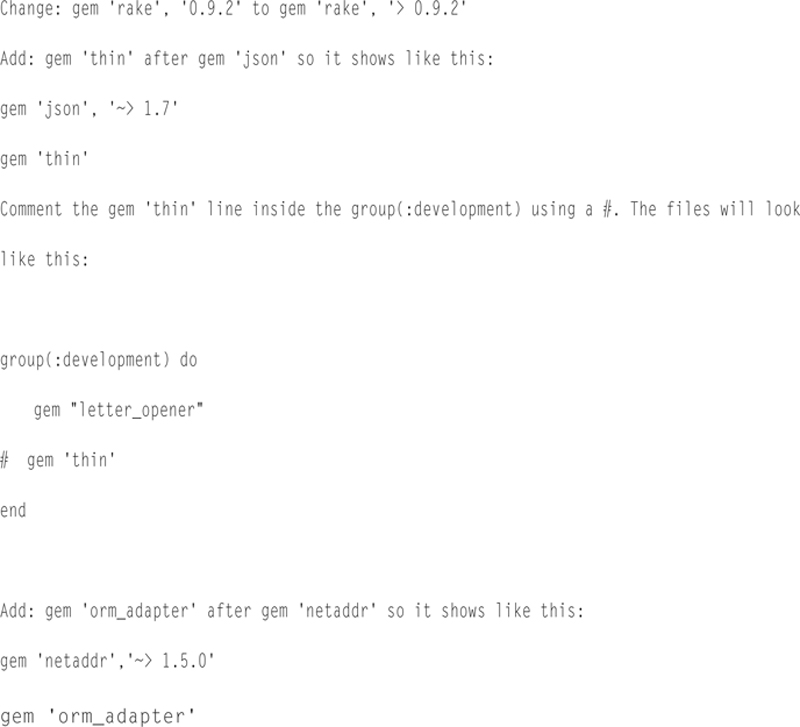
Now edit the Gemfile.lock file. Change the line rake (0.9.2) to rake (0.9.2.2), or the version you have.
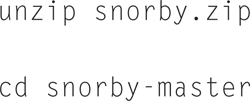
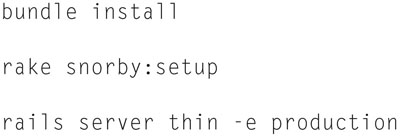
Now type

Now let us install Snorby:
And do not forget to modify IPTables,
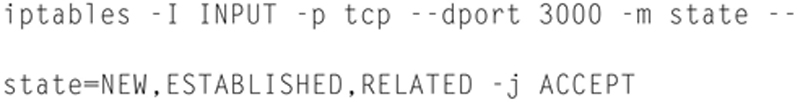
Now browse to 127.0.0.1:3000 (user: snorby@snorby.org password: snorby).
And you should see the login.
Go ahead and Login.
Summary
We discussed the need to monitor security zones with an intrusion detection system. One of the key utilities to help you accomplish this is SNORT. By building probes and deploying them throughout your network, you now have the ability to detect attempted intrusions. By using management systems like Snorby, you can combine SNORT events with other tools to give you a comprehensive and visual snapshot of the network attacks.