Chapter 9
Live traffic analytics using “Security Onion”
Abstract
Here, we show how to install and use Security Onion open source appliance in combination with probes. With distributed detection of intrusions and centralized logging, we show how real-time detections and post-attack trending may be practically implemented.
Keywords
Security Onion
intrusion detection
probes
Security Onion is a roll-up distribution of Ubuntu Linux, with many live traffic analytics utilities preinstalled for you. In addition, Security Onion adds a lot of value added linking of tools to make live monitoring possible. Whereas tools like Kali Linux allow you to intentionally scan for vulnerabilities and generate DDoS and penetration attacks, Security Onion is all about monitoring what is going on live in your network. One additional value add of distributed collection is that clustering, or correlation of date form multiple parts of the network, is built in to the tool. This means that you can have a central server collector collect data concurrently from many security zone boundaries and examine attacks heuristically. Lastly, Security Onion has very nice built-in data visualizers that work even with very large sets of data (generated by tools such as Bro). If you tried to build the functionality of Security Onion by hand, you would spend so much time customizing Ubuntu that it would be impractical. The first steps are to build our probes and servers.
Building Security Onion
The first step in building our probes is to determine the hardware we will build both probes and the central server so that we have room to grow over time. First, the Security Onion Server will have very similar requirements to the IDP Snort appliance we previously built (So I will not cover that here). I will though make one modification. In the case of Security Onion, I would favor classic hard drives over SSD, for the simple reason of storage capacity. My recommendation is to utilize the motherboard’s on-board RAID controller. I would use SATA III grade drive with a HDD capacity per drive of 4–6 TB (Do not use “Green” Drives, they do not work well for RAID). Next, I would purchase six drives of the same capacity and create a RAID 0 stripe, this will create a very large virtual HDD. Onto this I would install Security Onion. The reason why we are recommending this for the server is because for Security Onion to be most effective, we need lots of historical data abut the network. Since probes forward data to the server, we want to make sure the server can store very large sets of data. In addition, you may wish to invest in an Intel 5xxx or newer XEON grader 6-core CPU harness. The more power you give Security Onion, the more it can do for you.
As far as the probes, plan on creating a span port on each of your internal switches and connecting a probe. The more zones you monitor, the more complete your picture of the network. On hypervisors, you can simply connect the collector port to the local vSwitch (after turning off filtering (ie, setting VLAN to 4095, and turning on Promiscuous mode on the vSwitch)). Sensors do not need to be monster boxes, but should have a standard 4 core, 4 GB of RAM, NIC on the motherboard for administration, and a good additional NIC for monitoring (like an Intel 540x based NIC).
Now that we have the hardware in order, we should build the Security Onion Server. Go to here (http://sourceforge.net/projects/security-onion/files/12.04.5.2/) to download the ISO image of Security Onion. Now, either burn the ISO to a DVD or use tools like Rufus for Windows (https://rufus.akeo.ie/) to burn the ISO to a USB stick. Note, you will want at least a 4GB USB stick if you burn the image to USB. After you have prepped the hardware, set up your RAID 0 stripe set in the motherboard BIOS, then boot off of the DVD or USB to boot the installer.
After you boot the installer, you will be presented with the following screen:
Click and run the “Install Security Onion ..” icon on the desktop.
Pick your preferred language (or continue for English).
When you see this screen, do not click either option below, we will update later. Click Continue (Fig. 9.1).
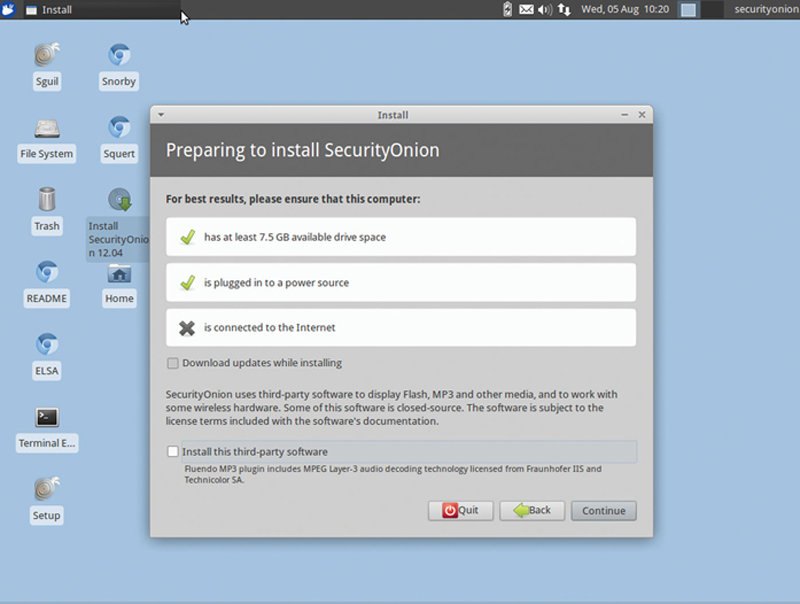
Figure 9.1 Installing SecurityOnion Package.
Now select “Erase disk and install Security Onion,” click Continue (Fig. 9.2).
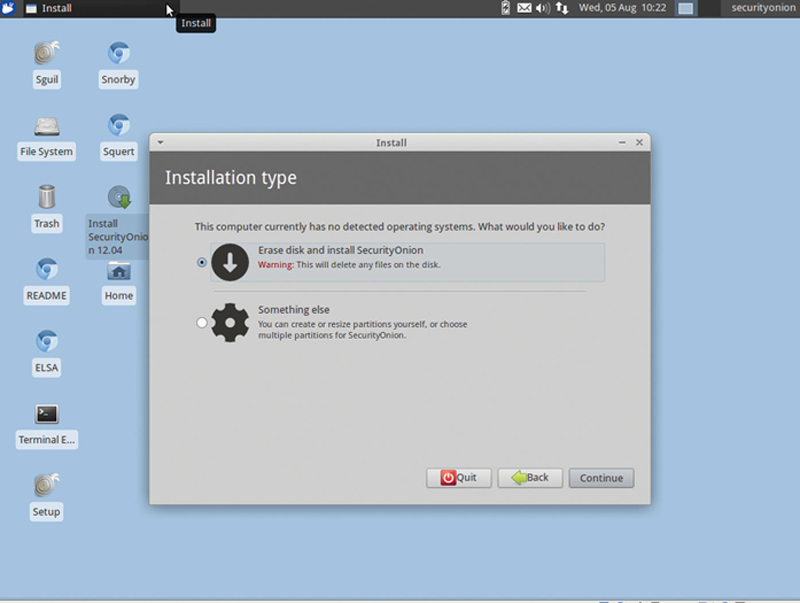
Figure 9.2 Start with a Fresh Install.
Select the Appropriate Volume to install and click “Install Now” (Fig. 9.3).
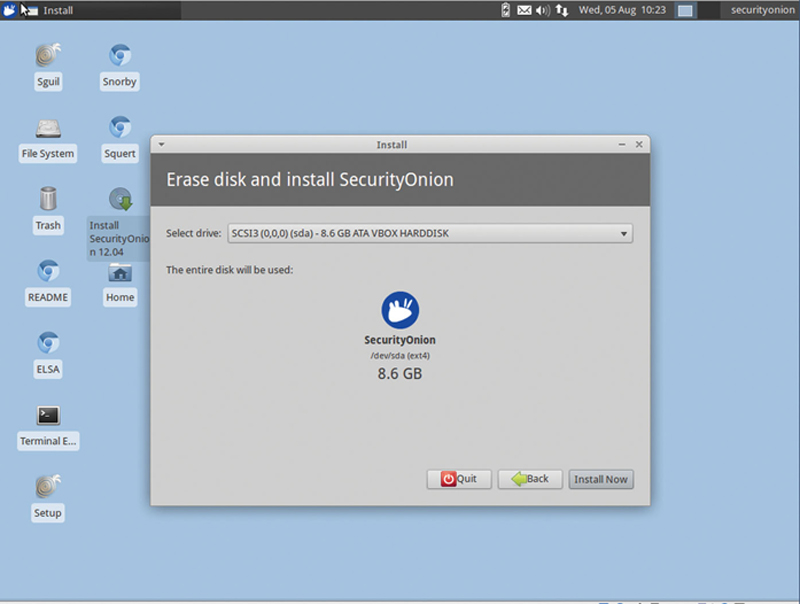
Figure 9.3 Pick the Target and Install.
If you are asked to set the time zone, just hit Continue. All time zones are set later to GMT by Security Onion to synchronize logs from all servers and sensors. Click the appropriate Keyboard layout and language and select Continue.
Now, in the next screen give the host an admin username and password. Do not login automatically and do not encrypt the home folder. Hit Continue (Fig. 9.4).
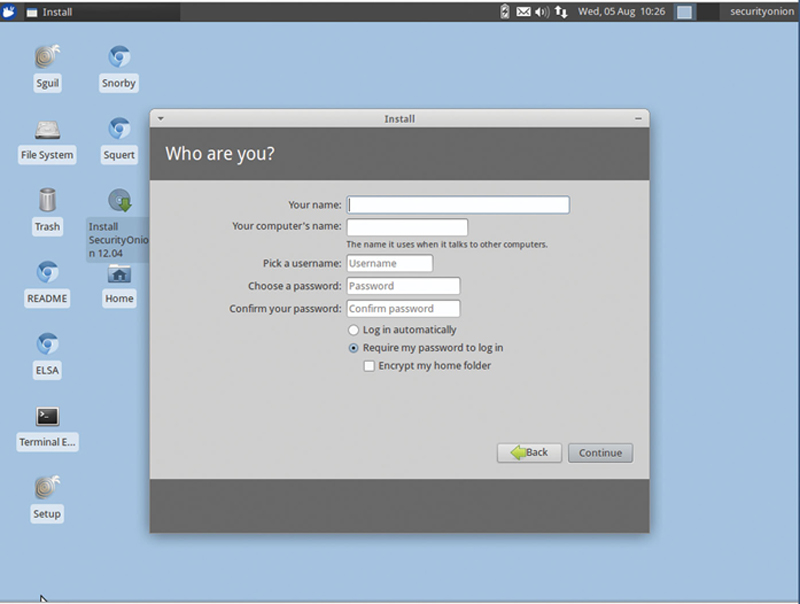
Figure 9.4 Choose a Secure Username and Password.
Now the system should be installing. When finished reboot and login into Security Onion. Once you are logged in, you can set your personal settings. If you want to set the screen resolution, you can use Ubuntu’s “xrandr” command.
To see available resolutions, open a terminal shell and type:

This will show available resolutions, to set a resolution, type:

Assuming the is the resolution you want.
We are now ready to run the Security Onion Setup Wizard. On the Desktop, identify the Icon “Setup” and run this application. This will guide us through setting up the appliance. Type in your password and hot continue and then next. When you see this Screen (Fig. 9.5):
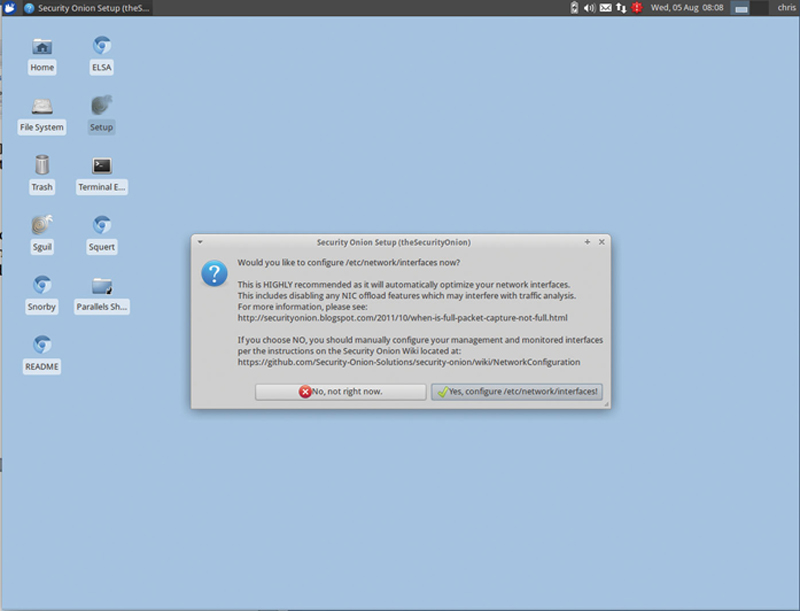
Figure 9.5
Click “Yes, configure /etc/network/interfaces.” When asked to configure the management interface, choose “eth0” (Fig. 9.6).
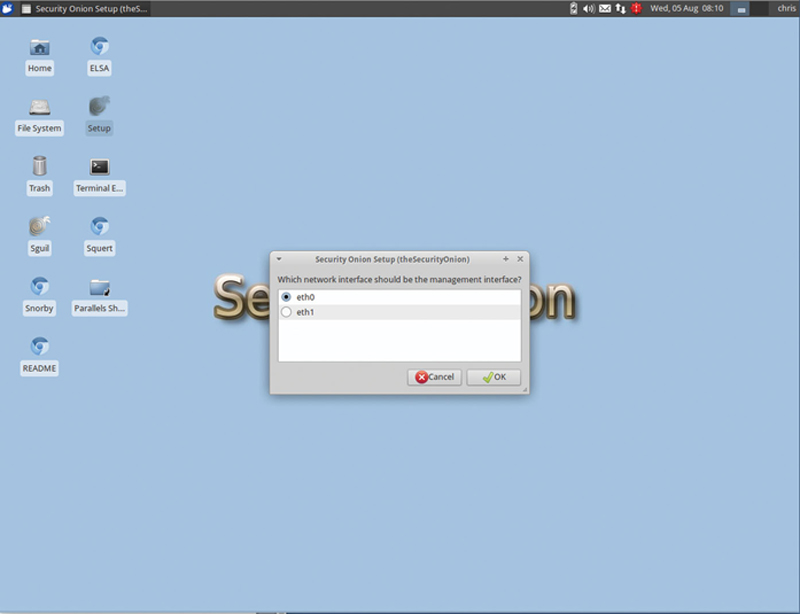
Figure 9.6 Choose NIC.
This will be the interface you will web toward when managing the system. This interface needs to be in a secure administrative VLAN, since it is vulnerable to attack. When asked, choose static IP. Enter the management IP, netmask, gateway, and DNS. It is always recommended to use statics on management interfaces for security reasons.
Now, you will be prompted to choose a monitor interface, this should be “eth1.” This interface will be configured for no IP and NIC based offloading will be turned off and promiscuous mode turned on the interface. Be sure that the switch you are connecting this too is also in promiscuous mode or you are bidirectionally spanning traffic to the port. If the switch is a virtual “vSwitch” you need you to configure the attached vSwitch to Promiscuous mode and most likely “VLAN 4095” (all traffic, unfiltered), but this is pretty specific to your hypervisor and switch. If you happen to be using Openvswitch, then you can use this example to set a span “port”:
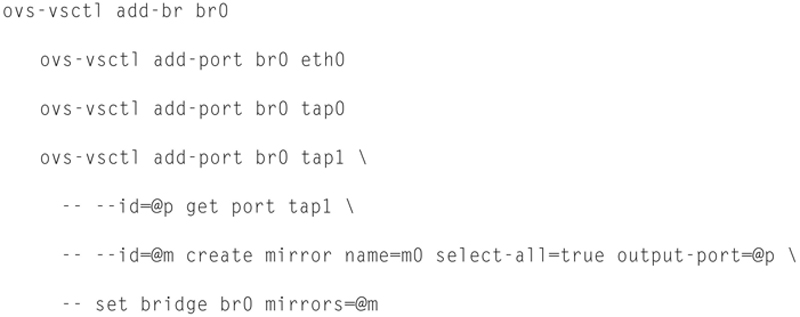
And connect eth1 to br0 interface on Openvswitch. To unset the span port, issue the following:

When you are asked to “Yes, make changes!”, click this. Click Reboot (Fig. 9.7).
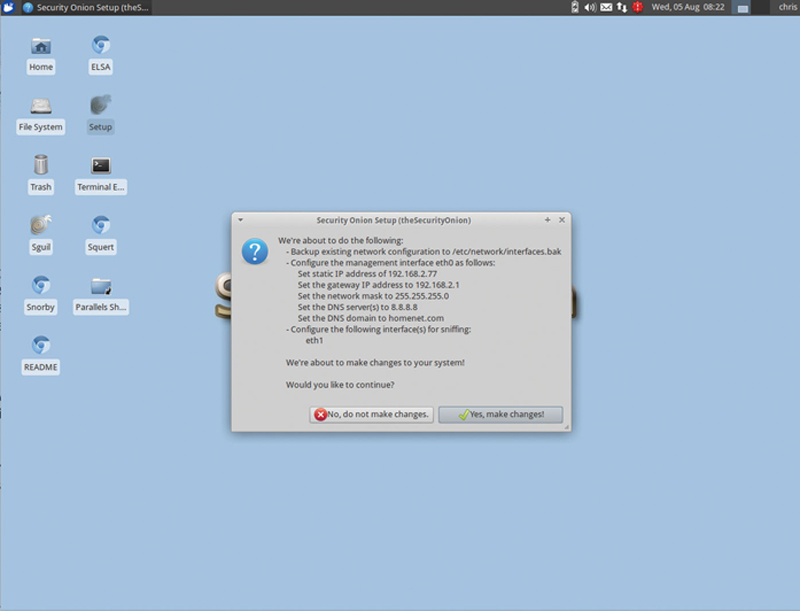
Figure 9.7 Commit Change.
Log back in and run Setup again. When asked, click “Yes, skip network connection!” (Fig. 9.8).
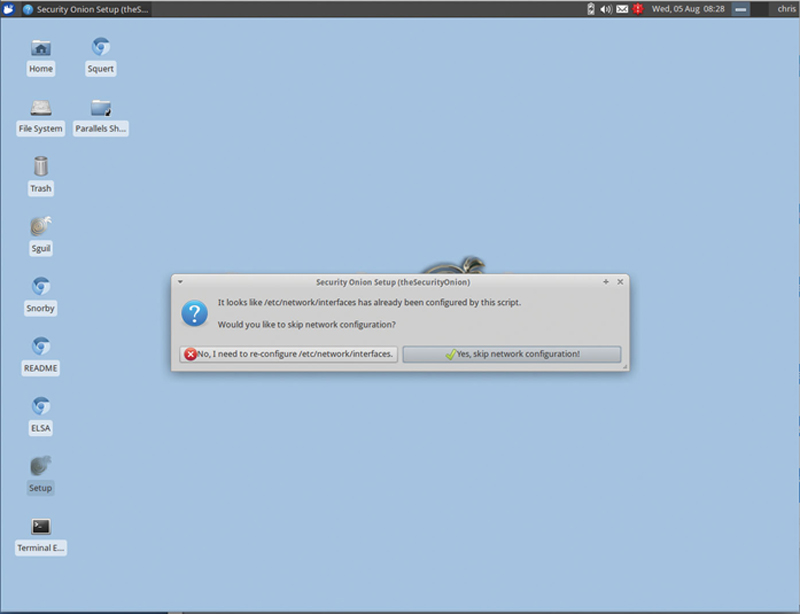
Figure 9.8 Configure Network Interface Options.
When asked, click “Advanced setup.” This mode will allow you to choose the role of the appliance, and configure other options (Fig. 9.9).
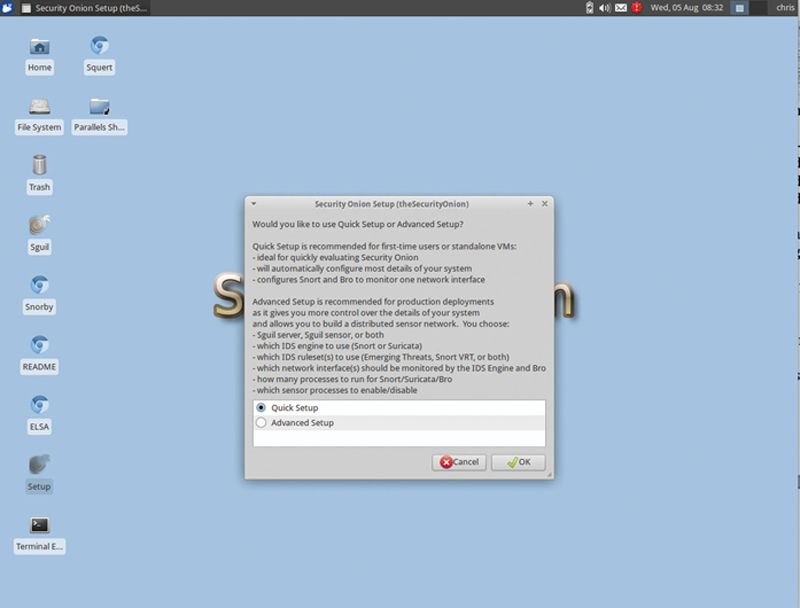
Figure 9.9 Select Quick Setup.
When asked for the role of the appliance, you will have one “Server” and many “Sensors,” but for this demonstration, choose “Standalone” appliance is both a Server and a Sensor. Click OK.
You will then be asked for a Sguil username, enter your username (I just use the same as my account name. You will be asked for a Snorby email address (used to login to Snorby) enter your email, and click OK.
You will then be prompted for a Sguil, Snorby, and ELSA password. Enter an appropriate password, click OK. You will then be asked to confirm you password choose, re-enter your password, and click OK.
You will now be asked how many days to keep in your Sguil database. The default is 30 days, but practically and legally this is way too short. In your production environment, you need to keep a full year’s worth of data, so keep 30 days for practice, but choose 365 days for production.
Note, later on if you edit /etc/nsm/securityonion.conf, find the string DAYSTOKEEP and edit it there. For now, enter 30, and click OK. You will also be asked a similar question for days to repair, the default is 7 days, in your production, 90 days is best practice. For now, keep 7 days and click OK.
Next, you will be asked which IDS engine to use, Snort or Suricta. We will use Snort, but this is a personal preference. Choose Snort and click OK. Now, if you purchase an Oinkcode Pro subscription, you can choose “Snort VRT and Emerging Threat - No GPL” ruleset). You will need a Snort VRT Oinkcode. My recommendation is to purchase a subscription and use it, as with many things in security, you get what you pay for. And, this is a good investment. For now, just choose “Emerging Threats GPL,” and click OK.
PF_RING is an improved Linus Ethernet driver model for high performance, here I recommend changing the value to “65534” slots and click OK. You will then be asked to confirm your monitored port, this should be “eth1.” Click OK.
Now, you will be asked if you want to enable IDS Engine support. Chick on “Yes, enable the IDS Engine!”. Now you will be asked how many concurrent IDS engines would you like to run. Basically, Security Onion will spawn an instance per CPU core. Since you want to keep your admin core free, the rule of thumb is N − 1 the number of CPU cored in your system, so if you have a quad core in a sensor, choose “3.” Choose N − 1 number of cores, and click OK.
When asked if you want to enable Bro, click “Yes, enable Bro!”. When asked if you want Bro to extract files, click “Yes, enable file extraction!”. Just like with IDS, you will be asked to choose the maximum number of Bro instances. Use the same N − 1 rule. Choose N − 1 based on the number of CPU cores in your system and choose OK.
When asked if you want to enable http agent, click “Yes, enable http_agent!”. When asked if you want to install Argus, say “Yes, enable Argus!”. When asked if you want to enable PRADS, click “Yes, enable PRADS!”. When asked if you want to enable full packet capture, click “Yes, enable full packet capture!” You will then be asked for a maximum file size per PCAP, 150 MB is fine, click OK. You will then be asked if you want to enable mmap I/o. Click on “Yes, enable mmap I/O.” Your PCAP ring buffer should be 64 MB for this example, your production environment should be set to 512 MB. For this exercise, keep the 64 MB default and click OK. Keep the default of 90% of disk space, purge old logs. When asked if you want to enable “Salt,” click “Yes, enable Salt!”. When asked if you want to enable ELSA, click “Yes, enable ELSA!” and set the allocated space to half of your disk size. Click OK. Finally, click on “Yes, proceed with the changes!”. When all the changes are applied, reboot your appliance using the terminal command:

If you want to verify your services are working, here are some handy Linux terminal commands:

This will give you a detailed report about your server status.

This will give you a guided tour of the sostat output.

This will give you redacted mailing list information.
There are also some important paths and files:

The PulledPork utility will store rules here. PulledPork utility allows you to update your definitions in an automated way.

You can source your own Snort rules from this file

PulledPort configuration files path.

This allows you to configure when new rules are synced, by default it is 7:01 AM UTC.

Sensor configurations are found in the /etc/nsm path.
After you log back in, launch a terminal window, we will now update the Appliance.
Updating Security Onion Appliance
Security Onion has made updating very easy. In the terminal window, type in the following command (Fig. 9.10):
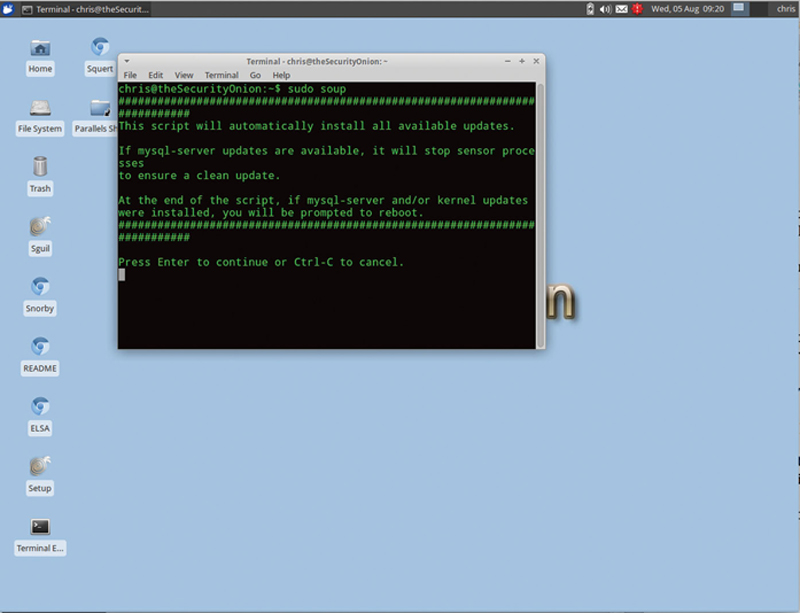
Figure 9.10 Update SecuityOnion Using “soup.”

When asked to continue, press “Enter.”
“Soup” will update Ubuntu core, and all security packages and helper application in the appliance. It is recommended that after each update, you reboot the appliance using the terminal command “sudo reboot.” Note the script will prompt you to reboot.
Because of the rapidly changing nature of attacks, patches and definition updates, you should set aside a maintenance window of at least once per week or even once per day. Here, you will run update scripts. As a best practice, out of date security tools or definitions can have a substantial negative impact on your security policy. It is best to start with the server than work out to the sensors.
Replaying PCAP Traffic in Security Onion
Security Onion has the ability to replay PCAP traffic traces over the monitored interface. To do this, it utilizes the TCPREPLAY utility. TCPREPLAY is a set of three utilities. “tcpreplay” replays a file on a selected interface, tcpwrite allows you to edit a packet and tcpprep will split a file based on client and server files. In addition, using salt, you and orchestrate replays across multiple sensors in the network at the same time. Now, we are going to replay some built-in samples of traffic found in Security Onion. It is assumed that in a test network, you would use sample traffic from your own network to pass across a system under test (SUT).
Open up a terminal window, and type the following:
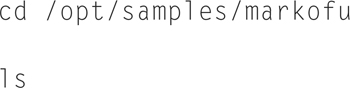
In this director as well as the parent directory, you are given some reference PCAP files for replay. Now, type the following:

We will then playback a file from this directory:

You will see 17 packets replayed out eth1 (Fig. 9.11).
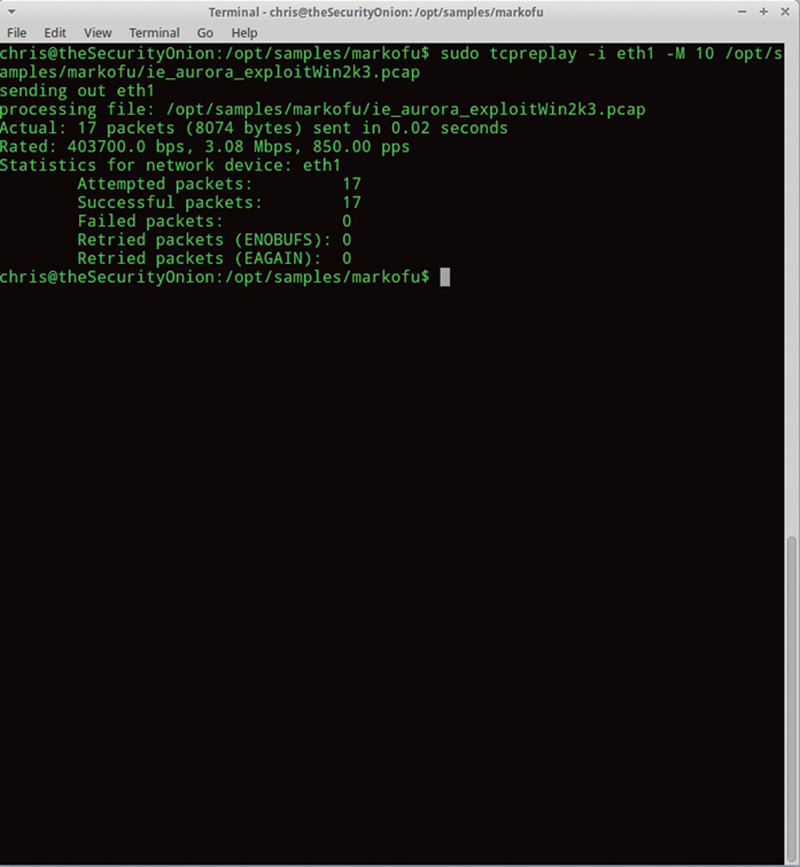
Figure 9.11 Using TCPreplay to Send a PCAP.
The format of this command is defined as the following. The “-i” flag specifies the replay interface, the “-M” flag tells tcpreplay to replay the file at 10 Mbps (by setting the Inter Frame Gap accordingly), and the path and filename tells tcpreplay what to play back. Note, “-M” is only one rate option, you can also specify packets per second or generate traffic as fast as possible given the resources of the PC and NIC.
Now, if you have a whole directory of PCAP files you want to replay, you can use Linux wildcards in files names. So, if I want to replay the entire ..samples/markofu directory contents, I can issue the following:

This allows you to generate a lot of variable traffic, especially for testing.
As a best practice, you will want to build up a library of typical traffic for each zone in your network. You should include peek times as well as nominally loaded times (like during the night). Remember, test results are more relevant if the tests input more closely resembles your specific environment.
In addition, there are some interesting additional flags you may want to consider to use. Here is a list of some of the most relevant:
-v and -q
Verbose mode. This mode will output detailed information as a PCAP is being replayed. The flag “-q” will go into quite mode when replaying.
-i and -I and --cachefile
When used in conjunction, the “-i” specifies the server output NIC, and “-I” specifies the client output NIC. Using the “--cachefile {Cache File}” specifies the cachefile created with tcpprep. This option allows you to split the client and server traffic between two NICs and play them back in order.
Example:
Step 1: Prep the PCAP

Step 2: Modify IPs

Step 3: Replay using client and server NICs

-l {count}
Loop the play back the specified number of times.
-t
Play back the replay as fast as possible.
-o
Step the playback. A packet will be sent and then you will be prompted to press enter to send the next packet. This is good for Firewall and IDP/IPS debugging.
In addition, you can also modify your traffic by changing fields. To do this, we will use the “tcprewrite” tool. The first flag you will specify is the “--infile = {Pcap file source}.” This is the unfiltered source file. Next, you will specify the output file using the “--outfile = {PCAP file},” finally you will specify the field name, the old value, and the new value. For example, if I want to change TCP port 80 to TCP port 8080 (for example if I was using a proxy), I would use the following flag “--portmap = 80:8080.” Note, you can alter multiple fields in a single pass of tcprewrite to make modifications easy.
Another example is modifying the PCAP to replay over a routed device different than in the original pcap. Here, we need to modify the destination IP and the destination MAC address (to match the local router interface). If you use the flags:
--dstipmap = 10.0.0.0/8:11.0.0.0/8
This will change the network portion of the address from “10” to “11,” keeping the host portion of the address constant. Now, we need to simulate the effects of an ARP. Given the MAC address of the local routed interface, say “11:22:33:11:22:33,” then will use the flags:
--enet-dmac = 11:22:33:11:22:33
Lastly, we may wish to sanitize our PCAP source file to only include a specific type of traffic, say HTTP. Here we will use the TCPDUMP utility. If we specify the command:
tcpdump -r example.pcap -w http_only.pcap -s0 tcp port 80
Than only conversations based on TCP port 80 will be written out to the output file.
The tcpreplay utility suite is a very powerful utility in your tool chest, because it allows you to take your specific traffic, combined with an archive of the traffic found in your network zones throughout a typical work week, and play it back over a device. In addition, because you have the ability to replay traffic, you can now properly test candidate devices or code before it is released to your production network and do true trending.
Using Snorby for Threat Visualization
Sometimes you do not see the big picture just looking at logs; this is especially true if you have multiple distributed sensors across different security zones. Snorby is a very nice, very modern, Web 2.0, application that is included with Security Onion. Remember, when running through the Security Onion setup wizard, you were asked for a Snorby email address. This is your Snorby username, your password is your Security Onion password. First, we do need to understand where Snorby sources data from and which logs it inspects. Snorby will roll up your IDS (ie, Snort) and Bro logs into one master snapshot of the network.
In a terminal window, type the following command:

You should see something like (Fig. 9.12):
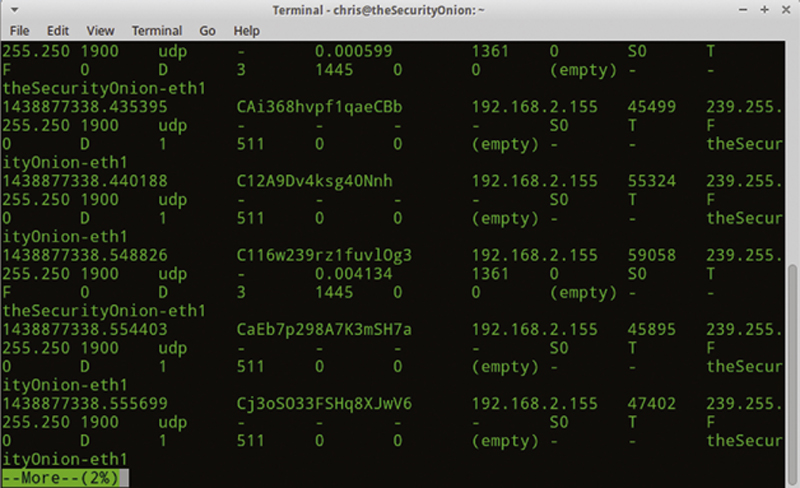
Figure 9.12 Example of Realtime Results.
This will show the session information and characterizations of traffic. If you go one directory up and type (Fig. 9.13):
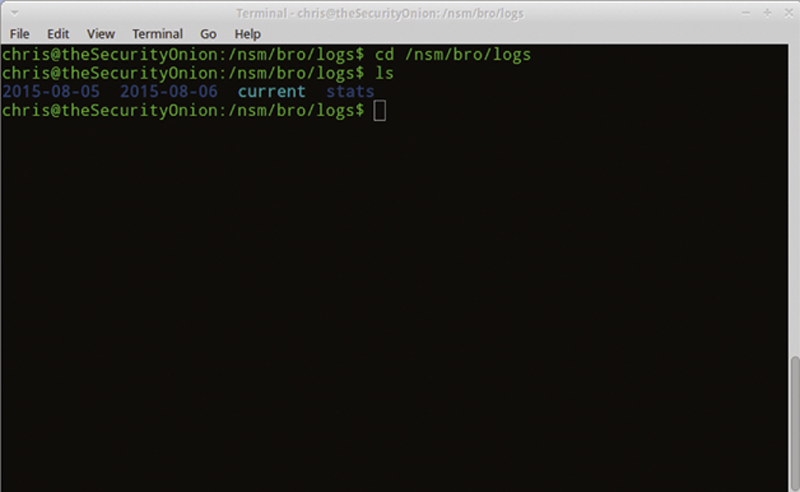
Figure 9.13 Location of “bro” Logs.
you can see that the “current” directory (Today) is where bro is actively logging, and archived days each get their own directory.
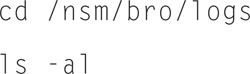
If you change directories to an archived day, and do an “ls,” you will see something like this (Fig. 9.14):
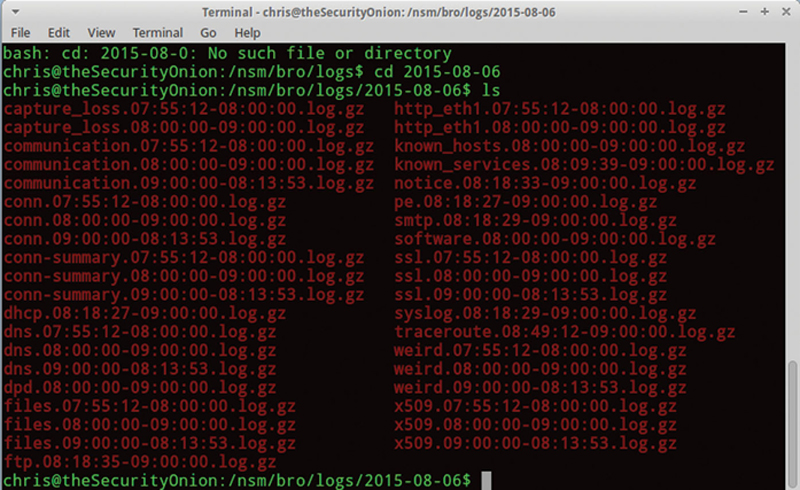
Figure 9.14 Listing of Logs.
Here you can see different layers are being archived in their own .log.gz files. You can imagine that only looking at raw logs will make analysis so complex that it will render it inert.
On the Security Onion desktop, click and run Snorby (If you get a browser security message, just proceed with connecting to localhost).
Type in your Snorby email address and Security Onion password, and login.
From the main dashboard of Snorby, attack events are divided by severity, including low, medium, and high severity. In addition, the user has the option to change the time domain from the last 24 hours to “This Year.” A 24-hour view is useful to see what is happening now, and should be your default view because you want to react to attacks very quickly. Annual view is good to see macro attacks event trends. This is useful to see if you have been attacked on a regular basis or by the same or similar entities.
Setting Snorby Preferences
The first thing we want to do is configure Snorby to send us an email when an attack is detected. This is very important because time is very critical when defending from an attack. In the directory “/opt/snorby/config/initializers” you will find a file called mail_config.rb (a Ruby file). Edit this file to configure mail options.
Type

You will want to uncomment out lines (remove the “#”in front of the line) and configure your specific settings:
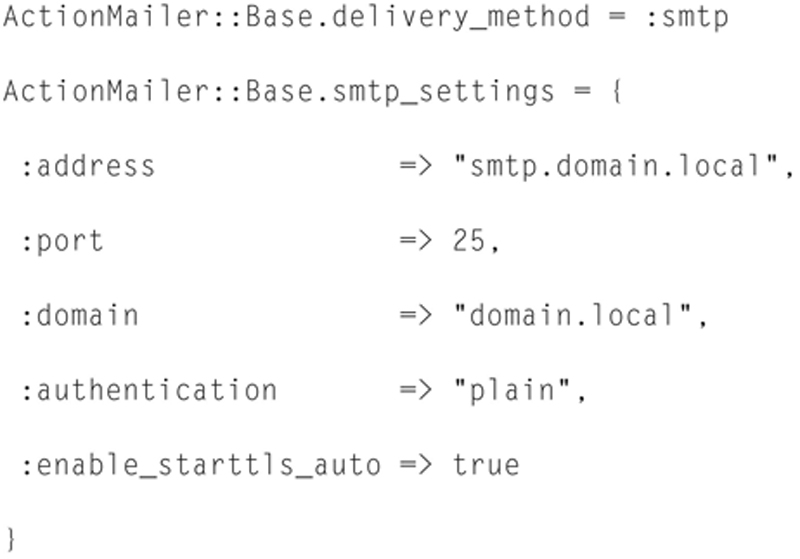
Save the file, and exit. Your “smtp.domain.local” should be your local SMTP server in this sense your MS Exchange Server, be sure to allow SNMP relaying from Exchange Server from this IP or subnet. Next, set your local MS Exchange Server domain setting and configure the domain.local setting to your local Exchange domain name like “mail.exchange.mycompany.com.” After these changes, reboot my server so Snorby reloads its entire configuration.
Now, back in the Snorby control panel, click on Settings in the upper right hand corner. Check on the “GeoIP” and Prune Database, set pruning to 1M events. Set your company name. Now click on the red “Administrator” menu and click on Sensors.
You should see a list of sensors that Snorby detects. On the Name column, click on each sensor name and give the name a meaningful name of the Security zone it is monitoring (like “Boston LAN Office”). If you want to see a historical record of events, click on the “View Events.”
As a side note, there are some nice hot keys when working with event lists in Snorby.
Lastly, if you want to remove a sensor, hit the trash can icon and confirm.
If you want to add additional users, click the red “Administrator” and then click on “Users.” Here you can click on “Add User” or you can remove a user. Note, only administrators should have access to Snorby. Now, provided you have permitted access via the firewall, you should be able to web browse to your Snorby desktop from your browser using the URL:

Basic Snorby Usage
When you log into Snorby, the most useful screens will be when you have the “Last 24” timeframe selected and when you either click on High Severity or Medium Severity events. Again, tools like Snorby are only as good as the quality and quality of the database. I strongly recommend that you subscribe to professional level of rules (Oinkcode in Snort); it is really worth the investment.
Down the side, you will see roll-up analysis of the top five active sensors and users, the last five unique attacks detected, and then administrator flagged attacks by type. Below the High, Medium, and Low severity panels, you will see additional tabs. The first tab, sensors, will down event count by Sensory. The value to you here is you can see over the last time domain (like 24 hours), when and where activity occurred.
The next tab, Severity, will break down the past 24 hours by severity type to show you when these classes of attacks occurred. The next tab, protocols, will then sort traffic over the past 24 hours by TCP/UDP/ICMP (Ping). The Signatures tabs will show you a pie chart of attack class, and sources will show you where the events are coming from (even if it is internal to the company). Finally, Destinations will show which targets were hit the hardest. Using the information on what is attacked, you can build a defense strategy that focuses on critical systems. For example, if your attacks are sourced from external sources, that means that your outbound, Internet facing firewall, is not detecting and blocking attacks. The defensive action is to write a rule to block the protocols and ports at the firewall. Or, more simply, make sure the firewall rule base is up to date and that you have the appropriate configuration in the firewall to block the aforementioned attacks.
Decoding an Attack Event in Snorby
When a candidate detected event shows up in Snorby, it is really important to be able to decode the information Snorby is presenting you, so you can perform mitigation actions efficiently. Events in Snorby show up as characterized by severity as High, Medium, or Low.
Click the severity level panel and you will see a list of candidate events as they occurred, newest at the top. Note, you can “Star” and event for quick reference later.
Now, when you click on an event you see the next level down in information. In the main row where you clicked you will see the source sensor that detected the attack. This is why it is really critical to name sensors in a meaningful way, so at a glance you know in which security zone the attack was detected. You will then see the source and destination IP of the attack. Most likely your network uses private IP addressing of (10.0.0.0/8) or (192.168.0.0/16) super nets. If you see an attack coming from one of these, you know the attack is internally originated. Next, you will see the Event Signature, which is a description of the attack candidate, and finally you will see a timestamp.
Under the IP Header Information section on the roll down, you will have the ability to perform some additional actions to either the source or the destination address. The first thing you can do is Edit the asset name. This is most useful for well-known internal objects like servers, printers, DNS servers, etc. This allows you to assign a friendly name to an IP for easy identification. You also have the option of making the scope of the name local or global. As a rule of thumb, only use this feature for hosts that have static IPs, and make the change global.
You will notice that once applied, the source or Destination now uses the “Friendly Name” you applied. Next, you can do a basic source or destination lookup. This will access the Whois and DNS networks, which will give you reverse resolver information. Notice here you have the two options to look for information in Whois and DNS by clicking the hyperlinks.
It should be noted that more armature attacks will not alter these records and more sophisticated or state sponsored attackers will seed false bread crumbs in these records. Therefore, the information from these records should always be taken with a grain of salt. You should though when collecting information about the attack include this information. The next search you can do is “Snorby Search by Source” or “Destination.” When selected, this will sort though all the sensors to see if there are other occurrences by this source or destination IP as a filter. Lastly, you can perform an ELSA search by source or destination IP. Using ELSA is very advanced filtering. When you first go to Else, you will be prompted for your username (provided by you when you rand the Security Onion Setup Wizard) and the system password. The first screen you see is the number of hits by log source (ELSA looks at logs across sensors, across different tools (like Snort and Bro)) (Fig. 9.15).
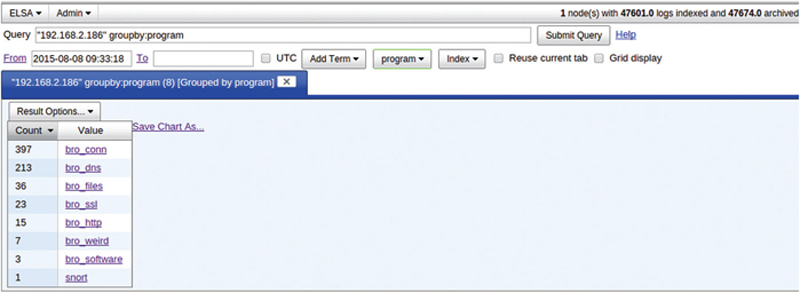
Figure 9.15 ELSA Utility Search.
You can then drill down and see occurrences (Fig. 9.16).
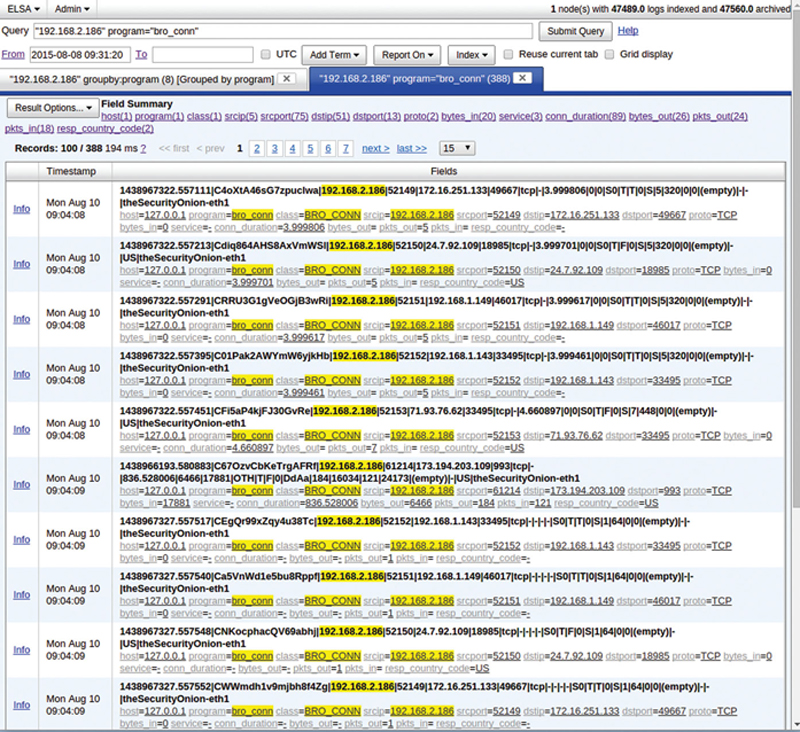
Figure 9.16 Example of an Elsa Search Showing Security Events.
Back in Snorby, under the signature Information section, you can see how active the candidate attacks was and is, the category of attacks. You can then click on “Query Signature Database” and your attack SID will be looked up and more data about the attack, including the severity, targets, intent, will be presented (if there is a matching database entry).
In addition, you can view the Rule that triggered the candidate log entry, which is a good exercise to learn how to write Snort rules.
Under the TCP/UDP/ICMP header section, most critically, you will see source and destination ports, and under payload, you will see the packet (I use ASCII view).
As a policy, every candidate attack event should be classified and documented. If you select Mass Acton Events, you can classify the attack ranging from False Positive to Unauthorized root Access. You can select the Signature (recommended) and further filter down by source and destination addresses. Choose the sensors and options and perform mass classification. You can classify an event by meaning, impact, and severity. For example, an event may be explainable, may be a low level attack, or may attack a critical system. Click “Classify Event(s)” to see appropriate value. Also, you can add a note to an event allowing you to document the conditions around the attack. Also, by right-clicking the “permalink:” field you can create a hyperlink to this event.
By clicking ”Event Export Options” you can save the event to XML or email the event. Also, in the main Snorby tool bar, if I click on ”My Queue” and can filter by ”Stared” events that need to be processed. Also, if I click on Search, I can find events by such metadata items as Classification, Addressing, TCP source and destination port numbers, or ”Owner” (Administrator who classified the event). Multiple events are ”All” (which is ANDED) or ANY (which is ORed).
Now is a good time to talk about best practices for security monitoring. You need to assign a “Security Engineer on Duty” for a fixed period of time (usually 24-hour window). You may have multiple on-duty personal, especially if you are in a geographically diverse network scenario (like WAN stubs in North America, Asia, and Europe). This schedule should rotate across a pool of people. When an engineer is on duty, they need to have real-time access back to the management network. They need to monitor Security Onion events, Firewall events, and L3 Routing ACL violations. When any of these events triggers, engineer needs to respond within minutes (time is very critical). The engineer should follow the 4 “D”s of defense: Detect, Defend, Document, Discuss. You cannot defend against an attack unless you detect it, and you cannot proactively detect distributed attacks in a large network unless your signatures are up to date from a professional subscription. Therefore, investing in such subscriptions is pretty important. When an engineer starts their shift, the first thing they should do is go to a terminal window and “sudo soup” on the server and on the sensors, this updates Security Onion definitions and packages. They then need to clear the ACL counters in the L3 Routers, make sure the firewall databases (Internet Facing and between Security Zones) are synced. A typical “Good” day will be the outside firewall interface is routinely attacked, but was blocked at 100%, and there were no internal firewall events, Snorby Events, or ACL violation incremented counters. When an event does come in to Snorby, it needs to be cleared, based on the severity level and what is being attacked, the engineer should grab the Source and destination IP addresses, source and destination TCP/UDP/ICMP ports almost immediately. Next, they need to start writing rules from the inside out, starting at the server or resource being attacked. When mitigating attacks, begin with the target of the attack. If this is a server, write an IPtables rule blocking this attack immediately. Now, move out through the network and start to layer blocks. For L3 switches, write an access control (ACL) rule to block the attack. Initially, make sure all interzone and internet facing firewalls are configured with rules to block the attack. This technique requires practice to implement because it needs to be done in a specific order and very quickly. The logic behind starting inwards and moving out is that is you have infected internal systems which may concurrently attack the target, you want to protect it first to minimize damage, then start to cut off pathways of access. But measuring hits you receive trigger the IPTables rule and ACL and firewall rules, you will have a better idea of what internal systems are potentially infected. If the attack is internal, there is a chance the internal resource has been compromised. Here, the best thing you can do is to both suspend the account associated with the host in Active Directory, then administratively shut down their Ethernet port at the switch, and kick them off Wi-Fi (Since AD will be locked, they will not be able to rejoin). This is the defense phase. Response time is the most critical element of this phase. Next, the engineer needs to document the event (ie, grab the permalink) and should document the action taken in the event notes field in Snorby.
As a rule, if an engineer sees greater than five events in a 24-hour period, then there is a likely chance that the network is under attack, and the engineer should then escalate to a manager or director for an “all hands on board” defense. If the attacks cannot be mitigated, then a directory or senior organizational official should have the option to “kill” an Internet connection. This is basically taking down all outside connections to stabilize the internal network. This is an extreme but necessary option.
After the attack has been mitigated, the engineer needs to document the Who, What, Where, When, Why, and How’s of the attack. The more complete the information, including logs, Snorby permalinks, and exported XML, etc, the more likely the chance of law enforcement being able to convict an attacker. I am a firm believer that every attack should be vigorously reported to law enforcement and prosecuted in court (Criminal and Civil). Report them here (http://www.dhs.gov/how-do-i/report-cyber-incidents). Some may think this is excessive, but remember that criminals look at the ROI (return on investment) of crime. If you make it known that “we prosecute all attacks” then that ROI goes down. Would it not be easier for a criminal to go after a less prepared company than yours?
Lastly, every attack is a leaning experience. What defect in the network policy and design allowed it to happen. How can the network architecture adapt to prevent future events like this? These questions are invaluable to the hardening of your network design.
Another Perspective on IDS Using Squert
Squert is another tool that is included with Security Onion that is a complement to Snorby, but in addition, uses some additional detectors and information sources. It gives you access to network IDS alerts and host based IDS alerts from OSSEC, BRO logs, PRADS/PADS asset detection, etc. You can think of Squert as a search engine for security events and traffic that occurred across your sensors in the network. This ability to search, sort, and slice traffic makes Squert very complementary to Snorby.
First, we must modify one file and encode our username (the one you provided in the Security Onion Setup Wizard) and your Security Onion password. Open up a terminal window and type the following:

In the “// Sguild Info” section, add the following two lines after ‘$sgPort = “7734”;’
Press ESC, the :wq! to save.
When you login you will see the main Squert Screen as shown here (Fig. 9.17):
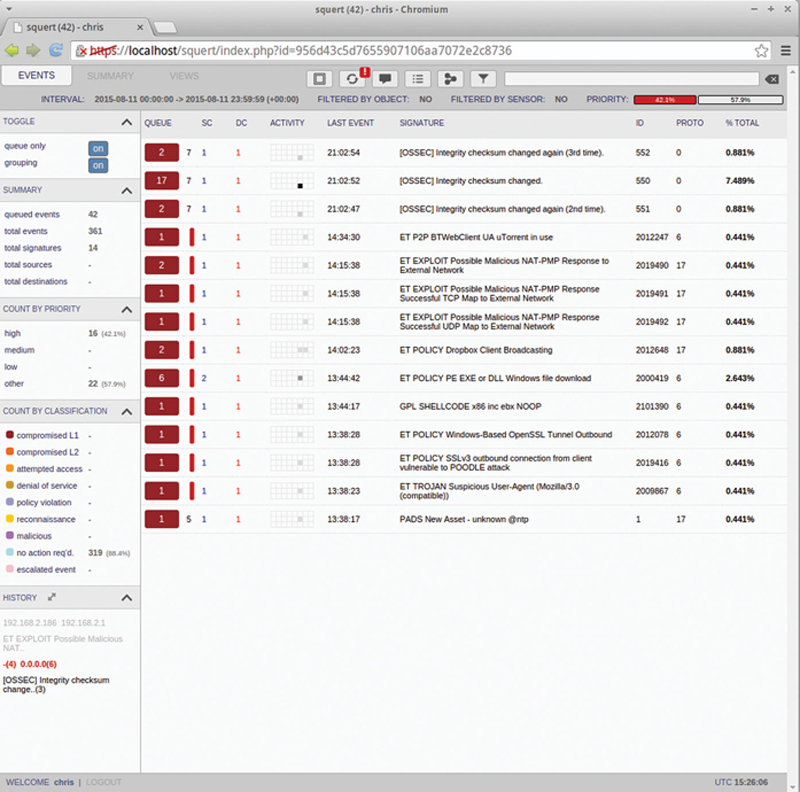
Figure 9.17 Example “squert” Main Dashboard.
The main tabs at the top allow you to view events by “Events,” “Summary,” or “Views.” When you click on Summary, you will see a GeoLocation map. This allows you to see where events are sourced from (Fig. 9.18).
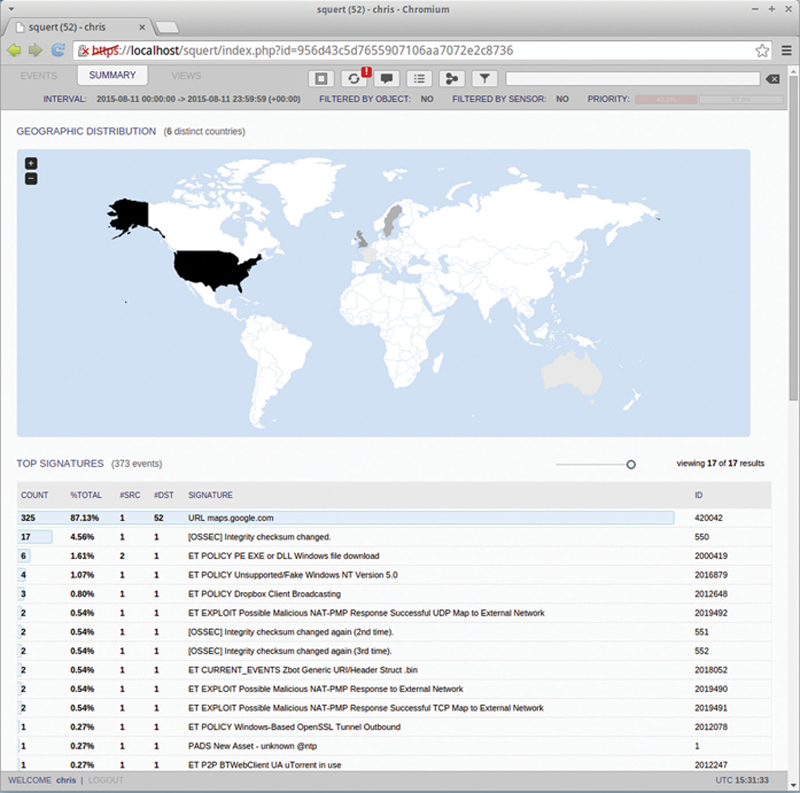
Figure 9.18 Event by Geography.
Finally, View will allow you to visualize events in a flow diagram by IP, Source Country, or Destination Country (Fig. 9.19):
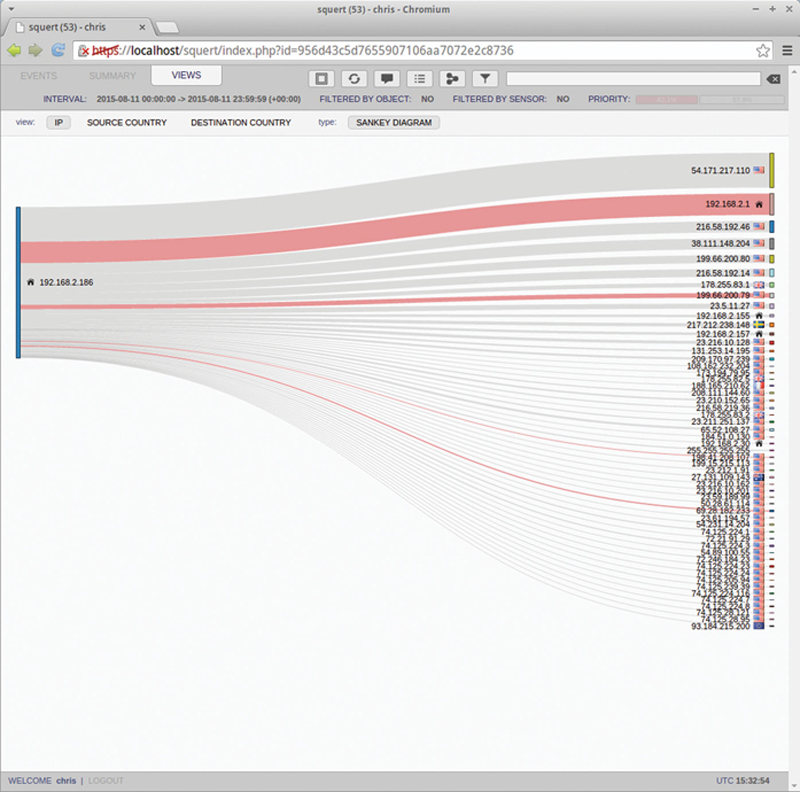
Figure 9.19 Event Flow Map.
Back on the Events tab, you will see the Actions and Filter area here (Fig. 9.20):

Figure 9.20 Search Bar.
The first button allows you to toggle on and off the summary bar to the left to gain more space to look at events. The next button will refresh the current view. The next button allows the user to comment and classify events in the current view (Fig. 9.21):
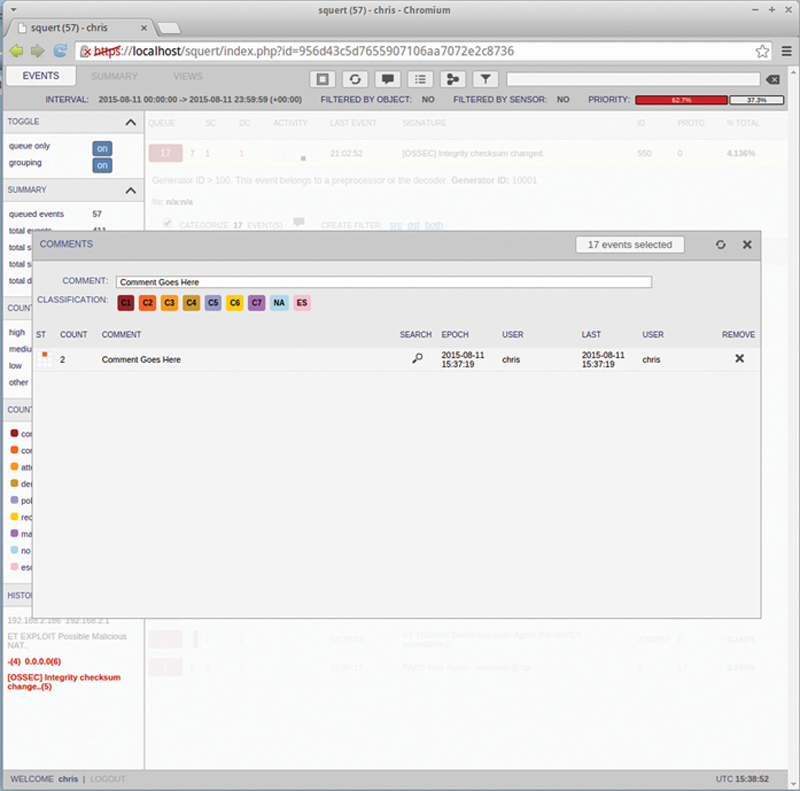
Figure 9.21 Documenting an Event.
The next tab allows you to add our edit auto classification rules. The next tab allows you to see sources (such as OSSEC and PADS). Lastly, you can filter the event down to a specific object like “ip 1.1.1.1.”
If you click on the Interval, you can then choose the year, month, day, and hour.
When you click on an Event, you will then have the ability to drill down to associated events. Here you can see source, Destination, port numbers, and event description. Note, if you click on an IP address or port number, you can have Squert create a filter (Fig. 9.22):
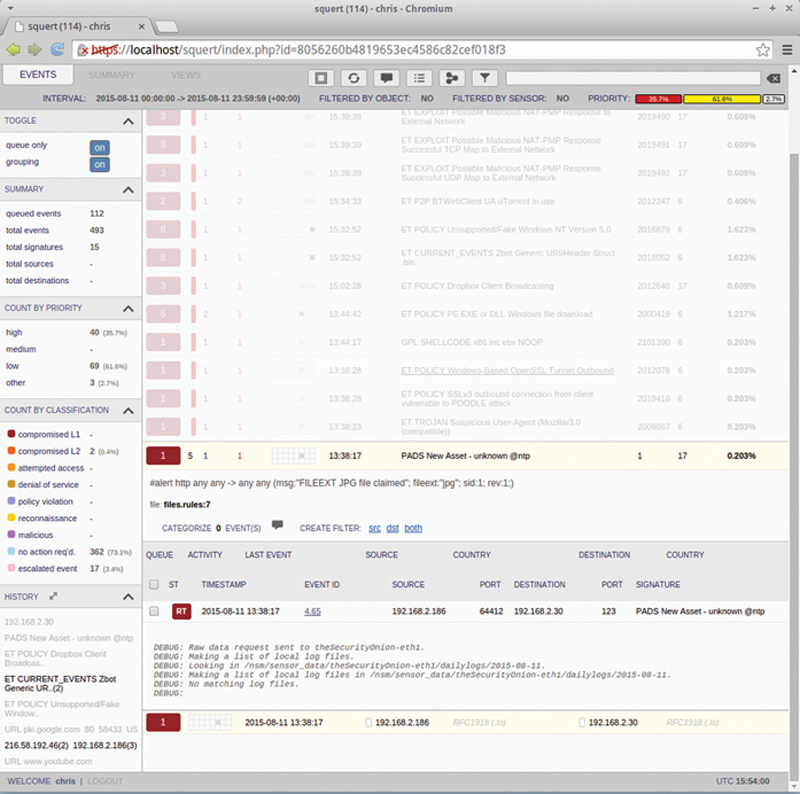
Figure 9.22 Drilling in to an Event.
Now if you check the event, and click the Comment icon, you can comment and classify just that event. Just like in Snorby, every event needs to be inspected and cleared, categorized, and Actions taken documented in the comments.
Using Sguil for Monitoring Post and Real-time Events
Sguil is a security monitoring tool based on TCL/TK that like Squert allows you to see events from multiple data sources and sensors into a central repository. The main user interface of Sguil will characterize traffic and allow you to see packet information, from here you can cross reference, categorize, and drill into events by pivoting your views. Here is the main user interface from Sguil (Fig. 9.23):
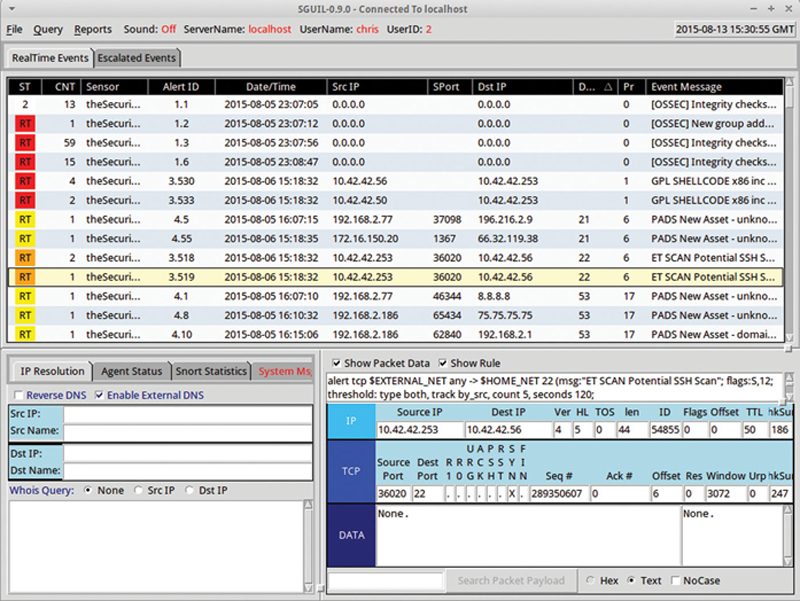
Figure 9.23 “Sguild” Main Screen Showing Realtime Events.
Before you login from the Security Onion Desktop, go to a terminal window and type the following:
You should see Fig. 9.24.
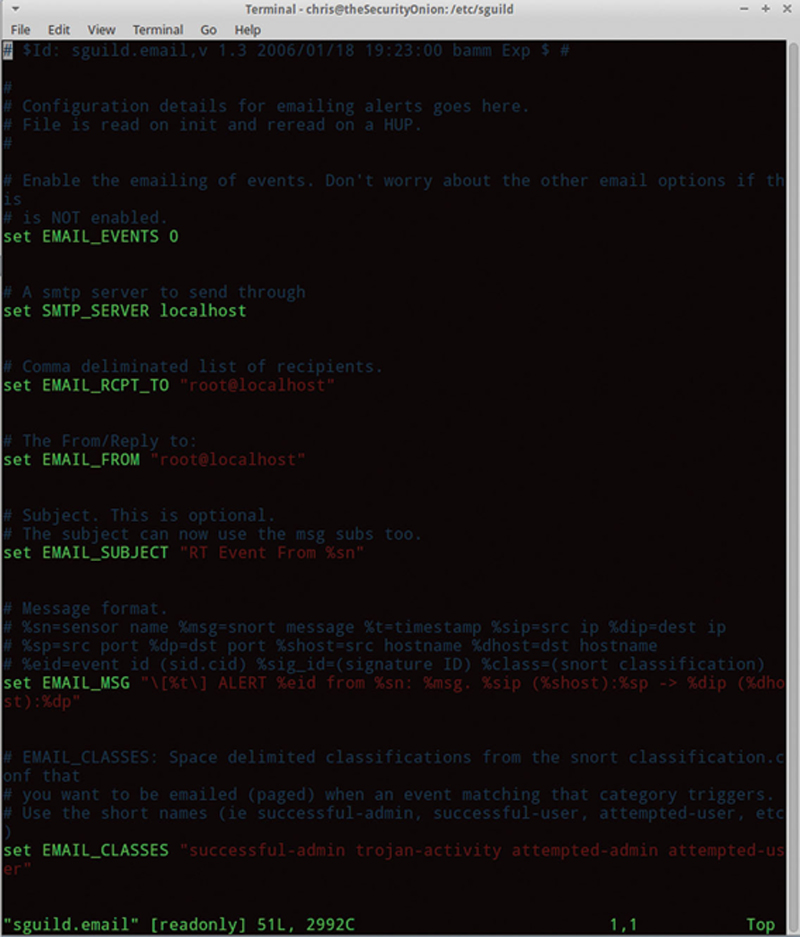
Figure 9.24 Example of an “Sguild” Log.
Edit your email account information and save, so Sguil will send you alerts. Now, launch Sguil from the desktop and choose sensor port to live monitor.
When you examine an event, the first column shows the classification of the event. By right clicking on the classification cell, the user can Create an AutoCat (automatic categorization) from this event. Next, the user can expire the event or expire the event with a comment. When the user selects update event status, they can reclassify the event. Furthermore, the user can perform a quick query of similar events of perform and advanced query (Fig. 9.25).
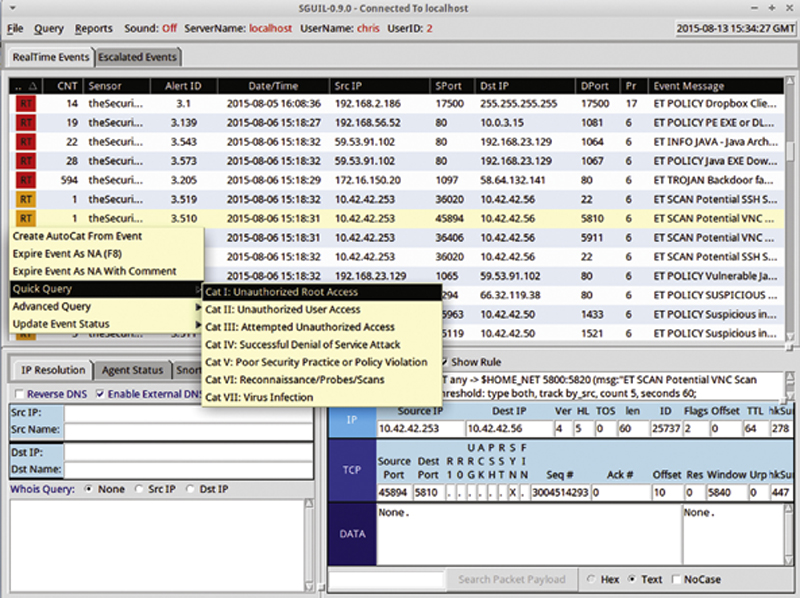
Figure 9.25 Classifying an Event for Documentation Purposes.
When the user creates an advanced query, they can query the database for like or similar events with modifiers. This is very useful for rapidly searching for relations (eg, same IP, same attack type, etc) (Fig. 9.26).
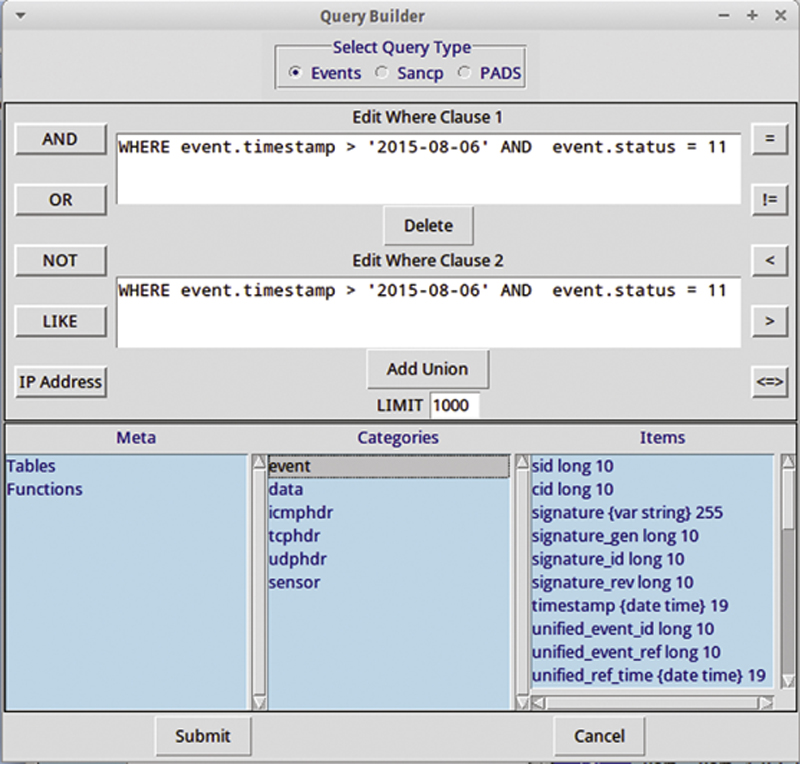
Figure 9.26 Useful Query Builder.
Next you will see the sensory source followed by Alert ID. The integer portion of the Alert ID is the sensor ID, and the fraction portion is the “Connected” ID. When we right click the Alert ID, we see the primary feature of Sguil, and that is the ability to follow the path around and alert. The best way to do this is to generate a Transcript from TCP-based session. If you sort the Destination TCP port and find a session around FTP (Port 21), then right click on the Alert, you can see different ways of following this alter. If you click on Transcript, Squil will reconstruct the control session for this FTP session, and you can “Spy” on how the hacker attempted to gain control (Fig. 9.27).
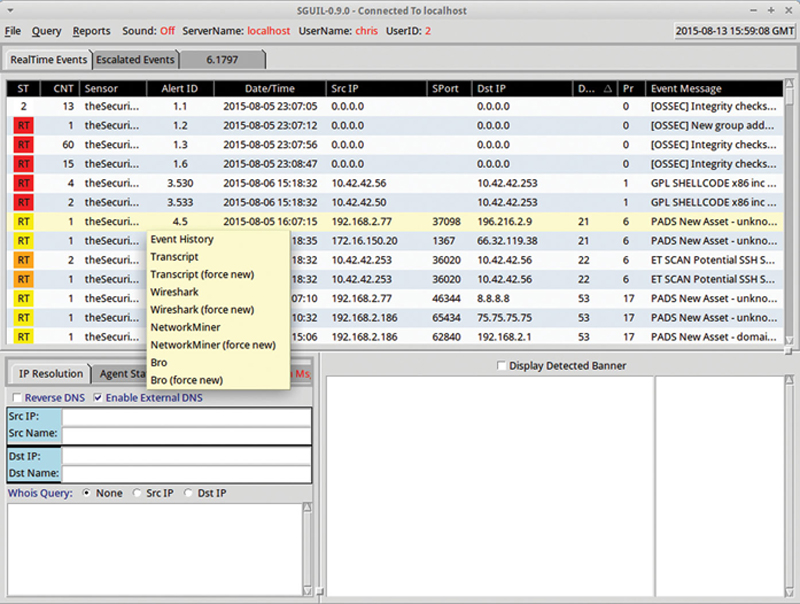
Figure 9.27 Show Event in Another Tool with Correlation.
When we look at the Transcript, we can see the session (Fig. 9.28):
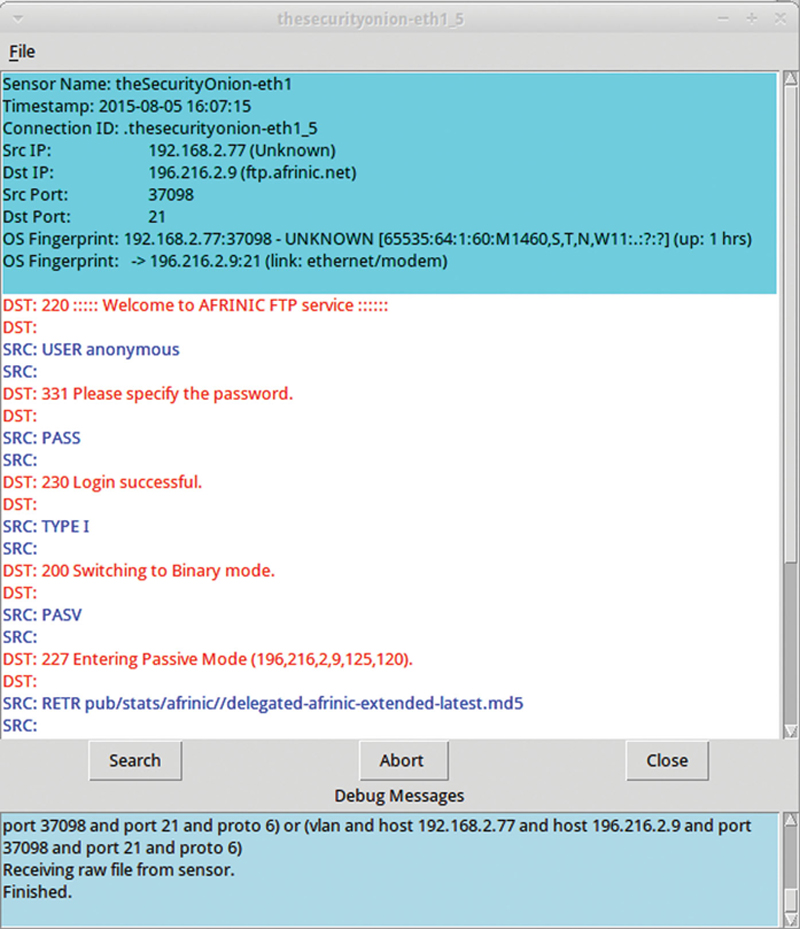
Figure 9.28 Drill Down of an Event.
You can then look from a packet perspective, by choosing Wireshark. From here, you can even reconstruct objects by using another tool from the context menu called Network Miner (Figs. 9.29 and 9.30).
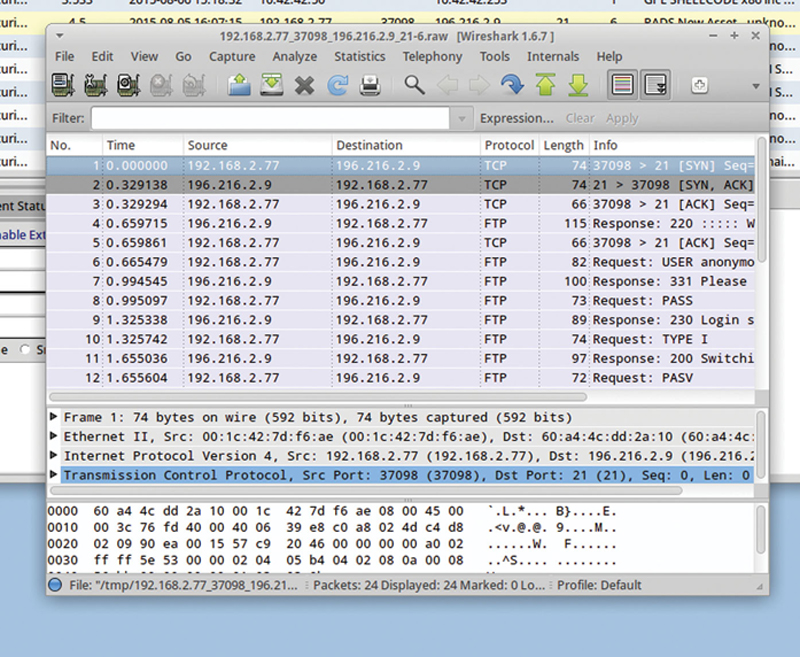
Figure 9.29 Showing Event in Wireshark.
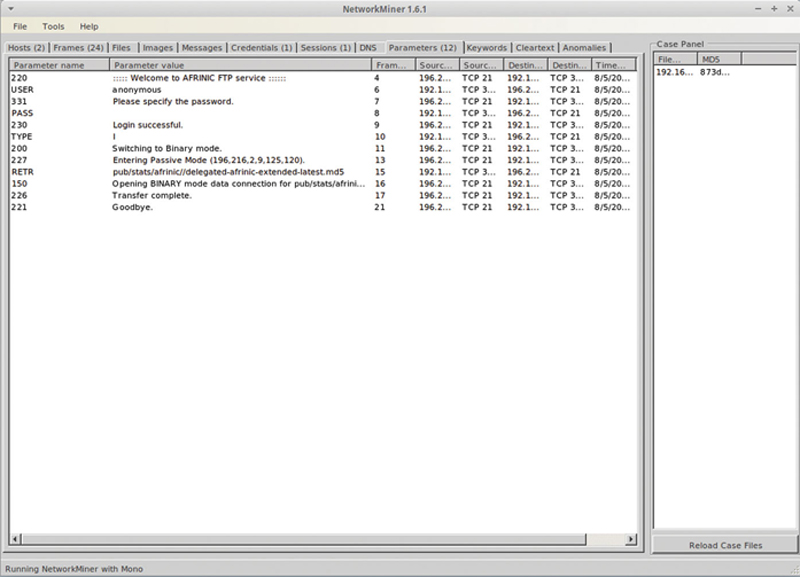
Figure 9.30 “NetworkMiner” Utility.
Finally you can characterize traffic using Bro. Utilizing this feature is very powerful because it allows you to data mine context around an event.
When you look at a source or destination IP, you can cross reference that IP or TCP Port number with other events, by right clicking and using the Advanced Query. In addition, you can get some visibility about the destination IP by selecting Dshield IP lookup> Destination IP. When you do this, you will query the IP address on the Internet Storm Center website. Information you can query here includes the hostname, country of register, AS name (and ISP), and the network block. At the top you can see the threat level, which is a rollup of known attacking sources (Fig. 9.31).
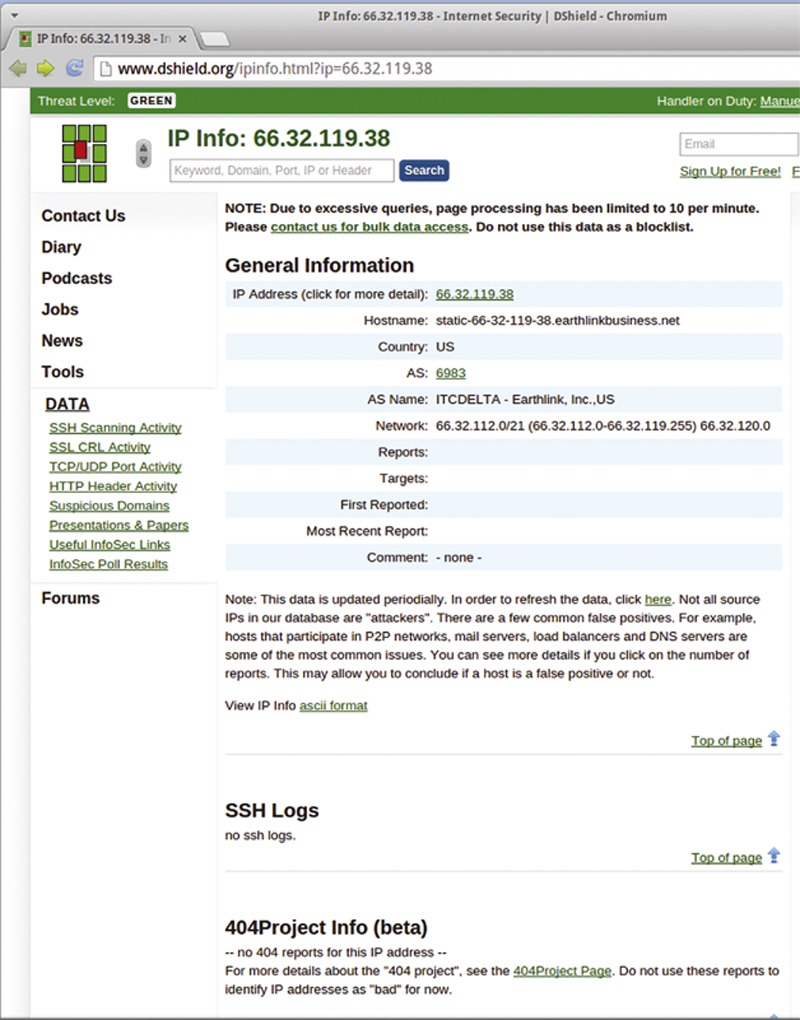
Figure 9.31 Using Shield for More Information About a Host.
Note, in your reporting phase for an attack, if you can identity of the ISP hosting the source attacker, and after collecting all your logs and data, contact the ISP and ask to talk with their network security department and report that one of their customers sourced an attack on the network.
Now, if you click on the destination port and use Dshield, by destination port, you can see if there is a general attack in progress. For example, port 80 attacks, a well-known port number where you will see frequent attacks, shows (Fig. 9.32):
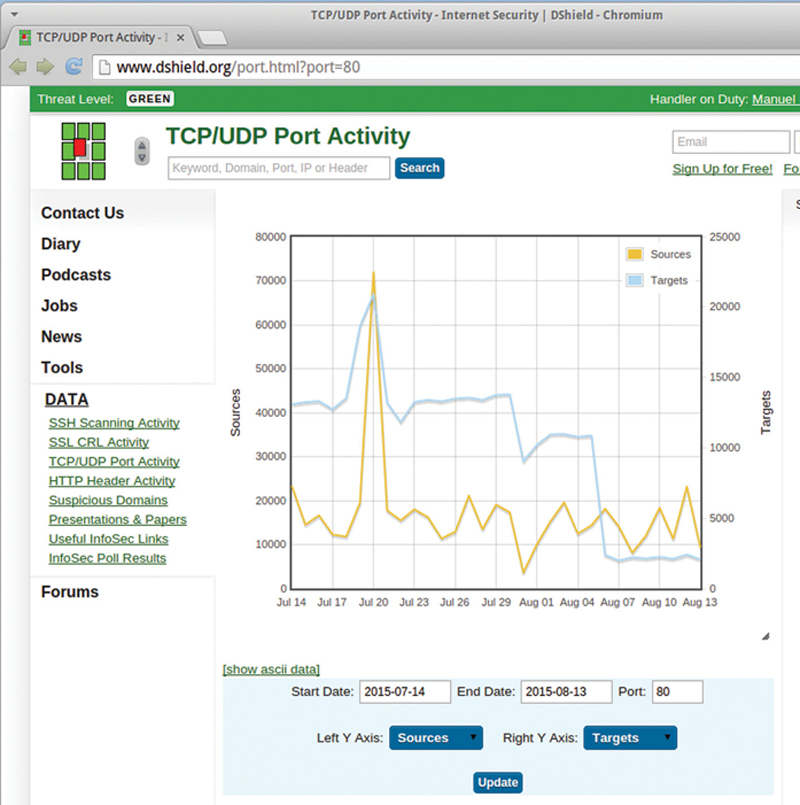
Figure 9.32 Showing Live TCP/UDP Port Activity.
When using Sguil, it is best to use it in conjunction with the other tools in Security Onion. Correlation of events across tools is a sure way of detecting a trend in attacks and discovering more complex scenarios.
Additional Tools in Security Onion
In addition to the four main tools, there are many command line tools available for detecting and analyzing security events. On the Security Onion desktop, if you click on the Blue menu icon, and then select Security Onion submenu, you will see a listing of additional tools available for your use.
In this menu, the distribution has pointed to the “man” of the various tools. When using tools, I always recommend reading the manual, or “man” pages to see what additional options are available for you to use in defense of your network.
Final Thoughts About Security Onion
Security Onion, in my opinion, is one of the best tools available for IPS/IDS and attack analysis. The distribution gives you very high quality open source tools. In addition, it goes the extra step of integrating them into a single distribution, with a unified update script, to make real-world analysis possible. The two main vectors of success with this are proper deployment of sensors in the network. Every security zone in the network should be monitored by a sensor. Second, having a full SNORT signature subscription will give you better and more complete coverage than only using the free community edition definitions. It is worth the investment. Remember, the system can’t detect what it cannot decode. Third, the system can only be successful if the correct number of resources are invested into the system, including time, personal, training, and process.