CHAPTER 4
Current Yield or Yield to Maturity?
Yield is one of the most basic of financial measures and one that strongly influences investor behavior. This is especially true for fixed income where return is mostly driven almost entirely by coupon income. Direct corporate loans also fall into this description. Other asset classes that distribute most or all their earnings, from whatever source, also rely on yield to inform investors about investment attractiveness. These include real estate investment trusts (REITs) and master limited partnerships (MLPs). While yield at first seems the most intuitive of concepts, investors find that it can take on unexpected complexity when applied in practice. Since direct lending returns depend almost entirely on their yield, understanding how yields are calculated is especially important.
There are two basic yield calculation methods, current yield and yield‐to‐maturity.
CURRENT YIELD
In earlier chapters references to direct lending yield used the current yield method. Current yield is calculated as the most recent quarter's interest income divided by average assets over the quarter. Assets are defined by their fair value in the current yield calculation, not their cost or principal value. For example, Cliffwater Direct Lending Index (CDLI) interest income during the 2017 fourth quarter totaled $2.3 billion on a fair value of assets that averaged $90.4 billion. Dividing income by assets gives a quarterly yield equal to 2.52%. We multiply the 2.52% quarterly yield by 4, to get a 10.1% annualized current yield.
Yield‐to‐Three‐Year Takeout
Total return fixed income investors often think of yield through the lens of yield to maturity or yield to worst, reflecting current income plus amortization of the difference between principal amount at maturity (or call date) and the fair value of the security. In other words, the yield to maturity (worst) calculation includes the amortization of unrealized gains and losses into its definition of yield.
The yield‐to‐maturity calculation is the more common method for expressing fixed income yield, but an underlying assumption is that principal value will be paid at maturity. This may not be true if the amortization of unrealized loss that is factored into the yield‐to‐maturity calculation is based on expected future credit losses. If it is, the yield‐to‐maturity calculation is assuming no credit impairment and represents the maximum return the loan could achieve. Current yield, on the other hand, assumes that current asset fair value is what will be realized upon maturity.
Both current yield and yield to maturity are used throughout this book. Current yield is the preferred calculation because of the view that current unrealized losses, equal to the difference between fair value and principal value, are expected future credit losses and should not enhance yield as it does in the yield‐to‐maturity calculation. Loan yield to maturity is also shown in many examples because it may be more appropriate when making yield comparisons to other asset classes or where a measure of yield that is gross of credit losses is called for.
Unlike current yield, the calculation for yield to maturity explicitly incorporates a maturity date, or date when loan proceeds are repaid. While most direct loans have a five‐year stated maturity, refinancings, prepayments, and corporate actions have historically reduced their average or effective life of approximately three years. As such, a yield‐to‐three‐year‐takeout calculation is used for direct loans. When fair value is less than principal value, the difference, unrealized losses, are effectively amortized over a three‐year horizon and added to current yield. In the less frequent case where fair value exceeds principal value, unrealized gains are amortized over a three‐year horizon and subtracted from current yield.
A yield‐to‐three‐year‐takeout calculation for the CDLI requires both principal and fair value. We calculate these values by aggregating the individual principal and fair asset values reported on quarterly financial statements. Exhibits 4.1 and 4.2 illustrate how differences between fair value and principal value create differences between current yield and yield‐to‐three‐year‐takeout for the CDLI.
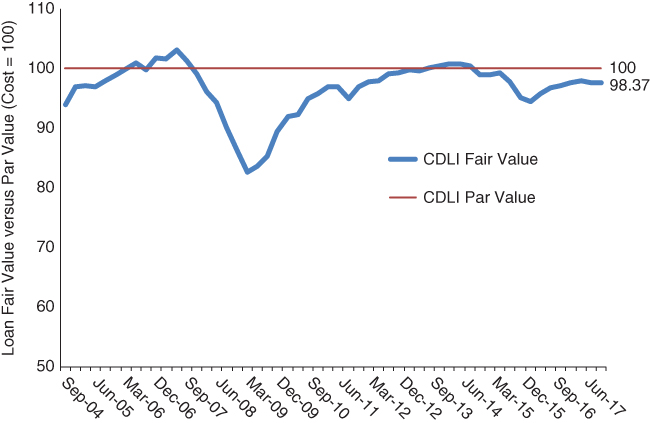
EXHIBIT 4.1 Direct loan fair value versus par (principal) value.
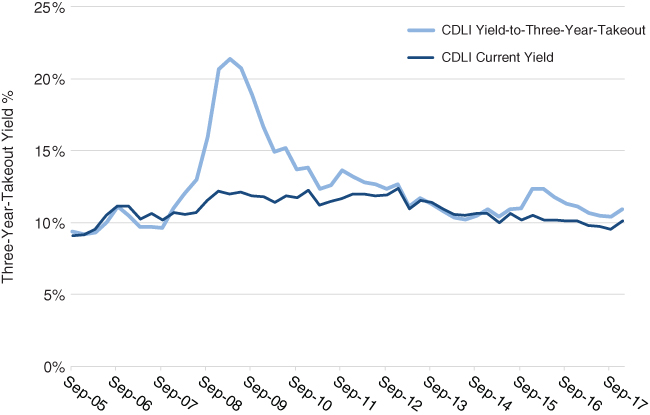
EXHIBIT 4.2 Current yield and yield‐to‐three‐year‐takeout for the Cliffwater Direct Lending Index.
Loan fair value generally remains below principal or par value due to expectations for future defaults. The few instances where fair value climbs above principal value are when credit conditions for loans have improved to an extent that default expectations are below what was expected at loan origination. The pattern of fair versus principal value shown in Exhibit 4.1 shows that when it comes to the fair value of non‐investment‐grade loans, potential downside exceeds potential upside.
Exhibit 4.2 compares current yield and yield‐to‐three‐year‐takeout for the CDLI. Whenever loan fair value dips below principal value as shown in Exhibit 4.1, the yield‐to‐three‐year‐takeout (yield‐to‐maturity) for direct loans exceeds the current yield. The difference is the amortization of the fair value discount over a three‐year assumed effective loan maturity. This difference was very significant in 2008 when the CDLI yield‐to‐three‐year‐takeout exceeded 20% while CDLI current yield climbed to just 12%. A more recent yield divergence occurred during the 2016 Oil Crisis when the energy sector entered recession and fair values for oil and gas loans were reduced. Current yields were modestly impacted, but yield‐to‐three‐year‐takeout jumped again under the calculation assumption that the fair value discount would be eliminated in three years.
High‐yield bonds and broadly syndicated (also called leveraged) loans are the closest to US middle market corporate direct loans from an investment perspective. All three expose investors to significant credit risk but compensate investors by offering higher yield. Consequently, yield comparisons between the three are relevant.
The most quoted yield for high‐yield bonds is yield‐to‐worst, a measure akin to yield‐to‐three‐year‐takeout because it also amortizes differences between the current price and par value over the expected life of the bond. Exhibit 4.3 provides a yield comparison of direct loans (represented by the CDLI) and high‐yield bonds (represented by the Bloomberg Barclays High Yield Bond Index). In addition to absolute yield levels, the yield spread between the two asset classes is displayed as an indication of relative value. Yields are presented gross of fees and expenses.
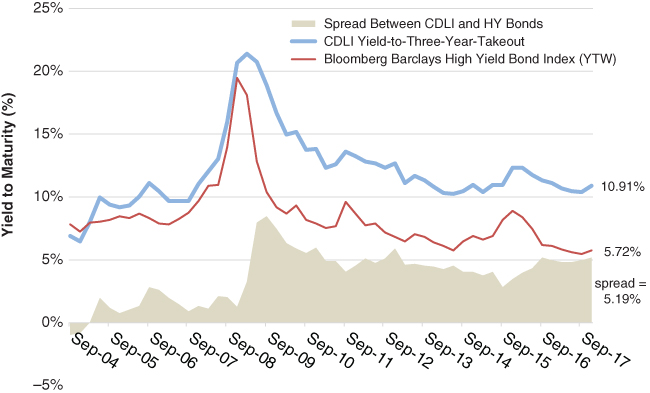
EXHIBIT 4.3 Yields and yield spreads for direct loans and high‐yield bonds.
The top line in Exhibit 4.3 plots the yield‐to‐three‐year‐takeout for the CDLI, and the bottom line plots the yield‐to‐worst for the Bloomberg Barclays High Yield Bond Index. These apples‐to‐apples yields for direct loans and high‐yield bonds follow a very similar pattern, suggesting that underlying corporate credit conditions over time are impacting both the public high‐yield market and the private middle markets in a similar way. It also shows that investors in the private, direct loan market have earned yields significantly higher than investors in publicly traded high‐yield bonds. This yield spread, equal to 5.19% at December 31, 2017, is likely understated because higher yields are attached to high‐yield bonds due to interest rate risk from fixed coupons and lower credit quality.
Yields on leveraged loans are added in Exhibit 4.4, and the S&P/LSTA Leveraged Loan 100 Index is used to represent the leveraged loan market. Yields on leveraged loans are lower than high‐yield bonds because they are floating rate, like direct loans, and therefore lack the term‐structure premium found in fixed‐rate bonds. Leveraged loans are also generally of higher credit quality compared to high‐yield bonds because they are generally in a more senior capital structure position.
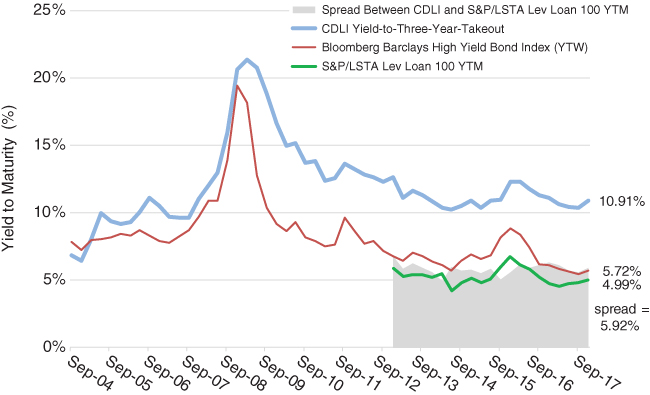
EXHIBIT 4.4 Yields and yield spreads for direct loans, high‐yield bonds, and leveraged loans.
Leveraged loan yields are shown in the lower shortened line in Exhibit 4.4 and go back to December 31, 2012, when they were first available. As expected, direct loans have a consistently higher yield spread against leveraged loans compared to high‐yield bonds. At year‐end, December 31, 2017, the CDLI yield spread against leveraged loans equaled 5.92% compared to 5.19% for high‐yield bonds. Yield comparisons to leveraged loans is likely a fairer comparison but the popularity of high‐yield bonds brings demand for comparisons as well.
The yield comparisons above are gross of management fees and expenses. While the fees and expenses associated with direct lending are discussed in considerable detail in later chapters, as a general observation the fees associated with direct lending are roughly 2.0% of assets and 0.5% of assets for traded leveraged loans and high‐yield bonds. The higher fees for direct lending are associated with the considerably higher costs associated with originating and structuring middle market direct loans versus transacting in bonds and leveraged loans via exchanges or dealer desks. Consequently, the roughly 5–6% yield spread differences reported in Exhibits 4.3 and 4.4 should be adjusted downward to a 3.5–4.5% range for an equivalent after fee comparison.