CHAPTER 7
Credit as a Separate Asset Class
Investors are just beginning to identify credit as a separate asset class, driven by expanded and attractive post–global financial crisis (GFC) credit opportunities, and as an alternative to the low yields currently found in traditional fixed income.
Historical data shows that credit has favorable and sustainable return and risk characteristics that are differentiated from other asset classes, favoring a separation from traditional fixed income in asset allocation studies. In this chapter traditional mean–variance analysis is used to show that optimal allocations to credit range from 10% to 20% for most institutional investors, and that roughly two‐thirds of the funding for a credit allocation should come from fixed income, with the remainder from equity.
Investors enjoy an increasing range of credit opportunities, particularly private offerings, when constructing a credit portfolio. Many of these private credit opportunities are cataloged below and our earlier findings suggesting a 3–4% higher return for private credit when compared to public credit are reviewed in the context of asset allocation.
For much of the past 40 years investor exposure to credit has been mostly indirect, through allocations to fixed income strategies replicating or tracking broadly diversified benchmarks such as the Bloomberg Barclays Aggregate Bond Index.1 Today, credit‐related securities, primarily corporate bonds, represent 28% of the market value of the index and 26% of total index risk.2 As a result, credit exposure within core fixed income portfolios will likely be limited to less than 5% of total assets, restricted to investment grade, and determined by rules governing index constitution rather than investor preference.3
The emergence of traded high‐yield bonds in the 1980s and syndicated bank loans in the 1990s has allowed investors to diversify directly into securities whose returns are driven primarily by credit risk, rather than a combination of credit risk and interest‐rate risk. Allocations to these securities are growing but remain small.4
The GFC has had a lasting and profound impact on the financial sector and, as a result, has expanded opportunities for credit investors, particularly within private credit. The most important post‐crisis change for private credit has been increased bank regulation, which created a range of new or expanded opportunities for nonbank lenders. One example is the rise of US direct middle market lending. The growth of asset‐backed lending is another example of expanded avenues of nonbank financing post‐GFC.
This chapter (i) uses traditional portfolio theory to provide a rationale for credit as a separate asset class, (ii) uses mean–variance technology to identify optimal portfolio allocations to credit, (iii) catalogs credit alternatives, both public and private, that might be included in credit only allocations, and (iv) presents a framework for structuring a credit allocation.
WHAT IS AN ASSET CLASS?
An asset class is defined as a group of securities that share similar characteristics, or common risk factors. Further, academics and practitioners limit asset‐class status to securities that by their nature produce a significant and persistent return above cash precisely because their associated risks can't be diversified away.5 Equities, fixed income, and cash6 have traditionally been identified as the three major asset classes. On the other hand, by this definition securities like physical commodities, currencies, and hedge funds would not achieve asset‐class status.
Credit meets the traditional asset class definition because its primary risk – the probability of borrower default – can't be diversified away, and consequently the market provides investors significant returns above riskless cash as a reward. Exhibit 7.1 provides historical returns and risks for investing in equity, US Treasuries (i.e., interest‐rate risk), and three categories of liquid corporate credit.7
EXHIBIT 7.1 Return and risk for interest rates, equity, and credit, December 31, 1999 to September 30, 2017.
| Credit | ||||||
| Interest Rates | Equity | Investment‐Grade (IG) Corporates | Bank Loans (BL) | High‐Yield (HY) Bonds | ||
| Description | Time value of money | Compensation for uncertain earnings and multiples | Compensation for default risk | Compensation for default risk | Compensation for default risk | |
| Measurement | 10‐year Treasury | Russell 3000 Index | Bloomberg Barclays Investment Grade Corporate Bond Index | S&P/LSTA Leveraged Loan Index | Bloomberg Barclays High‐Yield Bond Index | |
| Total return | 5.24% | 5.56% | 6.12% | 4.91% | 7.37% | |
| Minus duration adjustmenta | 0.00% | 0.00% | −3.21% | 0.00% | −2.65% | |
| Minus 30‐d T‐billsb | −1.75% | −1.75% | −1.75% | −1.75% | −1.75% | |
| Excess return | 3.49% | 3.81% | 1.16% | 3.16% | 2.97% | |
| Excess risk | 7.32% | 15.07% | 5.11% | 6.35% | 11.14% | |
| Excess return/risk | 0.48 | 0.25 | 0.23 | 0.50 | 0.27 | |
| Correlations: | ||||||
| Term structure | 1.00 | −0.33 | −0.42 | −0.35 | −0.49 | |
| Equity | 1.00 | 0.61 | 0.50 | 0.70 | ||
| Credit (IG) | 1.00 | 0.76 | 0.86 | |||
| Credit (BL) | 1.00 | 0.80 | ||||
| Credit (HY) | 1.00 | |||||
All return and risk data is annualized. Risk is calculated as annualized standard deviation of excess return.
aHistorical return attributable to Bloomberg Barclays Investment Grade and High Yield Bond Index durations, respectively, and calculated by monthly adjustments of the Treasury bond excess returns to equal the same duration as the Investment Grade and High Yield Bond Index durations, respectively. (Source: Bloomberg Index Services Limited.)
bICE BofAML 3 Month T‐bill Index.
The first two columns in Exhibit 7.1 provide historical return and risk data for interest rate and equity risk. The last three columns show the same data for three different categories of liquid credit investments, with increasing levels of credit risk: investment‐grade bonds, broadly syndicated bank loans, and high‐yield bonds. Investment‐grade bonds represent the lowest credit risk level. Bank loans are senior secured debt but considered non‐investment grade in quality because interest coverage and debt ratios compare less favorably to investment‐grade debt. Finally, high‐yield bonds represent primarily subordinated, higher‐risk debt.
Excess return is shown in the first highlighted row and measures the portion of total return that is solely attributable to the type of beta risk identified by the column. Excess return is also commonly referred to as risk premium and is generally calculated by subtracting the risk‐free rate (30‐day T‐bill return) from total return. However, in the case of investment‐grade and high‐yield bonds there is an interest‐rate risk factor as well as a credit‐risk factor embedded in total returns. We strip out interest‐rate risk by subtracting Treasury bond returns – in excess of three‐month T‐bill returns – whose durations equal those of investment‐grade and high‐yield bonds. This duration adjustment results in lowering returns by −3.21% and −2.65% for investment‐grade and high‐yield bonds, respectively. No duration adjustment is needed for bank loans because interest income is based on a floating rate that typically adjusts every 30 or 90 days, and not a fixed rate.
Excess returns for all three credit measures are positive but below excess returns for the interest rate and equity asset classes. More relevant are risk‐adjusted excess returns, measured by excess return divided by excess risk. Bank loans and interest rates had the highest excess return/risk ratios, equal to 0.50 and 0.48, respectively, while equity, investment‐grade credit, and high‐yield bonds produced lower ratios of 0.25, 0.23, and 0.27, respectively.
Exhibit 7.1 also reports correlations of excess returns between interest rates, equity, and the three credit categories. Not surprisingly, the three credit measures have high cross correlations, ranging from 0.76 to 0.86. Also, the three credit measures not only have negative correlations with interest rates, but they are of a higher magnitude than equities. Finally, as expected, the correlations between the credit categories and equity are significantly positive, ranging between 0.50 and 0.70, but low enough to achieve meaningful diversification benefits.
Experience with other studies suggest that measures of return and risk will vary depending upon the time studied. Nonetheless, a key finding is that credit risk provides investors a significant positive excess return over time that has a low correlation to interest rate and equity excess returns, and therefore should be treated as a separate asset class for asset allocation purposes.8
CREDIT AND ASSET ALLOCATION
Traditional mean–variance tools are used to plot optimized allocations for equity, interest rates, and credit in Exhibit 7.2.

EXHIBIT 7.2 Optimal allocations to stocks, interest rates, and credit.
Risk and correlation inputs come from the historical data provided in Exhibit 7.1. A single credit portfolio is created by equal weighting of the investment‐grade, bank loan, and high‐yield bond subclasses. Return inputs, however, are not the historical returns provided in Exhibit 7.1, but instead rely upon expectations of future excess returns. This departure is due to the unusually high historical excess return to 10‐year Treasuries, attributable to the significant decline in interest rates over the measurement period that, at current levels, is very unlikely to be repeated. Excess‐return optimization inputs are 4.75% for stocks, 0.50% for interest rates, and 2.56% for the equal‐weighted credit portfolio. Total expected returns are 6.60%, 2.35%, and 4.41% for stocks, interest rates, and credit, respectively, when our 1.85% expected return for T‐bills is added to expected excess returns.
Note that expected excess returns are lower for interest rates, higher for equity, and about the same for credit compared to 2000–2017 historical values. Expected excess returns reflect much more modest return expectations for interest rate returns, given their current historically low level, and somewhat higher excess returns for equity that are more consistent with longer‐term historical data.
Exhibit 7.2 reports optimized allocations to stocks, Treasuries, and credit over a range of risk levels from 8.4% to 13.8%.9 Exhibit 7.2 identifies allocations of 70.7%, 15.2%, and 14.1% for equities, Treasuries, and credit, respectively, as optimal allocations for the average risk level found for state pension plans.
The analysis shows that the optimal portfolio for the average‐risk institutional investor (i.e., at the 11.1% risk level) includes separate and distinct allocations of 15.2% to interest rates (via 10‐year Treasury bonds) and 14.1% to credit.10 The optimal portfolio for lower‐risk institutions (i.e., 8.5% total portfolio risk) allocates roughly 25% to credit, while the most aggressive institutions would have less than 5% allocated to credit. Credit is squeezed out for the aggressive institutional investor because stocks provide the highest excess return and interest rates are a better diversifier for a portfolio with a high stock allocation. However, most institutional investors would have optimal allocations to credit ranging between 10% and 20% based upon their historical risk levels and optimization outcomes.
A related question for investors without credit allocations is the optimal sourcing of funds for a newly created credit allocation. The optimization sources 60–66% of the funding for credit from fixed income and the remainder from equity. At the 11.1% average state pension risk level, 8.8% of the 14.1% optimal credit allocation would come from 10‐year Treasuries and 5.3% would come from US stocks.
While Exhibit 7.2 lacks the asset class complexity found in most institutional portfolios, the allocation guidance presented should assist those investors who want to establish a separate credit allocation.
PRIVATE CREDIT OPPORTUNITIES
The analysis above includes only liquid asset classes. Prior to 2008, institutional credit portfolios consisted primarily of allocations to traded high‐yield bonds and/or bank loans, with perhaps modest and infrequent investments in private credit. After 2008, opportunities in credit expanded in size and type, as illustrated in Exhibit 7.3.11
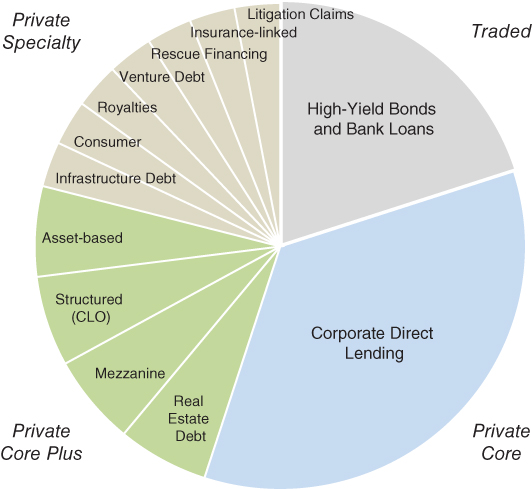
EXHIBIT 7.3 Public and private credit opportunities by type.
Exhibit 7.3 catalogs multiple types of credit assets grouped into four subclasses. The first is traded or liquid credit of the type examined in Exhibit 7.1. The second is corporate direct lending, which we define as private core investments. These are corporate loans to middle market companies without an intermediary bank or broker and are generally considered as the lowest risk among private credit alternatives. The third subclass is private core plus and includes four credit asset types sometimes found in larger credit portfolios. This subclass represents potentially higher return investments through greater leverage, sector, or subordination risks.
Finally, a broad range of credit‐related assets is listed under the subclass umbrella called specialty credit opportunities. These may be less well known to investors, often requiring special expertise, and are investable less frequently because market opportunities are smaller. The attractiveness of specialty credit opportunities includes both the possibility of higher returns and a lower correlation to the broader credit markets. Royalties, litigation, and insurance‐linked investments are often cited as examples of lower correlation credit opportunities.
The allocations reflected in Exhibit 7.3 are for illustrative purposes only. The chart is intended to identify the subsectors within the public and private credit opportunity set and not recommended allocations. From a practical perspective it would be difficult to implement high allocations to the core plus and specialty investments, leaving traded and private core together likely representing a significant proportion of a composite credit portfolio allocation. Exhibit 7.4 provides a brief description of each credit opportunity.
EXHIBIT 7.4 Credit opportunity descriptions.
| Credit Opportunity | General Description | Characteristics |
| High‐yield bonds | Subordinated, unsecured traded bonds, typically issued by corporations. | Higher‐risk, fixed‐rate debt |
| Bank loans | Leveraged loans broadly syndicated by banks. | Floating rate + spread |
| Corporate Direct Lending | Directly originated by nonbank entities, typically senior secured loans to middle market companies. | High current income, low losses and volatility, underwritten to earnings before interest, taxes, depreciation, and amortization (EBITDA). |
| Real Estate Debt | Loans collateralized by real estate. Typically takes the form of (i) a whole loan with the senior portion syndicated to a bank partner or (ii) a mezzanine unsecured loan. | Hard asset collateral, higher loan‐to‐value (LTV) range of 60–90% vs. 50–60% for corporate debt. |
| Mezzanine | Directly originated corporate loans subordinate to senior debt. Can be secured by assets or unsecured, but have priority to equity. | Focus on total return, combination of cash and payments‐in‐kind (PIK) income, plus equity warrants. |
| Structured (collaterized loan obligation, CLO equity) | Typically, highly leveraged investments in lower‐risk credit collateral. | High, but risky cash flow. |
| Asset‐based | Debt backed by assets; collateral may include hard assets and/or financial assets such as trade claims and receivables. | Rapid amortization, short duration, typically self‐liquidating, underwritten to asset value, not cash flow. |
| Infrastructure Debt | Senior and mezzanine debt investments backed by infrastructure assets. | High quality, hard asset collateral with long‐term contractual cash flows. |
| Consumer | Loans to consumers either originated on an individual basis or rediscounted lending to platforms that originate consumer loans. | Short duration, very granular portfolios, typically self‐liquidating. |
| Royalties | Investments in intellectual property (IP) rights with credit‐like cash flow characteristics or debt investments to companies collateralized by intellectual property rights. | Uncorrelated to credit markets, typically healthcare, entertainment or other IP rights. |
| Venture Debt | Loans to venture, capital‐backed companies that are typically not yet profitable. Investments can be a combination of cash and PIK income plus equity/warrants. | Private equity‐type upside return profile with baseline contractual return from the debt component. |
| Rescue Financing | Senior debt provided to a company in or approaching bankruptcy. | High returns but higher risk, short duration, super senior debt, typically not a standalone strategy. |
| Insurance‐linked | Sale of reinsurance policies tied primarily to weather events and other natural disasters. | Short duration, cyclical, uncorrelated, and potentially high losses from catastrophes. |
| Litigation Claims | Third‐party funding to pursue litigation in exchange for a share of future settlement/award proceeds. | Short duration, 6–24 mo; uncorrelated with other credit assets. |
Ongoing research in the financial literature has centered on the relative performance of private assets compared to equivalent public assets.
Research into private equity performance shows a significant and persistent 4% incremental return for private equity compared to public equity, when measured over full market cycles.12 This historical level of outperformance is consistent with early (1980s) investor benchmarks for private equity targeting the S&P 500 Index +3% returns over longer time periods. Research also finds that institutional private equity investors have been able to achieve this target.
The institutional performance of private real estate compared to public real estate (equity real estate investment trusts, REITs) is less conclusive. On average, cap rates for private real estate exceed public REIT dividend yields by 2% over time13 but actual private real estate performance achieved by institutional average return falls below REIT returns.14 A premium return potentially exists for private real estate but has not been systematically captured due to poor manager implementation.
Allocation decisions involving private assets, whether equity, real estate, or credit, are challenging, with no commonly accepted approach. Liquidity penalties, public proxies, and risk unsmoothing processes are some of the ways that practitioners try to fit private assets into the traditional, mean‐variance framework underpinning most asset‐allocation studies. Almost always, unconstrained optimization results in a high and uncomfortable allocation to private assets that are then reduced by imposing constraints on the maximum allocation to private assets.
The most useful approach is to identify an enterprise‐specific, maximum allocation to private investments and then allocate that capacity to asset classes where private investing offers the greatest risk‐adjusted opportunity.
Assuming sufficient capacity for privates, research and experience suggests that institutions with longer investment horizons should consider allocating most of their credit allocation to private credit due to (i) past performance for private credit, driven by higher yield, that has been consistently above liquid credit, (ii) better clarity on future performance because investments are yield‐driven rather than capital gains driven, and (iii) the reduction in liquidity for private credit investments is expected to be much less severe than private equity or real estate due to a shorter effective life.
Credit markets have evolved to a stage where investors should identify credit as an asset class separate from equity and interest rates. These liquid and illiquid credit opportunities offer characteristics not generally found in standard asset classes, such as higher current yield and lower volatility. Important as well are opportunities for value accretion through active management, primarily focused on minimization of credit losses, as past performance of individual private credit managers suggests that active management has significant potential to add incremental value in private credit.
As general guidance, research suggests a separate 10–20% allocation to the credit asset class, comprised principally of private credit investments. However, enterprises with greater cash demands or shorter dated liabilities might consider higher allocations.15 Credit benchmarks linked to a public index such as the S&P/LSTA Leveraged Loan Index plus a spread are reasonable, but investors with high private credit allocations should consider an index of private investments such as the Cliffwater Direct Lending Index (CDLI) or a peer universe of private credit funds.