CHAPTER 16
Direct Lending and J‐curve Mitigation
Building a private equity portfolio, or increasing current allocations, can frustrate investors due to negative or low returns in the early years of investment. This is known as the J‐curve, attributable to upfront loading of organizational costs, management fees paid on undrawn fund commitments, and a lag in profit generation associated with growth‐oriented equity strategies. As a result, investors in private equity often feel they are taking one step back before taking two steps forward. The J‐curve is also frustrating because cash flow is significantly negative for several years when investing in private equity because there is no cash interest to distribute to investors and it takes five to eight years before companies are eventually sold and proceeds distributed to investors.
The J‐curve effect elevated liquidity problems for many of the largest private equity investors during the 2008 global financial crisis (GFC). Commitments to private equity funds reached peak levels during 2006 and 2007, creating large unfunded liabilities in the form of contingent capital calls, just before the GFC. When the GFC hit, not only did these funds see their asset values go to distressed levels, squeezing the availability of liquid assets to meet benefit or spending payouts, but their private equity, unfunded commitments became a big concern, particularly given the drying up of private equity distributions. Many of the largest institutional investors needed to go to the secondary market and sell partnership interests to get the cash needed to meet their obligations. The J‐curve effect is equally about liquidity as it is the pattern of performance.
Corporate direct lending funds display far fewer J‐curve characteristics compared to those found in other private closed‐end funds because management fees are generally paid on invested and not committed capital, the investment pace is faster, thereby dampening the performance impact of organizational costs, and profit generation is immediate from current cash yield. This friendlier behavior is illustrated in Exhibit 16.1 where cumulative internal rates of return (IRR) for buyout and direct lending funds over a five‐year period, which is the time period for which both direct lending and buyout fund performance data is available.
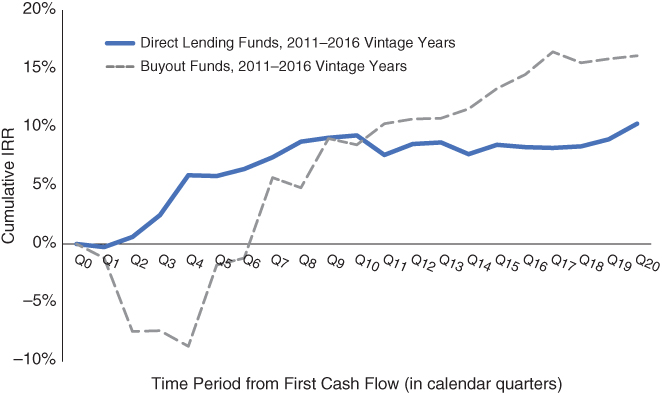
EXHIBIT 16.1 J‐curve comparison for direct lending and buyout funds.
Performance in Exhibit 16.1 is based upon 295 private funds, divided into a group of 12 that engaged in direct lending and 283 that involved corporate buyout strategies. Funds in the database are those that have been tracked quarterly by Cliffwater.
In Exhibit 16.1 the quarters have been aligned so that the Q1 performance reflects the median first quarter of performance across the vintage years and the Q2 performance reflects the median cumulative first and second quarters of performance across the vintage years. This process was repeated for each subsequent quarter. All return calculations are after fund fees and expenses.
The dashed line in Exhibit 16.1 represents the median cumulative (from inception) IRR for buyout funds and is comprised of 2011 to 2016 vintage year funds. For example, vintage 2011–2016 buyout funds reported a −8.75% median IRR after one year and a 4.81% median IRR after two years. After four years, performance stabilizes at the 15% range. By comparison, the solid line in Exhibit 16.1 represents the median cumulative (from inception) IRR for the direct lending funds and is comprised of 2011 to 2016 vintage year funds. The direct lending funds report a small −0.90% median IRR after one quarter and thereafter IRR turns positive. After one year the direct lending fund median IRR equals 6.05% and quickly reaches its equilibrium IRR at approximately 9%.
The data represented in Exhibit 16.1 support the view that private direct lending funds most likely display performance trajectories that differ substantially from other private funds, with positive returns during early years, tapering to high, single‐digit IRRs shortly thereafter. By contrast, buyout funds experience typical J‐curve negative IRRs in early years, leading to double‐digit returns after three to five years.
Direct lending funds also display shorter investment periods compared to buyout funds and generally use all investor capital. It is not uncommon for direct lending funds to become fully invested after a couple years while buyout funds can take three to five years to fully invest, if they draw all their committed capital. Direct lending returns may be lower compared to buyout funds, and private equity generally, but they display a more efficient use of investor capital in the form of faster drawdowns and distributions. This characteristic also makes for greater predictability in cash flow planning.