EXPERIMENTAL INVESTIGATION AND MATHEMATICAL MODELING OF COLD CAP BEHAVIOR IN HIGH-LEVEL-WASTE GLASS MELTER
Pavel Hrma
Pacific Northwest National Laboratory Richland, WA 99352 USA
ABSTRACT
The cold cap is a layer of reacting melter feed floating on the surface of molten glass in a glass-melting furnace. The cold cap consists of two distinct portions, the upper portion which allows the reaction gases to escape through open pores, and the lower portion which traps the gases within the continuous glass-forming melt, creating foam. The temperature span over the cold cap is ~1000 K. Data needed to simulate the cold cap mathematically include the kinetics of multiple reactions, reaction enthalpies, heat capacity, density, porosity, and heat conductivity as functions of both the temperature and the rate of heating. These data were produced via crucible experiments. The mathematical model has been completed. It relates the cold cap thickness, the rate of melting, the temperature field, and cold cap structure (foaming, dissolution of quartz particles, and formation and subsequent dissolution of crystalline phases, such as spinel) to the cold cap bottom temperature, the fraction of heat flow to the upper cold cap surface, the melt foaminess, and the chemical and physical nature of melter feed materials. To verify the model, cold caps were produced in a laboratory-scale melter and their structure is currently investigated.
INTRODUCTION
The cold cap, or batch blanket, floats on the glass melt surface in all-electric glass melters. The cold cap appears necessary for optimum melting of nuclear waste glasses. For example, it reduces volatilization of radioactive components, such as Cs, Tc, or I. The temperature span across the cold cap, within which batch reactions are completed and melter feed is almost fully converted to molten glass, is up to 1000 K. Whereas batches for commercial glasses are fully controlled with respect to their chemical and physical makeup, feeds for nuclear waste glasses contain 20 to 50% waste, the composition of which is given by the past treatments of spent fuel,1 and the rest consists of additives that supply glass-forming and -modifying components needed for the glass to achieve desirable properties; hence, only the additives are available for cold cap optimization. However, the chemical and physical form of the additives, which are supplied as a mixture of chemicals and minerals or as a premelted frit, can have a substantial impact on cold cap behavior and the rate of melting.
The feed-to-glass conversion is controlled by the heat transfer. The principal portion of heat comes to the cold cap from molten glass, where it is delivered via electric power dissipation (the current is conducted from electrodes or induced by alternating magnetic field). The heat is transferred to the cold cap bottom by natural or forced convection (bubbling or mechanical stirring) and then conducted to the interior portions of the cold cap. Additional heat is transferred to the cold cap from the plenum space, boosted by lid heaters in some melters.
In this brief review of our recent work, we focus on a cold cap in a Joule-heated melter charged with a slurry of waste blended with glass additives in the form of chemicals and minerals. Such a cold cap consists of two distinct portions.2 The upper portion allows the reaction gases to escape through open pores to the atmosphere. The lower portion traps the gases within the continuous glass-forming melt and contains multiple solid particles, both dissolving and precipitating. Cold caps from feeds containing glass frit and calcined waste produce less gas, but gas bubbles, which originate from residual batch reactions (primary foam) and from redox reactions within the melt (secondary foam), tend to accumulate under all cold caps and hinder the heat flow from the molten glass underneath.2 The cold cap structure is illustrated in Figure 1. It has been proposed2 (see Figure 1) and experimentally demonstrated3 that bubbles in both primary and secondary foam coalesce and merge into larger cavities that eventually burst into the plenum space above the cold cap.
The rate of heat transfer through the melt has been greatly enhanced by introducing forced convection into the melt via bubbling.4 Large bubbles ascending from the bubblers bring the hot melt directly to the cold cap, remove foam, increase the temperature of the space above the cold cap, and possibly stir a small fraction of cold cap material into the hot glass. As a result, the rate of melting is increased several times. Further substantial increase in the rate of melting can be achieved by a proper formulation of the melter feed.5 While little can be done with the form of the waste other than basic pretreatment that separates waste components into waste streams, chemical and physical forms of additive ingredients can be optimized.5,6 The goal is to minimize primary foam through releasing most if not all batch gases before the glass-forming melt becomes connected2 while delaying the development of a continuous glass-forming melt before the batch gases are fully released.
The following sections describe the measurement and mathematical representation of data needed for the cold cap model and selected model results. The feed selected for modeling was formulated for a high-alumina high-level waste.2,6
REACTION KINETICS
The cold cap contains multiple phases: molten salts (mainly nitrates and nitrites), amorphous and crystalline solids (carbonates, hydroxides, oxyhydrates, and various other chemicals or minerals, including quartz grains, boric acid, and lithium carbonate), glass-forming melt, and various intermediate crystalline phases, such as spinel. The batch reactions begin as soon as the feed constituents are mixed and turned to slurry. After being charged into the melter, the water boils away and the melter feed dries, creating the cold cap. The reactions advance during drying and progress while the feed is turning into melt. Water of hydration from various hydroxides, oxyhydrates, and boric acid, as well as water of crystallization, is the first gas to be released on heating.
When the oxyionic salts melt, they spread over the solid grains present in the feed. If salts are in excess, which happens in low-activity waste feeds (these wastes may contain more than 80 mass% of sodium salts), molten salt can migrate between the solid grains, causing a temporary or even permanent demixing. As temperature increases, molten salts react with the feed solids, producing copious amounts of gases—COx, NOx, and O2. Subsequently, various solid and liquid reaction products are created that eventually dissolve in the glass-forming melt.5
The kinetics of batch reactions has been studied using thermoanalytical methods, mainly thermogravimetry (TGA),7–10 differential scanning calorimetry (DSC),11 and evolved gas analysis via gas chromatography and mass spectrometry. Experimental results can be mathematically simulated7,11 using the nth order kinetic equation
(1) 
where α is the degree of conversion, A is the pre-exponential factor, B is the activation energy, T is the temperature, n is the reaction order, w is the reaction weight, N is the number of reactions, t is the time, and subscript i stands for the ith reaction (i=, 1, 2,…, N). The conversion degree is expressed with respect to gas evolution for the TGA7 or with respect to the conversion heat for the DSC.11 Equation (1) represents a simple situation in which individual glass melting reactions do not influence each other. Figure 2 shows an example of a TGA curve deconvoluted by means of Equation (1). In reality, consecutive reactions affect each other to some extent, but as the agreement between the measured and fitted curves indicates, disregarding this mutual influence is a reasonable approximation.
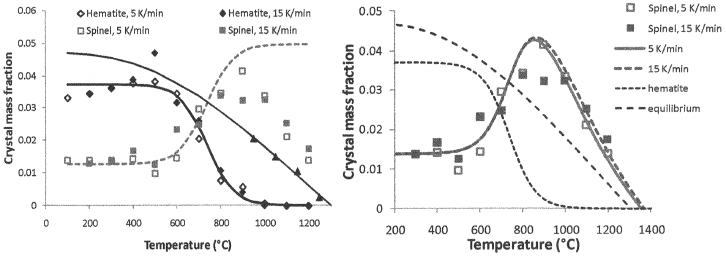
The intermediate crystalline phases that occur in melter feed during heating are numerous. They usually dissolve before leaving the cold cap, but some may survive and be carried away into the melt.3,12 If these crystals are large and heavy (spinel), they may settle in the melter13,14 and create problems, such as blocking the discharge riser.15 Figure 3 shows formation of spinel from hematite as recorded by x-ray diffraction (XRD). The spinel formation kinetics is represented by the equation12
(2) 
where ch is the hematite fraction, cs is the spinel fraction, cs0 is the equilibrium spinel fraction, kH is the pre-exponential factor, BH is the activation energy, p = vMs/Mh is the hematite-to-spinel ratio, v is the stoichiometric coefficient, M is the molecular mass, and subscripts s, h, and 0 designate spinel, hematite, and the initial value. The first term on the right-hand side of Equation (2) stands for the spinel production rate and the second term is an expression for the rate of dissolution.
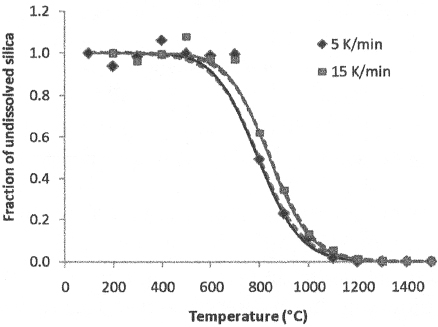
Dissolution of crystalline silica (quartz) in glass-forming melt is the most prominent reaction in commercial batches as well as in nuclear waste melter feeds that use quartz as an additive (i.e., feeds in which additives are not premelted to frit). The borate glass-forming melt appears relatively early.1516 Initially, it absorbs alkali and -alkaline earth oxides from molten salts and dissolves iron, aluminum and other amorphous oxides from hydroxides and oxyhydrates. Silica and silicate minerals begin to appreciably dissolve above 600°C (Figure 4).
Quartz dissolution is a diffusion-controlled process that is influenced by numerous factors, such as the presence and motion of bubbles, the extent of overlap of concentration boundary layers, the nonuniform spatial distribution and irregular shapes of particles, and the particle-size distribution.6,17–19 Fortunately, a simple, yet sufficient and adequate, quartz dissolution kinetics can be represented by the nth order empirical equation:12
(3) 
where x is the fraction of undissolved quartz, A is the pre-exponential factor, n is the (apparent) reaction order, and B is the activation energy.
Silica particle size should be between 50 and 100 μm.6 Small silica particles produce a connected high-viscosity melt while gases are still evolving, leading to excessive foaming and a slow rate of melting. Large silica particles tend to form clusters that homogenize extremely slowly.6 Data shown in Figure 4 were obtained with 75-μm crushed quartz.
Gas phase is present in the feed until the melt is fully developed and homogenized.20,21 Gas bubbles are produced not only by residual batch gases, creating so-called primary foam, but also by redox reactions in the melt under the cold cap—these are responsible for secondary foam formation. Both foams coalesce into larger cavities2 that eventually escape into the plenum space. Both foams are reduced by the forced convection from bubbling.
MATHEMATICAL AND PHYSICAL MODELING
As Figure 1 illustrates, a mathematical model of the cold cap involves transfer of mass and heat through the layer of floating and reacting material. The simplest equations that represent such a process have the following form:2,21–25
(4) 
(5) 
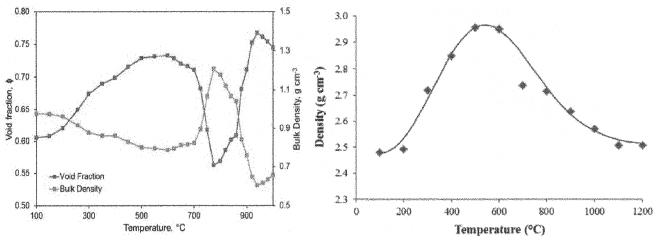
where ρ is the density, v is the velocity, r is the reaction rate, c is the heat capacity, λ is the heat conductivity, j is the mass flux, y is the vertical coordinate, subscripts b and g denote the condensed phase and the gas phase, respectively, and superscript Eff indicates the effective value. The effective heat capacity of the condensed phase, cpEff, includes the heat from melting reactions (such as evaporation of bonded water, etc.). To solve these equations, the density (Fig. 5), heat capacity, and heat conductivity (described below) must be known as functions of temperature and the rate of heating.
The heat conductivity was obtained from the temperature field in melter feed heated in a cylindrical crucible using the equation26
(6) 
where r is the radial coordinate. Figure 6 displays the temperature field as it evolves during heating and the resulting thermal diffusivity, a = λ/ρcpEff, as a function of temperature.
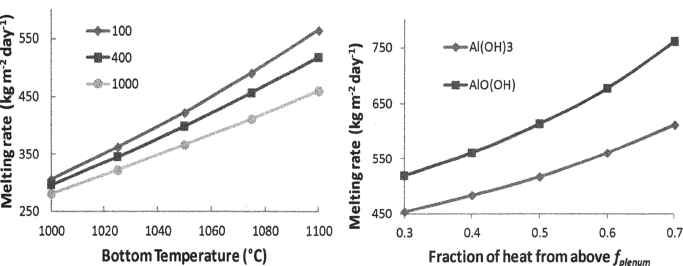
Solving Eqs. (4) and (5) for appropriate boundary conditions (the cold cap top and bottom temperature, foaminess,2b and the fraction of heat from above) results in the temperature and velocity distribution of the cold cap condensed phase.2 As the main result, Figure 7 displays the effect of various parameters on the rate of melting.
Cold caps from glass melters are difficult to access and to retrieve as representative samples. Feeds treated in vertical temperature gradients27 reveal various features of cold caps, such as foam formation, but do not simulate the steady state that characterizes the cold cap melting process. Recently, it became possible to create cold caps in a laboratory-scale melter3,28 large enough to avoid bridging and small enough to allow quenching and preserving the cold cap structure for detailed study. Figure 8 shows a cold cap fracture surface with features schematically displayed in Figure 1. The confirmation of the cold cap structure is just the first step. Continuing analysis will allow us to verify the distribution of individual phases (molten salts, crystalline phases, glass-forming phase, and gas phase) and cold cap properties, such as density.
CONCLUSIONS
An advanced mathematical model was developed for the conversion of melter feed to molten glass within the cold cap. To provide data for model simulation, we used nth order kinetics for multiple overlapping reactions recorded with TGA and DSC. A similar approach was applicable to the kinetics of quartz dissolution and spinel formation/dissolution based on quantitative XRD. Experimental techniques were developed to measure density, porosity, and heat conductivity of the reacting feed as functions of temperature and heating rate. Special attention was paid to foaming behavior. Cold caps were produced in a laboratory-scale melter and preserved by quenching for detailed structural investigation and model verification.
ACKNOWLEDGMENT
This project has been supported by the U. S. Department of Energy’s Waste Treatment and Immobilization Plant Federal Project Office under the direction of Dr. Albert A. Kruger.
REFERENCES
1. R.A. Kirkbride, G.K. Allen, R.M. Orme, R.S. Wittman, J.H. Baldwin, T.W. Crawford, J. Jo, L.J. Fergestrom, T.M. Hohl, and D.L. Penwell, Tank Waste Remediation System Operation and Utilization Plan, Vol. I, HNF-SD-WM-SP-012, Numatec Hanford Corporation, Richland, Washington (1999).
2. (a) R. Pokorny, and P. Hrma, Mathematical Modeling of Cold Cap, J. Nucl. Materials, 429, 245–56 (2012); (b) R. Pokorny, and P. Hrma, Model for the conversion of nuclear waste melter feed to glass, J. Nucl. Materials 445, 190–199 (2014).
3. D.R. Dixon, M.J. Schweiger, and P. Hrma, Effect of Feeding Rate on the Cold Cap Configuration in a Laboratory-Scale Melter, WM2013 Conference, February 24–28, Phoenix, Arizona, USA (2013).
4. K.S. Matlack, W.K. Kot, R.A. Callow, J. Innocent, and I.L. Pegg, Testing of Optimized Bubbler Configuration for HLW Melter, VSL-13R2950-1, Vitreous State Laboratory, The Catholic University of America, Washington, D.C. (2013).
5. P. Hrma, M.J. Schweiger, C.J. Humrickhouse, J.A. Moody, R.M. Tate, T.T. Rainsdon, N.E. TeGrotenhuis, B.M. Arrigoni, J. Marcial, C.P. Rodriguez, and B.H. Tincher, Effect of Glass-Batch Makeup on the Melting Process, Ceramics-Silikaty, 54, 193–211 (2010).
6. M.J. Schweiger, P. Hrma, C.J. Humrickhouse, J. Marcial, B.J. Riley, and N.E. TeGrotenhuis, Cluster Formation of Silica Particles in Glass Batches During Melting, J. Non-Cryst. Solids, 356, 1359–67 (2010).
7. R. Pokorny, D.A. Pierce, and P. Hrma, Kinetics of Batch-Melting Reactions, Thermochim. Acta, 541, 8–14 (2012).
8. D.A. Pierce, P. Hrma, and J. Marcial, Thermal Analysis of Waste Glass Batches: Effect of Batch Makeup on Gas-Evolving Reactions, Chapter 20, pp. 429–40, in: J. Šesták, and P. Simon (Editors), Thermal Analysis of Micro, Nano- and Non-Crystalline Materials, Springer, Dordrecht (2012).
9. D.A. Pierce, P. Hrma, and M.J. Schweiger, Effect of Alumina Source on HLW-Feed Melting Process, Proc. Mat. Sci. Technol. 112th Ann. Meeting, CD ROM (2011).
10. D.A. Pierce, P. Hrma, J. Marcial, B.J. Riley, and M.J. Schweiger, Effect of Alumina Source on the Rate of Melting Demonstrated with Nuclear Waste Glass Batch, Int. J. Appl. Glass Sci., 3, 59–68 (2012).
11. J. Chun, D.A. Pierce, R. Pokorný, and P. Hrma, Cold-Cap Reactions in Vitrification of Nuclear Waste Glass: Experiments and Modeling, Thermochimica Acta, 559, 32–9 (2013).
12. R. Pokorny, J.A. Rice, J.V. Crum, M.J. Schweiger, and P. Hrma, Kinetic Model for Quartz and Spinel Dissolution During Melting of High-Level-Waste Glass Batch, J. Nucl. Mater., 443, 230–35 (2013).
13. M. Mika, P. Hrma, and M.J. Schweiger, Rheology of Spinel Sludge in Molten Glass, Ceramics-Silikaty, 44, 86–90 (2000).
14. P. Hrma, and J.D. Vienna, Balancing Cost and Risk by Optimizing the High-Level Waste and Low-Activity Waste Vitrification, Waste Management ‘00, University of Arizona, Tucson, Arizona (2000).
15. J. Matyas, J.D. Vienna, A. Kimura, M.J. Schaible, and R.M. Tate, Ceramic Transactions, 222, 41–51 (2010).
16. M.D. Dolan, and S.T. Misture, Analysis of Glass Batch Reactions Using In Situ X-Ray Diffraction, Glass Technol., 45, 140–47, 167–74, 212–19 (2004).
17. P. Hrma, K. J. Swearingen, S. H. Henager, M. J. Schweiger, J. Marcial, N. E. TeGrotenhuis, Conversion of batch to molten glass, II: Dissolution of quartz particles, J. Non-Cryst. Solids. 357, 820–828 (2011).
18. J. Marcial, P Hrma, M.J. Schweiger, K.J. Swearingen, N.E. TeGrotenhuis, and S.H. Henager, Effects of Quartz Particle Size and Sucrose Addition on Melting Behavior of a Melter Feed for High-Level Waste Glass. Proc. IN MM 51st Annual Meeting, Baltimore, July 11–15; www.osti.gov/servlets/purl/991931-wMimmb/; see also www.inmm.org (2010).
19. P. Hrma, and J. Marcial, Dissolution Retardation of Solid Silica During Glass-Batch Melting, J. Non-Cryst. Solids, 357, 2954–59 (2011).
20. P. Hrma, Melting of Foaming Batches: Nuclear Waste Glass, Glastech. Ber., 63K, 360–69 (1990).
21. S.H. Henager, P. Hrma, K.J. Swearingen, M.J. Schweiger, J. Marcial, and N.E. TeGrotenhuis, Conversion of Batch to Molten Glass, I: Volume Expansion, J. Non-Cryst. Solids, 357, 829–35 (2011).
22. P. Hrma, Thermodynamics of Batch Melting, Glastech. Ber., 55, 138–50 (1982).
23. P. Schill, Mathematical Model of Batch Melting in All-Electric Furnaces, Ceram.-Silik., 26, 155–63, 209–22 (1982).
24. P. Schill, W. Lutze, W. Gong, I.L. Pegg, Testing and Modeling the Behaviour of Platinoids During Vitrification of High Level Radioactive Waste, Part 2, Glass Technol.-Part A, 48, 276–89 (2007).
25. P. Hrma, A. A. Kruger, and R. Pokorny, Nuclear Waste Vitrification Efficiency: Cold Cap Reactions, J. Non-Cryst. Solids, 358, 3559–62 (2012).
26. R. Pokorny, J.A. Rice, M.J. Schweiger, and P. Hrma, Determination of Temperature-Dependent Heat Conductivity and Thermal Diffusivity of Waste Glass Melter Feed, J. Am. Ceram. Soc., 96, 1891–98 (2013).
27. A.S. Choi, D.H. Miller, and D.M. Immel, Determination of HLW Glass Melt Rate Using X-Ray Computed Tomography (CT), SRNL-STI-2010-00767, Rev. 0, Savannah River National Laboratory, Aiken, South Carolina (2010).
28. D.S. Kim, M.J. Schweiger, W.C. Buchmiller, and J. Matyas, Laboratory-Scale Melter for Determination of Melting Rate of Waste Glass Feeds. PNNL-21005; EMSP-RPT-012, Pacific Northwest National Laboratory, Richland, Washington (2012).


