
THE IMPORTANCE AND POTENTIAL OF LEADERS DEBATES
Cathy Widdis Barr
IT HAS BEEN almost 25 years since the first televised leaders debate in Canadian history, and it finally seems possible to conclude that debates between the leaders of the major political parties are becoming a regular part of Canadian federal election campaigns. The history of leaders debates in this country has, however, been rather erratic, and the role of debates in future elections is not assured. The first televised debate in Canada was held during the federal election of 1968. This debate did not mark the beginning of a trend, however, because no leaders debates were held during the 1972 or 1974 elections. Canadians had to wait 11 years for another debate between the leaders of the major federal parties. The 1979 debate did not start any trends either; debates were not part of the 1980 election, which was held only nine months after the 1979 campaign. Debates were, however, a major focus of both the 1984 and 1988 federal elections.
In Canada, the decision to debate is left to the individual party leaders and their advisers. Challengers for the position of prime minister are almost always eager to debate, because debates are generally considered to favour challengers over incumbents. Debates place all candidates on an equal footing – challengers share the stage with incumbents and get equal time to put forth their views. In addition, debates draw large audiences and thus provide the wide media exposure that is crucial for challengers, who are usually less well known than incumbents. Although challengers have much to gain and little to lose from participating in debates, the decision whether a debate will occur in a given election usually rests with the incumbent prime minister. The conventional wisdom used to be that incumbents should not debate unless they were in danger of losing the election. This reasoning appears to have been followed by Prime Minister Pierre Trudeau, who declined to debate in 1972, 1974 and 1980, when his party was leading the polls, but agreed to debate in 1979, when his party was behind in the polls. Trudeau chose to debate in 1968 even though his victory seemed assured, but it could be argued that Trudeau was not then a “true” incumbent – he had not led his party to victory in a general election but rather had become prime minister by becoming leader of the ruling Liberal party.
Despite the conventional wisdom, recent trends in both Canada and the United States indicate that it is becoming more and more difficult for incumbents to refuse to debate. Televised debates are increasingly considered by the public and the media to be a normal part of an election campaign. Moreover, a candidate’s refusal to participate can itself become an election issue, as happened in Ontario in 1985 when Premier Frank Miller refused. Although debates are not institutionalized in the United States, they have occurred in the past four presidential elections, and all but the 1988 debate involved an incumbent president. The Canadian record is less consistent, but debates have been held during three of the past four federal elections, including the two most recent campaigns. In 1984, John Turner was in a position similar to that of Pierre Trudeau in 1968: he was prime minister by virtue of having been chosen Liberal leader, and his party was ahead in the polls. Turner, however, had to face an additional consideration. According to Jeffrey Simpson, Turner did not want to debate, but his advisers “believed the political risk in refusing to debate outweighed that of losing a narrow decision to Mulroney” (1985, 25). The circumstances surrounding the 1988 debate are even more revealing. Brian Mulroney had been prime minister for four years, his Progressive Conservative party led the pre-election polls, and the Conservatives continued to lead the polls during the three weeks of the campaign that preceded the debates. In the past, this would have been considered a classic scenario for an incumbent to refuse to debate. Nevertheless, Robert Krause (1989) reports that the Conservatives did not consider refusal a viable option.1
As televised debates become a regular feature of Canadian elections, it becomes more important to understand their value and role and to consider whether Canadian party leaders should be required by law to participate, as leaders in Sweden and Germany are. To do this, however, we must first understand the nature and extent of the impact of debates. In the United States, there is a lively and sustained scholarly discussion about the value of presidential debates, their role in the campaign and whether they should be mandatory.2 These discussions draw on an extensive body of research on the impact of debates. Perhaps because they have – at least until recently – been sporadic occurrences, Canadian campaign debates have not been the focus of much scholarly attention. There has been little discussion among Canadian scholars about the value of televised debates and even less empirical investigation of the effects of such events.3 There are several ways in which debates could influence voters. The impact that most interests politicians and their handlers, as well as media commentators, is the potential for debates to influence how voters cast their ballots. Obviously, the opportunity to win votes is the major reason political parties agree to participate in televised debates. And the media, although arguing that debates are important because they inform voters, usually focus their attention on who “won” and who “lost” and on how this will affect the outcome of the election.4
Despite the attention given to the impact of debates on how people vote, this is only one of many possible debate effects. Indeed, given what we know about the large number of factors that contribute to the vote decision, isolating the impact of debates from other factors is one of the most difficult tasks faced by anyone who studies televised debates.5 In addition, from the perspective of determining the value of debates, their influence on how people vote is one of the least important of their potential effects. Televised debates are major campaign events. They attract large audiences and are covered extensively by the media. They may, therefore, stimulate interest in the campaign and thereby increase voter turnout. In other words, regardless of whether debates influence how people vote, they may influence their decision to vote. Debates could also affect political attitudes. For example, they could influence voters’ perceptions of the personal characteristics of the party leaders and affect voters’ overall evaluations of those leaders. Finally, and most important, debates could provide information to the electorate and thus increase voters’ knowledge about the leaders, parties and issues. As was noted above, members of the media often claim that debates are important, even essential, for informing voters. Globe and Mail columnist Jeffrey Simpson (1989), for one, has argued that debates should be mandatory because they are “important vehicles to let voters hear nation-wide discussions of public issues during campaigns.” Although such claims are frequently made, we know very little about what, if anything, voters actually learn from televised debates.
This study examines the impact of the 1984 and 1988 leaders debates in the four areas mentioned above. First, it investigates the effect of the debates on individual vote decisions. Second, it examines the influence of the debates on voter turnout. Third, the study explores the impact of the debates on opinions about the personal qualities of the major party leaders, and on overall evaluations of those leaders. Finally, it examines the influence of the debates on the levels of knowledge Canadians possess about the central factors of any federal election campaign: the party leaders, parties and issues. Findings are used to assess the value of debates and their role in the Canadian electoral process, as well as to draw conclusions about the question of mandatory debates. Analysis of the 1984 election is based on data collected for the 1984 National Election Study (NES), a single-wave, post-election survey of a representative sample of the Canadian electorate. Analysis of the 1988 election is based on two data sets: a re-interview of respondents from the 1984 NES conducted following the 1988 election and the 1988 NES. Unlike previous NESs, the 1988 study was a three-wave survey. The first wave was a campaign-period survey employing a research design known as a rolling cross-section – interviews were conducted with a small sample on each day of the campaign, beginning 4 October and ending 20 November. The second wave was a post-election survey, and the third was a mailback survey.6
AN OVERVIEW OF THE 1984 AND 1988 ELECTIONS
Before beginning our examination of the impact of leaders debates, we will take a brief look at the two elections serving as case studies for this purpose. The 1984 election was a landslide victory for the Progressive Conservative party. The Conservatives, led by Brian Mulroney, won 50 percent of the popular vote and 211 seats in the House of Commons. The Liberals, under John Turner, were reduced to 40 seats and 28 percent of the vote, and the New Democratic Party (NDP), led by Ed Broadbent, won 30 seats with 19 percent of the vote. Before election day, 4 September, three televised debates were held between the leaders of these three parties: a debate in French on 24 July, one in English on 25 July and a bilingual debate on women’s issues on 15 August. The 1988 election was also won by the Conservatives, although the size of their victory was more modest than it had been four years earlier. In 1988, the Conservatives won 43 percent of the popular vote and 169 House of Commons seats – a major reduction from 1984, but still enough to form a majority government. The Liberals more than doubled their seats to 83 and won 32 percent of the popular vote; the NDP won 43 seats with 20 percent of the popular vote. All three parties had the same leaders in 1988 as in 1984, and during the campaign these men faced each other in two televised debates. The first debate, in French, was held on 24 October; the second, in English, was held on 25 October. Election day in 1988 was 21 November.
In both 1984 and 1988, the leaders debates were treated by the parties and the media as major campaign events, and the public apparently agreed. As can be seen from table 3.1, 49 percent of all 1984 NES respondents and 60 percent of English-speaking respondents reported watching the English debate, 23 percent of all respondents and 55 percent of French-speaking respondents watched the French debate and 38 percent of all respondents watched the women’s issues debate. In all, 67 percent of respondents reported watching at least one of the three debates held during the 1984 campaign. The percentage of 1988 re-interview respondents who reported watching the debates is slightly higher: 52 percent of all respondents and 60 percent of English-speaking respondents watched the English debate, 26 percent of all respondents and 69 percent of French-speaking respondents watched the French debate and 65 percent saw one of the two debates. The larger audience in 1988 is due primarily to a larger proportion of French-speaking respondents watching the French debate and secondarily to slightly more people watching the debate in the “other” official language.
Table 3.1
Debate exposure, 1984 and 1988
(percentages)
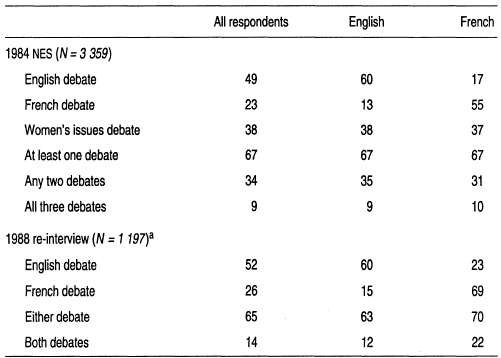
aRefers to 1988 re-interview of 1984 NES respondents.
Because they attract such large audiences, leaders debates clearly have the potential to affect the course of the campaign and the outcome of the election. Several commentators have argued that the 1984 debates were the turning point of that election (e.g., Fletcher 1988; Perlin 1988). The most memorable exchange of the 1984 debates occurred in the English debate when Mulroney attacked Turner over a series of patronage appointments the latter had made shortly after becoming prime minister. The appointments were made at the request of outgoing Prime Minister Pierre Trudeau, and in response to Mulroney’s request to apologize for making the appointments, Turner answered that he “had no option.” Mulroney replied with all the indignation he could muster: “You had an option, sir. You could have said: ‘I’m not going to do it. This is wrong for Canada. And I am not going to ask Canadians to pay the price.’ You had an option, sir, to say no, and you chose to say yes, yes to the old attitudes, and the old stories of the Liberal party” (quoted in Sears 1985, 33). Ian MacDonald called this exchange “two of the most electrifying minutes in the history of televised political debates” (1984, 289). Clips of the exchange were repeated for days on television news programs, and the Conservatives referred to Turner’s “had no option” response throughout the remainder of the campaign.
Largely because of the patronage exchange, the media declared Mulroney the winner of the English debate. He was also felt to have performed better than his opponents in the French debate. As can be seen from table 3.2, the majority of respondents to the 1984 NES agreed with this assessment: 52 percent rated Mulroney’s debate performance as superior to Turner’s and Broadbent’s.7 A mere 5 percent evaluated Turner’s performance as superior to the performances of his opponents. Following the English and French debates, the Conservatives pulled ahead of the Liberals in all the major public opinion polls and continued to hold the lead for the rest of the campaign.8 Of course, none of this means that the debates actually influenced the outcome of the 1984 election. Other events may have resulted in a Conservative victory, even if the debates had not been held or if Mulroney’s performance had been judged less favourably. Indeed, the mid-August women’s issues debate apparently had little effect on Conservative fortunes, despite the fact that Mulroney’s performance in that debate was heavily criticized. Nevertheless, the debates were clearly viewed by observers at the time as significant events, and this conclusion is supported by the poll results – at least with respect to the French and English debates – and by the outcome of the election.
Table 3.2
Leader chosen as debate winner, 1984 and 1988
(percentages)
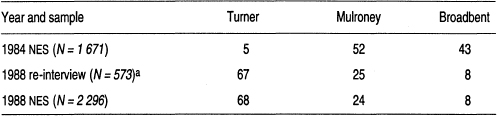
aRefers to 1988 re-interview of 1984 NES respondents.
The 1988 debates are also generally considered to have been important events in that they significantly altered the course, although ultimately not the outcome, of the 1988 election (e.g., Frizzell et al. 1989; Johnston 1990). As in 1984, the most notable exchange of the debates took place between Brian Mulroney and John Turner in the English debate. The topic was the Free Trade Agreement (FTA), which had been negotiated by the Mulroney government with the United States. The exchange began when Turner, who opposed the agreement, declared: “I happen to believe you sold us out as a country.” He then proceeded to enumerate the powers that he believed Canada had given up under the FTA, while Mulroney interrupted several times to deny that these powers had been lost. Both men became more and more impassioned. Mulroney claimed that he loved Canada and that the FTA would benefit Canada, to which Turner responded in part: “We built a country east and west and north. We built it on an infrastructure that deliberately resisted the continental pressure of the United States. For 120 years we’ve done it. With one signature of a pen, you’ve reversed that, thrown us into the north-south influence of the United States and will reduce us, I am sure, to a colony of the United States because when the economic levers go, the political independence is sure to follow” (quoted in Maser 1989, 63).
Many journalists commenting on the English debate immediately after its conclusion noted the exchange on free trade, but most concluded that the debate had no clear winner. The public, however, did not agree. Forty percent of those who were interviewed for the 1988 NES on the day following the English debate felt that Turner had won, and the next day a clear majority (54 percent) of respondents declared Turner the winner (figure 3.1). As figure 3.1 illustrates, the public declared Turner the winner of the debates immediately, and this belief was sustained throughout the campaign.9 Indeed, as table 3.2 indicates, more than two-thirds of respondents to the 1988 post-election surveys believed that Turner won the debates, approximately one-quarter believed that Mulroney won and fewer than one-tenth felt that Broadbent won.
Figure 3.1
Leader chosen as debate winner, 25 October–20 November 1988
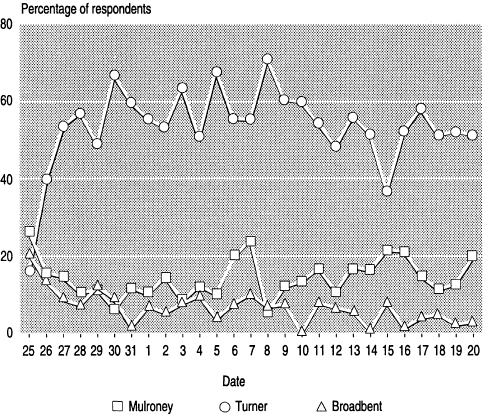
Notes: Data are derived from the 1988 NES. Results for 25 October are based on 19 respondents whose assessments are based on the French debate only. Results for all other dates are based on an average daily sample of 80 respondents whose assessments are based on the French and/or English debates.
Both public opinion polls released during the campaign and the 1988 NES data support the conclusion that Turner’s performance in the 1988 debates revived the flagging fortunes of the Liberal party. In the nine polls released between the start of the campaign and the debates, the Conservatives led the Liberals by an average of 15 percent. Of the four polls released in the week following the debates, two gave the Conservatives a slight lead over the Liberals, and two gave the Liberals a slight lead over the Conservatives. This see-saw battle continued throughout most of the rest of the campaign, until the Conservatives regained a solid lead in the final week.10 Figure 3.2 tracks the vote intentions of the 1988 NES campaign period survey respondents; the debates took place during the seventh interval.11 As this graph indicates, the gap between the Conservatives and the other two parties before the debates is quite substantial. In the two intervals immediately following the debates, the gap between all three parties narrows, and from the tenth interval on it is clear that the Liberals and Conservatives are battling it out for first place, with the New Democrats a distant third. From this evidence, it seems clear that the debates made the 1988 election a much closer contest than it would otherwise have been. In addition, Turner’s vehement attack on the FTA made free trade the dominant issue of the campaign and Turner himself its most credible opponent.
Figure 3.2
Vote intention, 1988

Notes: Data are derived from the 1988 NES.
aIntervals start on 4 October and end on 20 November. All but the sixteenth are three-day intervals; the sixteenth is a two-day interval. No data were gathered on 10 October. The average sample size of the intervals is 226 respondents. The debates occurred during the seventh interval.
THE EFFECT OF LEADERS DEBATES ON VOTE DECISIONS
The first televised debates in American history were four debates between John Kennedy and Richard Nixon during the 1960 presidential campaign. Dubbed “the Great Debates” by the commentators of the day, the encounters were the focus of a great deal of attention from both the public and the media, as well as from political scientists and communications researchers. Most research on the Kennedy-Nixon debates focused on their impact on individual vote decisions and the outcome of the election. Little evidence, however, was found to indicate that viewing the debates actually caused many people to change their vote. After reviewing 31 separate studies of the 1960 debates, Katz and Feldman (1962) concluded that their major effect was to reinforce existing vote intentions and to crystallize the intentions of undecided voters. This conclusion was in line with prevailing theories in both electoral-behaviour and communications research. According to these theories, election campaigns have little influence on voters because those most likely to pay attention to them are party identifiers, who tend to perceive campaign events in a manner consistent with their party identification. Independent voters were considered less likely to engage in selective exposure and selective perception and therefore more likely to be influenced by election campaigns; however, it was argued that these voters were less likely to follow campaigns (e.g., Berelson et al. 1954; Campbell et al. 1960; Lazarsfeld et al. 1944).
By the time researchers began analysing the 1976 presidential debates between Gerald Ford and Jimmy Carter, the theories that had prevailed in the 1960s were under attack. Researchers were documenting the decline of party identification and the rise of a new type of independent voter: interested, attentive, concerned with policy issues and willing to wait until the campaign period before deciding how to vote (e.g., Chaffee and Choe 1980; Miller et al. 1976; Nie et al. 1979). Despite this new perspective on the potential of debates to influence vote decisions, most researchers who studied the 1976 debates concluded that their major effect was to reinforce existing vote intentions (e.g., Dennis et al. 1979; Hagner and Rieselbach 1978; Lang and Lang 1978; Sears and Chaffee 1979). A few researchers, however, have found more significant effects. Davis (1979), for example, found that the 1976 debates helped undecided voters make up their minds. Davis (1982) concluded that the 1980 debates had a significant positive effect on intentions of voting for Reagan. After studying the 1976 and 1984 debates, Geer concluded that debates not only reinforce preferences but also “cause many cross-pressured and weakly committed individuals to change their preference for president” (1988, 495–96). Finally, a recently published study of debates in West Germany found that German debate watchers were more likely to vote for the party of the leader they felt had “won” the debate, even after party identification was taken into account (Schrott 1990).
LeDuc argues that the volatility of the Canadian electorate means that debates have the potential to influence Canadian voting behaviour: “Partisanship is relatively weak and unstable for large numbers of Canadian voters, and short-term factors are consistently found to be more important elements in voting behaviour in Canada than are sociodemographic or other longer term forces” (1990, 136). Despite the potential of Canadian leaders debates to influence voting behaviour, most studies have concluded that these debates have little impact on how Canadians vote. LeDuc and Price (1985) found a statistically significant difference between the voting behaviour of those who watched the 1979 debate and those who did not, but the direction of the difference was inconsistent with perceptions of the debate.12 With regard to 1984, LeDuc (1990) found only one statistically significant correlation between watching a given debate and vote, and this was reduced to insignificance when controls for language were introduced.13 In their study of the 1988 debates, LeDuc and Price (1990) found that debate watchers were more likely to vote Liberal than non-watchers, but the correlation was very weak. One recently published analysis of the 1984 debates comes to a slightly different conclusion about the impact of debates on voting behaviour. Using probit analysis, Lanoue (1991) found that people who watched a leaders debate in 1984 were significantly more likely to vote Conservative and significantly less likely to vote Liberal than were non-watchers. The effect was particularly strong among French-speaking voters.
The statistics presented in the first row of table 3.3 tend to support the conclusion that debates have little impact on how Canadians vote. When vote is cross-tabulated with a dichotomous variable measuring exposure to the debates, the two variables are found to be unrelated.14 However, it would be unreasonable to conclude from this evidence that debates do not influence voting behaviour. The crucial question is whether debate exposure made voters more likely to change their vote from one election to the next. Therefore, table 3.3 also presents the results of cross-tabulations between current vote and previous vote, controlling for debate exposure. As can be seen from this table, the relationship in 1984 between current vote and previous (1980) vote is moderate, returning a lambda of 0.273.15 This relationship is weaker among those who watched at least one debate and stronger among those who watched no debates. Not surprisingly, the relationship between current and previous (1984) vote is stronger in 1988 than in 1984, returning a lambda of 0.418.16 As was the case in 1984, this relationship is weaker among those who watched at least one debate and stronger among those who did not watch any debate. Of course, this does not necessarily mean that the debates caused people to change their vote. It is possible that those thinking of changing their vote are more likely to watch debates. Nevertheless, the results are interesting and worthy of further investigation.
Table 3.3
Relationship between current vote and debate exposure, vote switching and debate exposure, 1984 and 1988
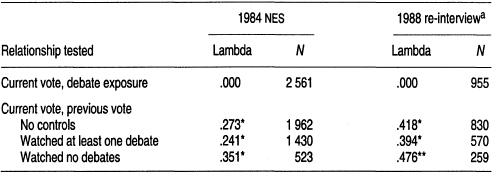
aRefers to 1988 re-interview of 1984 NES respondents.
*p < .001; **p < .01.
The loglinear method of analysing contingency tables is a more powerful method of studying the relationship between leaders debates and voting behaviour. This method also provides a more refined picture of exactly how variables are related. In loglinear analysis, a model representing a hypothesized relationship between two or more categoric variables is specified. No distinction need be made between independent and dependent variables; the model must simply indicate which variables are hypothesized to be related. Expected cell frequencies are calculated and compared to observed frequencies using the likelihood-ratio chi-square.17 The larger this statistic relative to the number of degrees of freedom, the more expected frequencies differ from observed frequencies. Thus, a large likelihood-ratio statistic means that the model does not fit the data and should be rejected. An acceptable model is one in which expected cell frequencies do not differ significantly from observed frequencies. Knoke and Burke argue that a model should be accepted if the probability of a type I error lies between .10 and .35 (1980, 31). At lower probability levels, the difference between observed and expected cell frequencies is greater than would be expected to occur by chance, and the model must be rejected as not fitting the data. At higher probability levels, the model may be “too good” a fit (i.e., it may include unnecessary parameters) and should be accepted only after simpler models have been tested and rejected.
Table 3.4 presents goodness-of-fit statistics for four sets of loglinear models relating to voting behaviour and debate exposure. Goodness-of-fit statistics are used to determine which model in a given set best fits the data. Following Knoke and Burke (1980), a model will be accepted if the probability of a type I error is between .10 and .35. The first panel of table 3.4 displays the statistics for two sets of models of the relationship between current vote and debate exposure: one for 1984 and one for 1988. The purpose of these models is to confirm the conclusion drawn from table 3.3 that vote is unrelated to debate exposure. The second panel of table 3.4 presents statistics for two sets of models of the relationship between vote switching and debate exposure. These models were designed to confirm the second conclusion drawn from table 3.3: that debate exposure, although unrelated to vote direction, is related to vote switching. In each panel, the first model displayed is the saturated model, so named because it contains all possible interactions among the variables. A saturated model can never be rejected because it will always predict expected values perfectly; nevertheless, the next simplest model must be tested because it might also fit the data.
Table 3.4
Loglinear models of relationship between current vote and debate exposure, vote switching and debate exposure, 1984 and 1988
aV = current vote; D = debate exposure; P = previous vote.
bRefers to 1988 re-interview of 1984 NES respondents.
cSaturated model.
dModel of independence.
eModel is accepted as fitting data.
The saturated model in the first panel of table 3.4 posits a relationship between current vote and debate exposure. Since this model includes only one two-way interaction, the next simplest model is the model of independence, which hypothesizes that there is no relationship between current vote and debate exposure. As can be seen from the probability levels associated with the two models of independence, these models must be accepted. This exercise confirms that vote direction in 1984 and 1988 was unrelated to debate exposure. Turning now to the 1984 data in the second panel of table 3.4, we see that the saturated model posits that the relationship between 1984 vote and previous vote (in 1980) is related to debate exposure. The next simplest model omits the three-way interaction among these variables, suggesting that there is a relationship between current and previous vote, current vote and debate exposure, and previous vote and debate exposure, but not among all three. The probability level of .075 associated with this model indicates that it must be rejected. Therefore, we must conclude that the simplest model that fits the 1984 data is the saturated model. Finally, turning to the 1988 data in the second panel of table 3.4, we can see that the model that omits the three-way interaction among the variables fits the data. As this model is simpler than the saturated model, it must be accepted as the best-fitting model. The results of our second test are thus inconclusive: vote switching appears to have been related to debate watching in 1984 but not in 1988.
Although the statistics presented in table 3.4 indicate that vote switching was related to debate exposure in 1984, they do not tell us exactly how exposure to the 1984 debates affected vote switching in that election. Table 3.5 is more informative in this regard. The statistics presented in this table are the parameter estimates for the three-way-interaction saturated models of the impact of debate exposure on vote switching in both 1984 and 1988. Parameter estimates express in logarithmic form the odds that a randomly selected case will fall into a given cell. A positive parameter estimate indicates that there are more cases in the cell in question than would be expected, given the marginal distribution of cases; a negative parameter estimate indicates the opposite. Only parameter estimates for respondents who watched at least one debate are displayed in table 3.5.18 The first panel in this table presents parameter estimates for the impact of debate exposure on vote switching in 1984. The largest parameter in this panel is +.204 for the cell containing 1980 Liberal debate watchers who voted Conservative in 1984, indicating that more of these individuals voted Conservative in 1984 than would be expected, given the marginal distribution of cases. The second panel presents parameter estimates for the saturated model of the impact of debate exposure on vote switching in 1988. Although the statistics presented in table 3.4 indicate that a simpler model also fits the 1988 data, the saturated model is nonetheless theoretically interesting and worthy of further examination. The largest parameter estimate in the lower panel of table 3.5 is +.269 for the cell containing 1984 NDP debate watchers who voted Liberal in 1988, indicating that more of these individuals voted Liberal in 1988 than would be expected, given the marginal distribution of cases.
Table 3.5
Parameter estimates, current vote by previous vote by debate exposure, 1984 and 1988
Notes: Estimates refer to loglinear model of three-way interaction among current vote, previous vote and debate exposure. All parameter estimates are for respondents who watched at least one debate. Parameters for non-watchers may be obtained by reversing the signs.
aRefers to 1988 re-interview of 1984 NES respondents.
These findings suggest that the televised leaders debates had some impact on vote in the 1984 federal election by influencing those who had voted Liberal in the previous election to switch to the Tories in 1984. Of course, given the magnitude of the Conservative victory, it is questionable whether the absence of debates would have changed the outcome of the election. On the other hand, it must be remembered that leaders debates are widely covered by the media and are watched by a large proportion of the population. Therefore, individuals who do not watch the debates are nevertheless likely to see, hear or read news reports about them. Such individuals are also likely to be aware of the assessments of journalists and others about who performed well and who performed poorly. Non-watchers may also hear friends, family members and colleagues discussing the debates. Thus, to the extent that knowledge about debates is diffused throughout the population, attempts to assess the impact of debates by examining behavioural differences between watchers and non-watchers will underestimate the impact they seek to detect.
For the 1988 election, watching a leaders debate appears to have made people who voted for the New Democratic Party in 1984 more likely to vote for the Liberals in 1988. Given that the Conservatives won the 1988 election, it would therefore seem that the debates were not decisive in determining the outcome of the election. However, as previously discussed, the 1988 debates did change the course of the election by giving the Liberals a major mid-campaign boost in popularity. The evidence in table 3.5 suggests that this boost came at the expense of the NDP and that the Liberals may also have benefited at NDP expense on election day itself. This is not to suggest that the debates were the only reason – or even the major reason – people who had voted NDP in 1984 chose to vote Liberal in 1988. The dynamics of the 1988 election were such that many former NDP voters may have felt that the best way to stop the Free Trade Agreement was to vote Liberal. The data presented here do, however, indicate that NDP-Liberal switching was related to watching a leaders debate in the 1988 election.
It is important to discuss the findings presented in this section in terms of the study’s underlying objectives. What do these findings tell us about the value and role of leaders debates? Taken altogether, they seem to indicate that debates cause at least some people to switch their vote from one election to the next. Therefore, it would seem reasonable to conclude that these individuals learn something from debates that causes them to alter their previous vote. At this point, it is unclear what Canadians learn from leaders debates because no previous studies have examined this question. However, in one sense it does not matter what people learn. Whatever they learn, it seems to help at least some of them make up their minds about how they are going to vote. And although one might question the quality of the information conveyed in televised debates, it is surely no worse – and perhaps considerably better – than that available from other sources. As Jamieson and Birdsell point out: “In campaigns without debates, spot ads and news snippets provide most of our information about those who would lead the nation. In practical terms, this reliance on spots and snippets means that we base voting decisions on bites of information averaging a quarter of a minute to a minute in length” (1988, 123). If debates provide even a few people with more extensive information on which to base their vote decision, most people would conclude that they play a useful role in our electoral process.
THE EFFECT OF LEADERS DEBATES ON VOTER TURNOUT
American scholars have devoted little attention to the relationship between televised campaign debates and political participation. In fact, a literature search yielded only one reference. Kirkpatrick (1979) discusses the question briefly using aggregate data.19 He argues that although both the 1960 and 1976 presidential debates drew large audiences, there was no increase in voter turnout on election day. The turnout in 1960 was 62.8 percent – 3.5 percent above 1956 and 0.9 percent above 1964.20 The turnout in 1976 was only 54.3 percent – lower than in any election since 1948. Kirkpatrick concludes from this evidence: “It is clear that debates did not greatly stimulate interest in voting” (1979, 28–29). Although the evidence he presents – especially from 1976 – appears to support this conclusion, it is always hazardous to draw inferences about individual behaviour from aggregate data. That turnout levels in election years featuring presidential debates are not significantly higher than average or, indeed, are lower than average does not preclude the possibility that debates could influence individual voters’ decisions on whether to vote. One British study presents evidence that at least suggests a link between televised campaign debates and voter turnout. Blumler and McLeod (1974) found that several mass-communications variables were related to turnout in Great Britain, even when the effects of socio-economic status, education, age and gender were controlled. Although these researchers did not examine the impact of debates per se, such events are clearly exercises in mass communication, and so it is conceivable that debates could have a similarly positive effect on voter turnout.
Canadian researchers have shown more interest than their American counterparts in the relationship between watching televised debates and voting. LeDuc and Price (1985) found that 1974 non-voters who reported watching the 1979 leaders debate were more likely to have voted in 1979 than previous non-voters who did not watch the debate.21 They conclude, however, that “it is unlikely that the debates themselves actually stimulated greater voting participation. Rather, it is more plausible that persons already intending to vote were more likely to have watched the debates” (ibid., 153). This conclusion seems reasonable. As LeDuc (1990) reports, debate watching is associated with many other types of political activity. According to the correlations he presents, individuals who participate in various forms of political activity (from watching political programs on television to attending political meetings) are more likely to watch televised debates. Not surprisingly, these same people are also more likely to vote. This finding suggests that the apparent relationship between debate exposure and voter turnout is spurious – the result of both these activities being related to political interest and involvement. In any event, the possibility of a spurious relationship cannot be ignored.
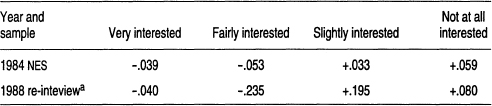
Table 3.6 presents the correlations between voter turnout and debate exposure in both 1984 and 1988 with and without controls for the respondent’s level of interest in the election.22 Interest in the election was chosen as the control variable because it was more strongly associated with turnout than any of the political participation variables in 1984 and because 1988 re-interview respondents were not asked about their participation in political activities other than voting.23 As can be seen from this table, the association between turnout and debate exposure is statistically significant but fairly weak, in both 1984 and 1988. Furthermore, when level of interest in the election is controlled for, the correlations tend to get weaker in each of the partial tables – an indication that the observed association between voter exposure and debate exposure is spurious. The partial correlations are, however, rather interesting in that they seem to indicate that there may be some relationship between debate exposure and voter turnout among those who are less interested in the election. This conclusion is based on the fact that the largest partial correlations are for those who were slightly interested or not at all interested in the election at hand. This effect is particularly strong in 1988.24
Table 3.6
Relationship between voter turnout and debate exposure, with and without controls for level of interest in election, 1984 and 1988
aRefers to 1988 re-interview of 1984 NES respondents.
*p < .001; **p < .01; ***p < .05.
The correlations presented in table 3.6 are not overly encouraging with regard to the capacity of debates to affect voter turnout. Nevertheless, the persistence of a relationship between turnout and debate exposure among individuals who express little interest in the election is intriguing because it suggests that debates may help motivate these people to vote. The loglinear goodness-of-fit statistics displayed in table 3.7 provide a more sophisticated test of the relationship between turnout and debate exposure. The two sets of models presented in the first panel of this table test the hypothesis that voter turnout in 1984 and 1988 was related to debate exposure. The probability levels of the models of independence indicate that these models do not fit the data in either 1984 or 1988. Therefore, we must conclude that voter turnout was indeed related to debate exposure. However, the question of whether this relationship is spurious remains to be addressed.
The issue of spuriousness is dealt with in the second panel of table 3.7, which presents several models designed to test the hypothesis that the association between voter turnout and debate exposure is related to political interest. The saturated model for both 1984 and 1988 assumes a three-way interaction among these variables. The next-simplest model states that turnout is related to interest and debate exposure, and interest is related to debate exposure, but there is no three-way interaction. In 1988, the probability level of the model that omits the three-way interaction is .041, which means that the model does not fit the data. Therefore, the saturated model must be accepted as the best-fitting model. In 1984, however, the probability level of the model that omits the three-way interaction is .414. Therefore, the model cannot be rejected; however, an even simpler model might also fit the data. To test this possibility, three additional models – each omitting one of the two-way interactions – were tested, and all were rejected. Therefore, we must conclude that in 1984 voter turnout was related to both interest and debate exposure, and that interest and debate exposure were also related, but that there was no three-way interaction among these variables.
Table 3.7
Loglinear models of relationship between voter turnout and debate exposure, 1984 and 1988
aT = voter turnout; D = debate exposure; I = interest in election.
bRefers to 1988 re-interview of 1984 NES respondents.
cSaturated model.
dModel of independence.
eModel is accepted as fitting data.
The parameter estimates for the three-way-interaction saturated models of turnout in both elections are presented in table 3.8. Only the parameter estimates for respondents who watched at least one debate are displayed in this table. Looking at these estimates, we can see that there were more slightly interested and uninterested debate watchers who voted in both 1984 and 1988 than would be expected on the basis of the marginal distribution of cases in these tables. Although most of the estimates are small, the direction of the signs is consistent with the notion that the debates may have had some influence on voter turnout among those with low levels of interest in the 1984 and 1988 elections.
Table 3.8
Parameter estimates, voter turnout by interest in election by debate exposure, 1984 and 1988
Notes: Estimates refer to loglinear model of three-way interaction among voter turnout, interest in the election and debate exposure. All parameter estimates are for respondents who both voted and watched at least one debate. Parameters for non-voters and non-watchers may be obtained by reversing the signs.
aRefers to 1988 re-interview of 1984 NES respondents.
The goodness-of-fit statistics, combined with the weak parameter estimates presented in table 3.8, indicate that there is little relationship between debate exposure and voter turnout that cannot be accounted for by the association of both these variables with political interest. Nevertheless, the findings presented in this section suggest that debate exposure may have some effect on voter turnout among people with little or no interest in the campaign at hand. The relationship is not strong, but its implications are important enough that the question warrants further investigation. Even if debates play only a small role in encouraging people to vote who would otherwise be unlikely to do so, they perform a worthwhile function. Voting is the most basic means of political participation in a representative democracy. If we value democracy, we must value participation in the democratic process and, by extension, any mechanism that increases participation.
THE EFFECT OF LEADERS DEBATES ON ATTITUDES TOWARD PARTY LEADERS
As mentioned above, most researchers who studied the 1960 American presidential debates were interested in whether the debates influenced individual vote decisions or the outcome of the election. Many researchers, however, were also interested in whether the debates had changed voters’ attitudes toward the candidates. One of the most extensive studies of the impact of the 1960 debates on candidate image was conducted by Tannenbaum et al. (1962). These researchers asked respondents to rate Kennedy and Nixon before and after the first debate and then again fol lowing the fourth debate, using a series of semantic differential scales. After comparing candidate images before and after the first debate among respondents who watched the debate, to before and after images among those who did not watch, Tannenbaum et al. concluded: “There were substantial and significant differences in the direction and magnitude of image change as a result of the first debate between those respondents who viewed it on TV and those who were not exposed at all” (ibid., 285; italics in original). When exposure to all four debates was considered, however, degree of exposure had little effect on image change. This finding led the researchers to conclude that direct exposure may not have been necessary for an individual to be influenced by the debates: “The video clashes were an integral and vital part of the 1960 campaign – not only as TV events, but also in terms of widespread reports in the press and radio, as topics of face-to-face discussion, and as the focal point for much commentary by political pundits and the like. This very pervasiveness of the debates throughout the contest implies that they may have exerted an impact quite independent of actual TV exposure” (ibid., 288).
Findings from other studies of the 1960 presidential debates support the conclusion that at least the first debate influenced attitudes toward Kennedy and Nixon (e.g., Ben-Zeev and White 1962; Carter 1962; Kraus and Smith 1962; Lang and Lang 1962). The attitude changes found in most studies of the 1960 debates were not large, but researchers studying the 1976 debates found even smaller changes. In fact, most evidence suggests that the 1976 debates had very little impact on voters’ images of Ford and Carter. After reviewing 44 studies of the 1976 debates, Sears and Chaffee concluded that “there was little lasting impact of the debates on evaluations of the candidates, preferences between them, or perceptions of candidates’ attributes” (1979, 244). The apparent insignificant effect of debates on attitudes toward political leaders – like their lack of influence on voting behaviour – is generally attributed to the process of selective perception. This explanation is not without empirical support. Several studies have found that party identification, as well as pre-debate candidate preferences and evaluations, have a strong influence on how debaters are perceived and evaluated (e.g., Hagner and Rieselbach 1978; Kraus and Smith 1962; Lang and Lang 1962; Sigelman and Sigelman 1984).
LeDuc and Price (1990) examined the correlations between debate exposure and overall evaluations of party leaders in the 1979, 1984 and 1988 Canadian elections. Their findings relating to 1979 indicate no statistically significant difference between debate watchers and non-watchers on evaluations of Clark; English-speaking watchers evaluated Trudeau slightly more highly than English-speaking non-watchers; and whether all respondents or only English-speaking respondents were considered, Broadbent was evaluated more highly by those who watched the debate than by those who did not. On the impact of the 1984 debates on overall evaluations of Turner, Mulroney and Broadbent, it was found that people with differing levels of exposure to the debates had significantly different evaluations of all three leaders. Surprisingly, however, all leaders appear to have benefited from the debates – even John Turner, whose performance in the 1984 debates was rated so poorly. In 1988, the only significant correlations were for Turner, who was rated significantly higher by debate watchers than non-watchers. LeDuc and Price conclude: “In virtually every instance where a difference between watchers and non-watchers of a debate can be discerned, the effect is that watchers tend to be more positive in their attitudes toward particular leaders than are non-watchers” (1990, 16).
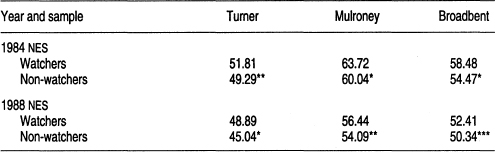
Respondents to the 1984 and 1988 NESs were asked to evaluate the leaders of the Liberal, Progressive Conservative and New Democratic parties using what is known as a “feeling thermometer.” On a feeling thermometer, scores above 50 degrees indicate warm or favourable feelings toward the person being evaluated; scores below 50 degrees indicate cool or unfavourable feelings. Because the feeling thermometer is a summary of an individual’s feelings, differences between ratings of debate watchers and non-watchers provide information about the impact of debates on overall evaluations of party leaders. A comparison of the mean thermometer ratings of the party leaders for those who watched and those who did not watch a leaders debate in 1984 and 1988 is displayed in table 3.9. As can be seen from this table, those who watched at least one debate felt warmer toward all three party leaders than those who watched no debates. In 1984, the difference between watchers and non-watchers is greatest for evaluations of Broadbent and smallest for evaluations of Turner. This suggests that, at least in terms of personal image, Broadbent benefited most from the 1984 leaders debates and Turner benefited least. In 1988, results were reversed: Broadbent benefited least and Turner most. The differences between the leaders, however, are not very large, and the more important conclusion is that all leaders were evaluated more highly by debate watchers than by non-watchers.
Summary measures such as feeling thermometers give us some idea of the impact of televised debates on attitudes toward party leaders. They do not, however, provide any details about the impact of debates on specific components of a leader’s image. An extensive body of research indicates that voters’ images of political leaders are overwhelmingly dominated by personal characteristics.25 Television is particularly well suited for conveying such information. Therefore, we might expect televised debates to influence voters’ judgements about the personality traits of party leaders, although research on selective perception would lead us to assume that this influence would be modest. Fortunately, respondents to the 1984 and the 1988 NESs were not only asked to evaluate party leaders using the feeling thermometer, they were also asked for their impressions of the leaders using semantic differential scales designed to measure their views about specific personal characteristics of the leaders.
Table 3.9
Overall evaluation of leaders, 1984 and 1988
Notes: Evaluation measured as the mean value of a leader’s scores on feeling thermometer.
*p < .001; **p < .01; ***p < .05.
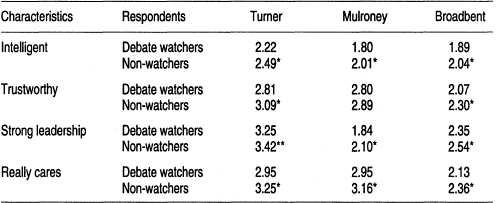
Respondents to the 1984 NES were asked to give their impressions of the three leaders on 14 dimensions: arrogant, competent, ruthless, commands respect, nervous, decent, slick, sincere, shallow, sure of himself, dull, warm, represents change and listens to the views of people in this province. Opinions on each dimension were measured using semantic differential scales on which 1 meant that the word or phrase in question did not describe a leader and 7 meant that it did.26 Respondents to the post-election wave of the 1988 NES were asked for their impressions of each leader on 4 dimensions: intelligent, trustworthy, provides strong leadership and really cares about people like you. In this case, opinions on each dimension were measured using five-point semantic differential scales, on which 1 indicated that the relevant word or phrase fit a leader “a great deal” and 5 indicated that the term fit “not at all.”27 Comparing the mean ratings given by respondents who did and did not watch the leaders debates provides us with information about the impact of the debates on specific components of the leaders’ images. For 1984, this information is presented in table 3.10; for 1988, it is displayed in table 3.11.
Looking first at impressions of Liberal leader John Turner, we see that in 1984 the difference between the ratings of watchers and non-watchers is statistically significant for 5 of the 14 dimensions. Individuals who watched at least one of the 1984 leaders debates felt that Turner was more nervous and less sure of himself than did those who watched no debates. On the positive side, debate watchers felt that Turner was more decent and sincere. Watchers were also more likely than non-watchers to feel that Turner commanded respect, which seems contradictory because watchers were also more likely to feel that Turner was nervous and lacked confidence – traits that do not usually command much respect. The 1984 debates appear to have had the most influence on opinions about Turner’s nervousness. In fact, the largest difference between watchers and non-watchers in table 3.10 is on this trait. On the whole, however, the 1984 debates seem to have had only a minimal impact on judgements about most aspects of Turner’s image – on nine dimensions, there is no statistically significant difference between the views of watchers and non-watchers. For 1988, the differences between watchers’ evaluations of Turner and non-watchers’ evaluations are statistically significant on all four dimensions. In all cases, however, non-watchers evaluated the Liberal leader more highly than watchers, although the differences are not large.
Table 3.10
Judgement of leaders’ personal characteristics, 1984

Notes: Judgement measured as mean value of respondents’ evaluation of each leader on given personal characteristics. Data are derived from the 1984 NES.
*p < .001; **p < .01; ***p < .05.
Table 3.11
Judgement of leaders’ personal characteristics, 1988
Notes: Judgement measured as mean value of respondents’ evaluation of each leader on given personal characteristics. Data are derived from the 1988 NES.
*p < .001; **p < .01.
Turning now to impressions of Brian Mulroney, we find that in 1984 debate watchers held opinions about the Conservative leader that were significantly different from the opinions of non-watchers on 10 of the 14 dimensions. Compared with non-watchers, debate watchers felt that Mulroney was more competent, decent and warm, and that he commanded more respect, was more sure of himself and less dull. Watchers were also more likely to believe that Mulroney represented change and listened to the views of people in their province. On the negative side, debate watchers felt that Mulroney was more ruthless and slick than did non-watchers. On the basis of the evidence presented in table 3.10, it appears that the effect of the 1984 debates on attitudes toward Mulroney was mixed. On the one hand, individuals who watched at least one debate were more positive toward Mulroney on many characteristics. On the other hand, the largest single difference between the views of watchers and non-watchers was Mulroney’s slickness, and in this case debate watchers had the more unfavourable impression. For 1988, the results for Mulroney are similar to those for Turner: the difference between the evaluation of watchers and non-watchers is statistically significant on three out of four dimensions, and in all cases non-watchers evaluated Mulroney more highly than watchers. As with Turner, however, the differences are minor.
Finally, an examination of impressions of NDP leader Ed Broadbent reveals that in 1984 the difference between watchers and non-watchers was statistically significant for nine dimensions. Debate watchers were more inclined to feel that Broadbent was competent, decent, sincere, sure of himself and warm, and that he commanded respect and listened to the views of people in their province. They were less likely to believe he was shallow but more likely to believe he was slick – another apparent contradiction. With the exception of perceptions about his slickness, the 1984 debates appear to have resulted in more positive attitudes toward Broadbent on most characteristics. Interestingly, the debates’ greatest effect on evaluations of Broadbent was on opinions about his warmth. This may indicate that debate watchers responded to Broadbent on a more personal level than they responded to either Turner or Mulroney. For the Liberal and Conservative leaders, the greatest impact of the debates was on judgements of their nervousness and slickness – characteristics that refer more to manner and style than to enduring personal attributes. Turning to images of Broadbent in 1988, we find the differences between watchers and non-watchers were statistically significant for all dimensions, but again it was the non-watchers who evaluated Broadbent more highly. Given the poor evaluation of Broadbent’s 1988 debate performance by the media and the public, this result is not very surprising.
Several conclusions can be drawn from the above findings about the impact of televised debates on attitudes toward party leaders. First, debates appear to have a positive effect on voters’ overall evaluations of all leaders but are also capable of creating negative impressions of particular aspects of their personalities. With respect to the specific components of leader image examined here, no single picture emerges as to which trait judgements are most likely to be affected by televised debates. The debates influenced – for better or worse – the image of each leader in a unique way. It must be noted, however, that the differences between the evaluations of watchers and non-watchers were not great. In no case did they exceed 5 degrees on the 100-degree feeling thermometer or 1 unit on the semantic differential scales. On the other hand, comparing the judgements of watchers and non-watchers may not be a very effective means of assessing the true impact of debates. Because information about leaders debate performances is widely disseminated, non-watchers may come to hold views of the leaders that are very similar to the views of those who saw the debates. For example, the 1984 debate viewer saw John Turner appearing nervous during the debates. The non-viewer saw him being nervous on a clip of the debates shown during the evening news; or heard or read assessments of the debates indicating that Turner was nervous; or was told by friends, relatives or colleagues that Turner was nervous. To the extent that this process occurs, the analysis presented above compares the trait judgements of those with direct debate exposure to the judgements of those with indirect exposure. Given this perspective, we should not expect large differences between debate watchers and non-watchers.
So what does this tell us about the value of leaders debates and the role they play in our electoral process? Two major conclusions may be drawn from the findings in this section. First, given the current cynicism of the Canadian public about politics and politicians, televised debates may be an important means of increasing the esteem in which party leaders are held by the population. Although a certain amount of scepticism about political leaders is healthy in a democratic society, widespread contempt and disdain for those who seek our highest political office is not. Therefore, to the extent that they improve viewers’ images of the party leaders, debates may increase support for the political system and reduce feelings of alienation. Second, there are indications that debates help viewers to assess the personal characteristics of the party leaders and to compare their individual strengths and weaknesses. Since many Canadians base their voting decisions on such assessments, it would seem that debates are fulfilling a useful function by providing this information.
THE EFFECT OF LEADERS DEBATES ON POLITICAL KNOWLEDGE
Up to this point, we have been examining the persuasive capacity of televised debates: their ability to change individual vote decisions, stimulate turnout and change attitudes toward party leaders. Virtually all empirical studies of the Kennedy-Nixon debates focused on their impact on behaviour and attitudes, as did most studies of the Carter-Ford debates. As has been noted, most of these studies concluded that the impact of debates is limited because viewers come to them with preexisting attitudes that colour their perceptions. Both the direction of this research and its conclusions were in line with the “limited effects” and “minimal consequences” theories popular among mass commu nications researchers in the 1960s. In the 1970s, however, some scholars began to question both the preoccupation with persuasion effects and the conclusion that the media had little impact. These researchers argued that although unable to persuade people to change their behaviour or attitudes, the media transmitted information effectively and thereby influenced levels of knowledge. According to this view, conclusions about the limited effects of the media were at least partially a result of researchers concentrating on persuasion effects rather than transmission effects.28
A few studies of the Carter-Ford debates reflected the emerging interest in political knowledge and information transmission. The conclusion of most of these studies was that televised debates increased the level of knowledge people had about the candidates and the issues of a given election. In their study of the 1976 debates, Becker et al. (1978) found that following the first Carter-Ford debate more people could describe the candidates “to a friend who was unfamiliar” with them than had been able to do so before the debate, and that the increase was greatest for those who actually saw the debate. These researchers also found that more people knew the stands of the candidates on specific policy issues after the first debate than knew this information before the debate; again, the increase was greatest for those who saw the debate. Evidence presented by Miller and MacKuen (1979) is even more supportive of the notion that debates contribute to political learning. These researchers found that the amount of information an individual had about the candidates increased with the number of debates watched. Moreover, the 1976 debates had a strong independent impact on knowledge about the candidates even in the presence of controls for education, strength of partisanship, frequency of newspaper reading and exposure to television news. These researchers also found that debate watching led to perceptions of greater differences between the candidates and the parties on several policy issues.
No data on the contribution of televised debates to the political knowledge of the Canadian electorate have been published. The issue, however, is important. Most previous studies have concluded that debates have little influence either on the political behaviour of Canadians or on their attitudes toward party leaders. Although the findings presented in this study represent a modest challenge to this conclusion, the debate effects documented thus far are not large. As discussed above, however, the potential impact of debates is not limited to persuasion effects. Debates may fail to change political attitudes or behaviour but still transmit political information. It is necessary, therefore, to investigate possible transmission effects before drawing any final conclusions about the impact of debates. The capacity of televised debates to increase political knowledge is also important from the perspective of democratic theory. The ability of the people to make informed electoral choices is essential to the success of a democracy. If debates increase the amount of information Canadians have about the leaders from whom they must (indirectly) choose a prime minister, about the parties from which they must select a government or about the issues with which that government must deal, then it would seem that debates serve a very useful purpose indeed.
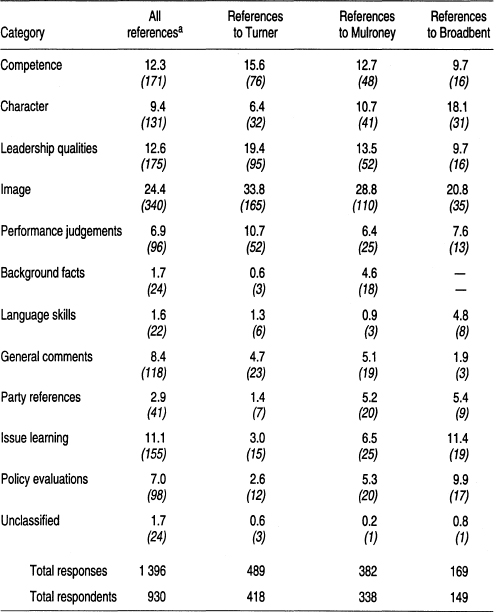
The impact of the 1984 leaders debates on the political knowledge of Canadians is examined in two ways: first, by exploring voters’ own subjective assessments of what they learned from the debates and, second, by assessing the impact of the debates on several objective measures of political knowledge. The 1984 NES included an open-ended question asking all respondents who reported viewing at least one debate what they learned about the party leaders from the debates that they did not already know.29 Of the 2246 respondents who watched at least one debate, only 930, or 41 percent, reported learning anything new about the party leaders; the rest said they had learned nothing new or they didn’t know what they had learned. The 930 people who said that they did learn something new gave almost 1400 responses, and approximately 500 different responses, to the question. All substantive responses – that is, all responses other than “nothing” and “don’t know” – were grouped into 12 categories. The categories are listed in table 3.12, along with the percentage of all substantive responses in each category and the percentage of references to each leader in each category.
The first three categories listed in table 3.12 – competence, character and leadership qualities – refer to enduring personality traits. Included in the competence category are traits such as capable, thoughtful, serious, intelligent and experienced, as well as the negative counterparts of these traits. The character category includes references to traits such as honest, sincere, direct, humble and compassionate, and on the negative side, evasive, sleazy, superficial and dishonest. Examples of traits in the leadership qualities category include charismatic, statesmanlike, strong, confident, decisive and their negative counterparts. The fourth category – image – includes references to style and manner: good communicator, entertaining, rusty, effective speaker, nervous, poised, articulate and bumbling. The performance judgements category is reserved for explicit judgements about the debate performances of the party leaders. Some comments in this category are: expected more of him, stronger than expected, met my expectations, best of a bad lot, influenced me most. The background facts category includes all references to specific information about the family and ethnic backgrounds, occupations and career paths of the leaders. The language skills category includes all references to the ability or inability of the leaders to communicate in a specific language; most references in this category refer to facility in French.
Table 3.12
Respondents’ assessments of what they learned from the 1984 debate
(percentages)
Notes: Cell entries are the percentages of substantive responses that fit the stated category. Numbers in parentheses are cell Ns. Data are derived from the 1984 NES.
aIncludes responses that were not leader-specific.
The final five categories listed in table 3.12 are less personal than the first seven categories. General comments is a catch-all category for non-specific comments such as: learned what he’s like, learned more about him, learned I like/dislike him and got to know him. The party references category includes all comments referring to political parties rather than party leaders. Comments about issues are divided into two categories: issue learning and policy evaluations. The issue learning category is reserved for references to learning about campaign issues from the debates. Some of these comments specify particular issues such as inflation, unemployment, abortion, pensions and women’s issues; others are more general (e.g., learned his stand on issues, learned about his promises and learned about his policies). The policy evaluations category includes all issue references that are evaluative in nature, for example: had no answers, not informative, had solutions, clarified issues, thinks the treasury is bottomless, didn’t agree with his policies and made a lot of promises. Finally, the unclassified category contains a few comments that could not be placed in any of the other 11 categories. Responses included: they tended to confuse me, learned we need some new politicians in this country and exceedingly boring debates.
As can be seen from table 3.12, the most frequently mentioned category was image; 24 percent of all responses to the open-ended learning question referred to the leaders’ images. Although image comments especially dominated references to Turner (fully 34 percent of the comments about Turner fell into this category), they were the most frequent type of comment for all three leaders. This evidence is not very encouraging in terms of the quality of information learned from televised debates, since comments in the image category tend to refer to superficial things like mannerisms and speaking style. The evidence is even more discouraging if comments about the leaders’ debate performances are added to image comments. These two categories account for 31 percent of all comments, 45 percent of all references to Turner, 35 percent of all references to Mulroney and 28 percent of all references to Broadbent. The conclusions from table 3.12 are not, however, all negative. If the responses in the first three categories – competence, character and leadership qualities – are combined, they account for 34 percent of all responses, 41 percent of all references to Turner, 37 percent of all references to Mulroney and 38 percent of all references to Broadbent. Knowledge about leaders’ competence, character and leadership qualities is clearly important for assessing ability and fitness to become prime minister of Canada, and the debates appear to have contributed to the public’s knowledge about these traits. In addition, 11 percent of all responses refer to learning about the issues of the campaign and another 7 percent to issues in an evaluative context.
Although the typology presented in table 3.12 is a useful summary of what individuals think they learned from the 1984 debates, it is probably not a good measure of actual learning. Self-reported information is notoriously unreliable – especially when respondents are questioned many months after the event has occurred, as was the case with the 1984 NES. The problem, of course, is that we have no idea if the information respondents say they learned from the debates was actually learned from the debates or some other source. A more objective measure of political knowledge – and of the impact of debate exposure on that knowledge – is therefore required before any firm conclusions can be drawn.
Table 3.13 presents the results of five multiple regression analyses, each designed to determine the impact of watching the 1984 leaders debates on a different measure of political knowledge. Five independent variables are included in each regression equation: debate exposure, measured by the number of debates watched (0 to 3); education; political interest; media use; and political involvement.30 The last four variables are included because studies have indicated that they are important determinants of political knowledge (e.g., Lambert et al. 1988; Miller and MacKuen 1979). Thus, their influence must be accounted for if we are to obtain an accurate assessment of the independent impact of the debates.
The five measures of political knowledge used in this analysis assess the amount of information an individual has about a given topic. The only question in the 1984 NES that could reasonably be used to assess the accuracy of political knowledge asks respondents to name the provincial premiers. This question is not used in this analysis because information of this nature is not likely to be conveyed in debates involving federal party leaders. The first measure of political knowledge is the number of responses to an open-ended question about the most important issue in the 1984 election.31 The second refers to the number of responses to a closed-ended question asking which of the three major parties would do the best job and which would do the worst job of handling several important tasks of government.32 The third measures the number of non-neutral assessments respondents could make about the personality traits of the party leaders. This variable was developed from the responses to the closed-ended question, discussed earlier in this study, that asked respondents how well or poorly a list of personality traits fit each party leader.33 The fourth measure refers to the number of responses volunteered when respondents were asked what they liked and disliked about each of the federal party leaders.34 The fifth measure of political knowledge is the number of responses volunteered when respondents were asked what they liked and disliked about the three major federal political parties.35
Table 3.13
Determinants of political knowledge, 1984

Notes: Data are derived from the 1984 NES.
aNumbers in this part of the table are standardized regression coefficients. For all equations N = 3 374.
*p < .001; **p < .01; ***p < .05.
As can be seen from the standardized regression coefficients displayed in table 3.13, debate exposure had a statistically significant positive impact on all five measures of political knowledge even after the effects of education, political interest, media use and political involvement were accounted for. The greater the number of debates watched, the more issues could be named as important election issues, the more times one party could be named as the best or worst to handle certain tasks, the more non-neutral assessments could be made of the leaders’ personality traits, and the more reasons could be given for liking and disliking the parties and party leaders. The clearest indication of the impact of the debates on political knowledge is the proportion of the total R2 for each regression equation that can be attributed to debate exposure. R2 is a measure of the variance in a dependent variable that can be explained by the combined effects of the independent variables. Thus, the proportion of R2 due to debate exposure is a measure of how much of the variance in political knowledge can be explained by the fact that a respondent watched a leaders debate. This figure ranges from 1 percent for the most important issue in the election to 6 percent for personality trait judgements and leader likes and dislikes; for the best/worst party equation and the party likes and dislikes equation, this figure is 2 percent.
The statistics presented in table 3.13 suggest that the most important effect of debate exposure on political knowledge is to increase the amount of information individuals have about the party leaders. Strong independent debate effects were found for both measures of this type of information. Debate exposure, however, also increased the amount of information individuals had about the parties, as well as their ability to choose which party could best deal with certain important government tasks. Debate exposure had the smallest impact on the number of issues that could be named as the most important in the election. Perhaps this information is more widely available from other sources than are the other types of information. The strong beta coefficients for political interest and media use in this equation support this conclusion.
Before concluding our analysis of the effect of the 1984 debates on political knowledge, we must test one remaining hypothesis. Miller and MacKuen found that the impact of debate exposure on knowledge about presidential candidates was greatest for those with low levels of political attentiveness. They argued that this finding confirmed the “uses and gratifications” model of media effects: “Basically this model assumes that individuals have different motivations and media usage habits and that media effects on voters depend upon these motivations to follow the campaign. The highly attentive are likely to be informed about politics even without presidential debates; thus for them the debates may not be as crucial an information source as for the less attentive” (1979, 329). Similarly, Patterson found that debate exposure had the most influence on issue awareness among those with low levels of interest in politics. He provided an explanation similar to that offered by Miller and MacKuen (1979): “The contribution of these telecasts, it would appear, depends on whether the issue information they provide is already possessed by the voter or is likely to be obtained from another source. High interest voters were more highly informed about the candidates’ positions before the … debates, and most of them followed a newspaper regularly; consequently, these telecasts’ information was somewhat redundant” (Patterson 1980, 165).
For our purposes, the major hypothesis generated by the uses and gratifications model is that televised debates have a greater effect on the political knowledge of people with few other sources of political information than on the knowledge levels of those who have other means of finding out what they need to know. This hypothesis was tested by combining the five measures of political knowledge already discussed into a summary measure of political knowledge.36 This summary measure was regressed on the five independent variables discussed above: education, political interest, media use, political involvement and debate exposure. The media use variable was then removed from the analysis, and the equations were rerun separately for those with low and high levels of media use.37 The results of this analysis – displayed in table 3.14 – strongly support the hypothesis that the impact of televised debates on political knowledge is greatest for those with few other sources of political information. The regression coefficient for the debate exposure variable is more than twice as large for low media users as for high users. Among low media users, debate exposure was a stronger predictor of political knowledge than education, political interest or involvement; among high media users, the impact of debate exposure was weaker than the impact of other predictors. Finally, the proportion of the total explained variance in political knowledge due to debate exposure was 21 percent among low media users and only 4 percent for high media users.
It is not possible to carry out the above analysis for the 1988 election because comparable questions were not asked in either the 1988 re-interview or the 1988 NES. Other types of analysis, however, can assess the impact of the 1988 debates on political knowledge. Because the 1988 NES included a campaign-period survey, it is possible to look at the immediate impact of the 1988 debates on the knowledge levels of the Canadian electorate. Three scales designed to measure levels of political knowledge were created using 1988 NES data. The first scale measures subjective knowledge of the major party leaders; that is, it measures how much respondents felt they knew about the leaders.38 The second scale measures knowledge of party positions on three major issues: promotion of French, relations with the United States and levels of taxes and services.39 The third scale measures knowledge of the party leaders’ positions on the same three issues.40 Figure 3.3 tracks levels of knowledge throughout the 1988 campaign, as measured by these three scales. As this figure illustrates, knowledge levels are noticeably higher in the post-debate period (intervals 8 through 16) than in the pre-debate period. Although one would expect knowledge levels to increase as the campaign progressed, the interval in which the debates were held (interval 7) seems to mark the shift to higher knowledge levels – especially about the parties’ and leaders’ positions on issues. These results would seem to indicate that the 1988 leaders debates had a modest but immediate impact on levels of political knowledge.
Table 3.14
Determinants of political knowledge for all respondents, and for selected media users, 1984
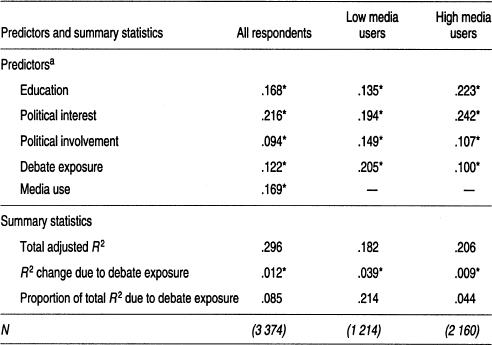
Notes: Data are derived from the 1984 NES.
aNumbers in this part of the table are standardized regression coefficients.
*p < .001.
Taken altogether, the findings presented in this section lead to the conclusion that televised debates transmit information to the public and, in this manner, contribute to a more informed Canadian electorate. Analysis of the 1988 election indicated that political knowledge increased following the leaders debates. Analysis of the 1984 election also indicated that debate exposure increased political knowledge. The debate effects documented in the multiple regression analyses were not powerful; indeed, the debate exposure variable produced the weakest or second-weakest coefficients of the five independent variables. It can be argued, however, that finding debate exposure to have any impact on political knowledge independent of “heavy-hitting” predictors such as education, political interest, media use and political involvement is notable; a stringent test was applied and passed. Moreover, it should be noted that all the questions used to measure political knowledge for the 1984 analysis were asked many months after the debates. It would appear, therefore, that the information learned from the debates is retained long after the events themselves have faded from the public eye. Probably the most important finding presented here – indeed, probably the most important finding in the entire study – is that debates are an especially significant source of political information among those members of the electorate who have few other information sources. Given this fact, it seems clear that televised leaders debates play a crucial role in our electoral process.
Figure 3.3
Respondents’ scores on three knowledge scales, 1988

Notes: Data are derived from the 1988 NES.
aIntervals start on 4 October and end on 20 November. AH but the sixteenth are three-day intervals; the sixteenth is a two-day interval. No data were gathered on 10 October. The average sample size of the intervals is 226 respondents. The debates occurred during the seventh interval.
CONCLUSIONS AND RECOMMENDATIONS
This study has examined the impact of the 1984 and 1988 Canadian federal party leaders debates on individual vote decisions, voter turnout, attitudes toward the party leaders and political knowledge. With regard to vote decisions, it was concluded that the 1984 debates had some impact by apparently influencing individuals who voted Liberal in 1980 to vote Conservative in 1984. Whether this impact was sufficient to determine the outcome of the 1984 election is unknown; however, given the size of the Conservative victory, it is unlikely that any single event was decisive. More likely, many factors all pointing in the same direction combined to produce the victory, although the debates were, undoubtedly, one of those factors. Analysis of the 1988 election revealed that watching a debate appears to have made people who voted for the New Democratic Party in 1984 more likely to vote Liberal in 1988. Since the Conservatives won the 1988 election, it would seem that the debates did not greatly influence the outcome. The debates did, however, change the course of the 1988 election by increasing support for the Liberals and thus making the campaign a much closer fight in the post-debate period than it had been in the pre-debate period.
For voter turnout, a statistically significant relationship was found between debate watching and voter turnout in both 1984 and 1988. However, further analysis led to the conclusion that this relationship was spurious – both debate watching and turnout were related to the respondent’s level of interest in the campaign. Interesting but statistically inconclusive results pointed to the possibility that watching televised debates may have encouraged individuals with little interest in the election to vote.
The most important conclusion drawn from examining the impact of debates on attitudes toward the party leaders was that debates have a positive influence on voters’ overall evaluations of party leaders. In both 1984 and 1988, debate watchers evaluated all three party leaders significantly more positively than non-watchers. The debates also influenced voters’ judgements about the personal characteristics of the party leaders. With regard to specific traits, however, debates appear to be capable of creating negative impressions as well as positive impressions. No single picture emerged as to which trait judgements debates are most likely to affect; the debates influenced the image of each leader differently. The differences between debate watchers and non-watchers were not very large, but since information about the debates is widely diffused throughout the population, analyses that compare watchers and non-watchers may be comparing only the impact of direct versus indirect debate exposure.
When respondents to the 1984 NES were asked what they learned from the debates, the most frequent responses were about the images and performances of the leaders. A high percentage of responses also dealt with learning about the leaders’ competence, character and leadership qualities, and a smaller proportion focused on policy issues. When gains in political knowledge were assessed by more objective means, it was found that debate exposure had a statistically significant positive impact on several types of knowledge, independent of the impact of education, political interest, political involvement and media use. The effect was particularly strong for people who rarely or never use other sources of information. Analysis of political knowledge carried out using 1988 NES data indicated that debates had a small but immediate impact on knowledge levels.
The aim of this study was to examine the impact of televised leaders debates and to assess the value of these events and the role they play in the Canadian electoral process. Taken altogether, the findings presented in this study strongly suggest that televised debates play a valuable role in Canadian election campaigns. Although this research did not uncover massive debate effects, it did reveal that debates have a discernible influence on the Canadian electorate and that this influence is overwhelmingly positive. First, since vote switching is related to debate exposure, it would appear that debates are capable of aiding the vote decision of at least some of the people some of the time. Second, debates may encourage people who are less interested in politics to vote, although the findings on this issue were not conclusive. Third, debates appear to aid voters in assessing the personal characteristics of the party leaders and to enhance their overall evaluations of those leaders. Finally, and most important, it seems clear that debates contribute to the political information on which voters – especially low media users – base their decisions.
As to whether debates should be a mandatory part of Canadian elections, I would have to agree with those who support such a move. Although debates appear on their way to becoming a regular feature of federal election campaigns in this country, their presence is not assured. The political interests of an individual party leader might well intervene at some point to prevent a debate. This should not be allowed to happen. Televised debates are the only opportunity – except for party ads and 30-second news bites – that most voters have to see and hear the party leaders. And, as the evidence presented in this study demonstrates, voters use this opportunity in a variety of ways that enhance the quality of the democratic process. No individual should have the right to obstruct this process by scuttling a televised debate. This is particularly true given that the individual most likely to refuse to debate is the one who already has the most control over the electoral process – the prime minister.
Not surprisingly, many people disagree with the notion of mandatory debates. Some opponents argue that the media should not be forced to carry any particular content. Others argue that party leaders should not be required to debate because the principle of freedom of speech implies the freedom to remain silent. These arguments, however, should not be allowed to prevent the institutionalization of debates. Although it would be improper to require the media to cover any particular event, I would argue that debates are more akin to public-service broadcasting than to conventional news. Therefore, it would be neither improper nor unprecedented to require the television networks to carry debates, since broadcasting during election periods is already regulated and broadcasters are already required to provide free time to the political parties. As to the argument that politicians have the right to remain silent, it seems to me that this right should not and need not prevent debates from taking place. Party leaders could be required to be present for a debate, while retaining the right not to speak. Of course, any leader exercising this right might well be penalized by the voters, but that is preferable to allowing the voters to be penalized by the politicians. I believe that the evidence presented in this study on the positive impact of debates on the Canadian electorate is sufficient to warrant the institutionalization of debates. Such a move might well infringe on the rights of the media and the political parties. However, whenever the interests of the media, the parties and the voters conflict, the interests of the voters should prevail.
NOTES
1. For further discussion of the factors politicians consider in deciding whether to participate in televised debates, see Cheney (1979), Kirkpatrick (1979), LeDuc (1990) and Martel (1983).
2. See, for example, Bishop et al. (1978), Bitzer and Rueter (1980), Jamieson and Birdsell (1988), Kraus (1962, 1979, 1988), Martel (1983) and Ranney (1979).
3. Some findings regarding the effects of Canadian campaign debates are presented by Lanoue (1991), LeDuc (1990) and LeDuc and Price (1985, 1990).
4. The tendency of the North American media to cover the “horse-race” aspects of televised debates and of election campaigns in general is well documented. See, fo: example, Frizzell and Westell (1985), Frizzell et al. (1989), Kraus (1988), Patterson (1980) and Robinson and Sheehan (1983).
5. For an examination of the factors influencing the vote decision in Canada, see Clarke et al. (1979, 1984, 1991).
6. The 1984 NES was conducted by R.D. Lambert, S.D. Brown, J.E. Curtis, B.J. Kay and J.M. Wilson. The face-to-face interviews for this study were carried out by Canadian Facts Ltd. The 1988 re-interview of 1984 NES respondents was conducted by R.D. Lambert, S.D. Brown, J.E. Curtis, B.J. Kay, L. LeDuc and J.H. Pammett. The telephone interviews for this study were carried out by the Carleton University Journalism Survey Centre. The 1988 NES was conducted by R. Johnston, A. Blais, H.E. Brady and J. Crête. The telephone interviews for this study were conducted by the Institute for Social Research, York University. All of these studies were funded by the Social Sciences and Humanities Research Council of Canada (SSHRCC). The principal investigators, SSHRCC and those responsible for collecting the data bear no responsibility for the analysis and interpretations presented here.
7. The 1984 NES and the 1988 re-interview did not ask respondents which leader had won the debates. Respondents were, however, asked the following question: “In your opinion, how well did each of the leaders perform in the debates that you saw? The closer to ‘10’, the better you think a leader did, the closer to ‘0’, the poorer you think he did.” For the purposes of this study, a respondent is considered to have felt a given leader won the debate if he or she rated that leader’s performance more favourably than the performances of his opponents. Respondents in the post-election wave of the 1988 NES were asked: “Which leader performed BEST in the debate?” The almost identical results from the two 1988 election studies indicate that the performance evaluation questions are an adequate measure of which leader was felt to have won the debates.
8. For a summary of the results of public opinion polls conducted during the 1984 election, see Frizzell and Westell (1985, 82). Polls taken before the first two debates gave the Conservatives between 39 percent and 43 percent of the decided vote, the Liberals 45 percent to 49 percent. The CTV poll conducted immediately following these debates placed the Conservatives at 45 percent and the Liberals at 36 percent.
9. The data in figure 3.1 are derived from the campaign-period survey of the 1988 NES. The average daily sample from 25 October to 20 November was 80 respondents. The figures for 25 October give Mulroney a slight edge over his opponents. These figures, however, are based on only 19 respondents whose assessment could be based only on the 24 October French debate.
10. For a summary of the results of public opinion polls conducted during the 1988 election, see Frizzell et al. (1989, 95).
11. The vote intention question in the 1988 NES is worded as follows: “Which party do you think you will vote for: the Conservative Party, the Liberal Party, the New Democratic Party, or another party?” Respondents who said they didn’t know how they were going to vote were asked: “Perhaps you have not yet made up your mind. But which party are you leaning towards now?” The results of these two questions were combined to produce the data displayed in figure 3.2. The x-axis of figure 3.2 groups the interview dates into 16 intervals, as follows:
Interval 9: October 29–31 | |
Interval 2: October 7–9 | Interval 10: November 1–3 |
Interval 3: October 11–13 | Interval 11: November 4–6 |
Interval 4: October 14–16 | Interval 12: November 7–9 |
Interval 5: October 17–19 | Interval 13: November 10–12 |
Interval 6: October 20–22 | Interval 14: November 13–15 |
Interval 7: October 23–25 | Interval 15: November 16–18 |
Interval 8: October 26–28 | Interval 16: November 19–20 |
No interviews were conducted on 10 October. The average sample size of these intervals is 226 respondents.
12. In their paper, LeDuc and Price present data indicating that impressions of Progressive Conservative leader Joe Clark’s debate performance were less positive than impressions of his opponents’ performances. Debate watchers, however, were more likely than non-watchers to vote Conservative. Therefore, LeDuc and Price conclude that “watchers of the debates were not more likely to have voted Conservative, but Conservatives were more likely to have watched the debates” (1985, 150).
13. The correlation in question is between watching the English debate and not voting for the New Democratic Party.
14. Since the debates involved only the leaders of the Liberal, Progressive Conservative and New Democratic parties, respondents who voted for other parties are excluded from the analysis. The 1988 data presented in tables 3.3 to 3.8 are from the re-interview of 1984 NES respondents. The question regarding debate exposure in both the 1984 NES and the 1988 re-interview is worded as follows: “Did you see any of the debates among the federal party leaders on television?”
15. 1980 vote was measured in 1984 and is, therefore, subject to recall error. However, to the extent that respondents tend to report past behaviour that is consistent with current behaviour, vote switching will be underestimated rather than overestimated, and there is no reason to suspect that debate watchers will recall their vote in 1980 any more or less accurately than non-watchers. For a discussion of the problems of recall data, see MacDermid (1987) and Wiseman (1987).
16. Since the 1984 NES and 1988 re-interview constitute a panel, actual 1984 vote was used to measure previous vote in 1988.
17. The likelihood-ratio chi-square is similar to the traditional chi-square statistic, but is calculated using maximum-likelihood methods. Knoke and Burke argue that the likelihood-ratio statistic is preferable to the chi-square (1980, 30).
18. Since the debate exposure variable is dichotomous, the parameters for non-watchers can be obtained simply by reversing the signs.
19. The absence of individual-level information on the impact of debates on voter turnout in the United States is probably due, at least in part, to the tendency of American debate researchers to employ experimental research designs or multiple-wave surveys administered at various times during the campaign. Information on whether respondents voted cannot be obtained in most of these studies because the data are collected before election day.
20. Although Kirkpatrick (1979) does not make the point, the slightly higher turnout in 1960 can presumably be attributed to the public’s heightened interest in the close campaign.
21. The difference between the groups was statistically significant and persisted in the presence of controls for language and socio-economic status. Language is an important control in any analysis of the 1979 debate because the debate was in English only.
22. As with the previous analyses, the debate exposure variable is dichotomous. The turnout question in both the 1984 NES and the 1988 re-interview is worded as follows: “Now, thinking about this year’s federal election, we find that a lot of people weren’t able to vote because they were sick, or didn’t have time, or had some other reasons for not voting. How about you? Did you vote this time, or did something happen to keep you away from voting?” The election interest question is worded as follows: “We have found that people sometimes don’t pay too much attention to elections. How about yourself? Were you very interested in the recent federal election, fairly interested, slightly interested, or not at all interested in it?”
23. The correlation (Pearson’s r) between turnout and interest was .372 in 1984. The correlations between turnout and various other forms of participation ranged from .241 for reading about politics to .121 for trying to convince friends how to vote.
24. The correlation for those who were not at all interested in the 1988 election is not statistically significant, but this can be attributed to the small number of respondents in this category.
25. For analyses of the content of leader images in the United States since 1952, see Miller et al. (1986), Nie et al. (1979) and Shabad and Anderson (1979). For an analysis of the content of leader images in Canada from 1974 to 1984, see Brown et al. (1988).
26. The 1984 NES scales were introduced as follows: “Now we’d like to know your impressions of what certain political leaders are like. I’ll read a word or phrase, and I’d like you to tell me how well it fits or describes each of the three leaders shown on this card. The more you think the word or phrase describes a leader, the closer your answer should be to ‘7’. The less it fits, the closer your answer should be to ‘1’. If you have no idea at all about how a word or phrase fits a leader, tell me and we’ll go on to the next one.”
27. The 1988 NES scales were introduced as follows: “Now, we’d like to know about your impressions of the party leaders. I am going to read a list of words and phrases people use to describe political figures. After each one, I would like you to tell me how much the word or phrase fits your impressions.”
28. For debates research, the pivotal articles on these issues appear to be Becker et al. (1975), McCombs (1972) and Robinson (1972). For a recent, brief review of research in the field of political communications, see Iyengar and Lenart (1989).
29. The exact wording of this question is: “What did you learn, if anything, that you didn’t already know about the leaders from the televised debates?” Up to two responses were recorded for each respondent.
30. The wording of the education question is: “What is the highest grade or level of school you reached?” The responses are: no formal education, some elementary, elementary graduate, some high school, high school graduate, some college or technical school, college or technical school graduate, some university, bachelor’s degree and graduate/professional degree. The political interest variable is a 0–5 scale created by summing the responses to two questions: one on interest in the 1984 election and one on attention to politics generally. The wording for the interest question is given in note 22. The wording of the attention question is: “Do you pay much attention to politics generally – that is, from day to day, when there isn’t a big election campaign going on? Would you say that you follow politics very closely, fairly closely, or not much at all?” The media use variable is a 0–6 scale created by summing the responses to the following two questions: “How often do you read about politics in the newspapers and magazines?” and “How often do you watch programs about politics on television?” The responses to these two questions, as well as to the other questions included in the traditional political participation battery, are: often, sometimes, seldom and never. The political involvement variable is a 0–18 scale created by summing the responses to the remaining six political participation questions, which ask respondents how often they discuss politics with other people, try to convince friends to vote the same as themselves, attend a political meeting or rally, contact public officials or politicians, spend time working for a political party or a candidate, and contribute money to a political party or candidate.
31. The most important issue question is: “Now, I would like to ask you some questions about the 1984 federal election. What, in your opinion, was the most important issue in that election? Was there any other issue that you think was important in the 1984 federal election? What was it?” The most important issue scale runs from 0 to 2. If no substantive response was given, the respondent scored 0; two substantive responses scored 2. All responses other than “nothing” and “don’t know” were considered substantive.
32. The best/worst party question is: “Now, I’m going to ask you about a number of tasks that the federal government has to deal with. Forget for a moment the likelihood of each party getting elected to government. I’d like you to tell me which of the three major federal parties would probably do the best job and which would probably do the worst job on each task if it were the government” Inquiries were made about 12 tasks: controlling inflation, dealing with the provincial governments, dealing with the United States, handling relations with Quebec, running the government competently, dealing with unemployment, providing social welfare measures, protecting the environment, limiting the size of government, dealing with women’s issues, working for world peace and handling the deficit. Responding Liberal, Conservative or NDP for a given task resulted in a score of 1. Saying that there is no difference among the three parties, that more than one party is the best or worst, or that you don’t know which party would do the best or worst job was scored 0. Therefore, the best/worst party scale is a measure of the number of times a respondent named one of the three major parties as the best or worst to deal with a given task. This scale runs from 0 to 24.
33. The wording for the trait judgement question is given in note 26, and the list of traits is presented in table 3.10. Neutral responses (4 on the 1–7 scales) were coded 0, as were the responses “don’t know” and “refused”; all other responses were coded 1. The personality trait judgement scale is 0–42.
34. The leader like/dislike question is: “Now, we would like to ask you about your impressions of the various leaders of the federal political parties. Is there anything in particular you like/dislike about Mr. __________? Anything else?” Up to three likes and three dislikes were coded for each leader, resulting in a scale that could run from 0 to 18 but in reality runs from 0 to 16.
35. The party like/dislike question is: “Now, I would like to ask you what you personally think are the good and bad points about the political parties at the federal level in Canada. Is there anything in particular that you like/dislike about the federal Liberal/PC/NDP? Anything else?” Up to two likes and two dislikes were coded for each party, resulting in a 0–12 scale.
36. Summing all five measures results in a 93-point scale.
37. Low level of media use was defined as a score between 0 and 3 on the 7-point media use scale described in note 30. High level of media use was defined as a score between 4 and 7.
38. The 1988 NES subjective leader knowledge question is: “First I’m going to read a list of names of people in politics. For each name, please tell me whether you know quite a lot, a fair amount, just a little, or nothing at all about the person.” Respondents who said they knew nothing at all about a leader were given a score of 0; those who said they knew quite a lot were given a score of 3. The subjective leader knowledge scale runs from 0 to 9.
39. The 1988 NES party issue position knowledge scale was created from nine closed-ended questions that asked survey respondents for the positions of the three major parties on three issues: (a) “Does the Federal __________ party think that much more, somewhat more, about the same as now, somewhat less, or much less should be done to promote French?” (b) “Does the Federal __________ party think that Canada should be much closer to the United States, somewhat closer, about the same as now, somewhat more distant, or much more distant?” (c) “Does the Federal __________ party think the level of taxes and services should be much higher, somewhat higher, about the same, somewhat lower, or much lower than now?” Those who responded to these questions were given a score of 1; those who refused to answer or said they didn’t know scored 0. This scale runs from 0 to 9.
40. The 1988 NES leader issue position knowledge scale was created from nine closed-ended questions that asked survey respondents for the positions of the three federal party leaders on three issues. The format of these questions and the specific issues they addressed were the same as those used to measure party positions. Responses were also coded the same way (see note 39).
REFERENCES
Becker, L.B., M.E. McCombs and J.M. McLeod. 1975. “The Development of Political Cognitions.” In Political Communication: Issues and Strategies for Research, ed. S.H. Chaffee. Beverly Hills: Sage Publications.
Becker, L.B., I.A. Sobowale, R.E. Cobbey and C.H. Eyal. 1978. “Debates’ Effects on Voters’ Understanding of Candidates and Issues.” In The Presidential Debates: Media, Electoral, and Policy Perspectives, ed. G.F. Bishop, R.G. Meadow and M. Jackson-Beeck. New York: Praeger.
Ben-Zeev, S., and I.S. White. 1962. “Effects and Implications.” In The Great Debates: Kennedy vs. Nixon, 1960, ed. S. Kraus. Bloomington: Indiana University Press.
Berelson, B.R., P.F. Lazarsfeld and W.N. McPhee. 1954. Voting. Chicago: University of Chicago Press.
Bishop, G.F., R.G. Meadow and M. Jackson-Beeck, eds. 1978. The Presidential Debates: Media, Electoral, and Policy Perspectives. New York: Praeger.
Bitzer, L., and T. Rueter. 1980. Carter vs Ford: The Counterfeit Debates of 1976. Madison: University of Wisconsin Press.
Blumler, J.G., and J.M. McLeod. 1974. “Communication and Voter Turnout in Britain.” In Sociological Theory and Survey Research, ed. T. Leggatt. Beverly Hills: Sage Publications.
Brown, S.D., R.D. Lambert, B.J. Kay and J.E. Curtis. 1988. “In the Eye of the Beholder: Leader Images in Canada.” Canadian Journal of Political Science 21:729–55.
Campbell, A., P.E. Converse, W.E. Miller and D.E. Stokes. 1960. The American Voter. New York: John Wiley and Sons.
Carter, R.F. 1962. “Some Effects of the Debates.” In The Great Debates: Kennedy vs. Nixon, 1960, ed. S. Kraus. Bloomington: Indiana University Press.
Chaffee, S.H., and S.Y. Choe. 1980. “Time of Decision and Media Use During the Ford-Carter Campaign.” Public Opinion Quarterly 44:53–69.
Cheney, R.B. 1979. “The 1976 Presidential Debates: A Republican Perspective.” In The Past and Future of Presidential Debates, ed. A. Ranney. Washington, DC: American Enterprise Institute for Public Policy Research.
Clarke, H.D., J. Jenson, L. LeDuc and J.H. Pammett. 1979. Political Choice in Canada. Toronto: McGraw-Hill Ryerson.
———. 1984. Absent Mandate: The Politics of Discontent in Canada. Toronto: Gage.
———. 1991. Absent Mandate: Interpreting Change in Canadian Elections. 2d ed. Toronto: Gage.
Davis, D.K. 1979. “Influence on Vote Decisions.” In The Great Debates: Carter vs. Ford, 1976, ed. S. Kraus. Bloomington: Indiana University Press.
Davis, M.H. 1982. “Voting Intentions and the 1980 Carter-Reagan Debate.” Journal of Applied Social Psychology 12:481–92.
Dennis, J., S.H. Chaffee and S.Y. Choe. 1979. “Impact on Partisan, Image, and Issue Voting.” In The Great Debates: Carter vs. Ford, 1976, ed. S. Kraus. Bloomington: Indiana University Press.
Fletcher, F. 1988. “The Media and the 1984 Landslide.” In Canada at the Polls, 1984, ed. H.R. Penniman. Washington, DC: American Enterprise Institute for Public Policy Research.
Frizzell, A., and A. Westell. 1985. The Canadian General Election of 1984. Ottawa: Carleton University Press.
Frizzell, A., J.H. Pammett and A. Westell. 1989. The Canadian General Election of 1988. Ottawa: Carleton University Press.
Geer, J.G. 1988. “The Effects of Presidential Debates on the Electorate’s Preferences for Candidates.” American Politics Quarterly 16:486–501.
Hagner, P.R., and L.N. Rieselbach. 1978. “The Impact of the 1976 Presidential Debates: Conversion or Reinforcement?” In The Presidential Debates: Media, Electoral, and Policy Perspectives, ed. G.F. Bishop, R.G. Meadow and M. Jackson-Beeck. New York: Praeger.
Iyengar, S., and S. Lenart. 1989. “Beyond ‘Minimal Consequences’: A Survey of Media Political Effects.” In Political Behavior Annual. Vol. 2, ed. S. Long. Boulder: Westview.
Jamieson, K.H., and D.S. Birdsell. 1988. Presidential Debates: The Challenge of Creating an Informed Electorate. New York: Oxford University Press.
Johnston, R. 1990. “Do Campaigns Matter?” Paper presented at the symposium “Analyzing Democracy,” York University.
Katz, E., and J.J. Feldman. 1962. “The Debates in the Light of Research: A Survey of Surveys.” In The Great Debates: Kennedy vs. Nixon, 1960, ed. S. Kraus. Bloomington: Indiana University Press.
Kirkpatrick, E.M. 1979. “Presidential Candidate Debates: What Can We Learn from 1960?” In The Past and Future of Presidential Debates, ed. A. Ranney. Washington, DC: American Enterprise Institute for Public Policy Research.
Knoke, D., and P.J. Burke. 1980. Log-linear Models. Newbury Park: Sage Publications.
Kraus, S., ed. 1962. The Great Debates: Kennedy vs. Nixon, 1960. Bloomington: Indiana University Press.
———, ed. 1979. The Great Debates: Carter vs. Ford, 1976. Bloomington: Indiana University Press.
———. 1988. Televised Presidential Debates and Public Policy. Hillsdale: Lawrence Erlbaum Associates.
Kraus, S., and R.G. Smith. 1962. “Issues and Images.” In The Great Debates: Kennedy vs. Nixon, 1960, ed. S. Kraus. Bloomington: Indiana University Press.
Krause, R. 1989. “The Parties and the Campaign – The Progressive Conservative Campaign: Mission Accomplished.” In A. Frizzell, J.H. Pammett and A. Westell, The Canadian General Election of 1988. Ottawa: Carleton University Press.
Lambert, R.D., J.E. Curtis, B.J. Kay and S.D. Brown. 1988. “The Sources of Political Knowledge.” Canadian Journal of Political Science 21:359–74.
Lang, K., and G.E. Lang. 1962. “Reactions of Viewers.” In The Great Debates: Kennedy vs. Nixon, 1960, ed. S. Kraus. Bloomington: Indiana University Press.
———. 1978. “The Formation of Public Opinion: Direct and Mediated Effects of the First Debate.” In The Presidential Debates: Media, Electoral, and Policy Perspectives, ed. G.F. Bishop, R.G. Meadow and M. Jackson-Beeck. New York: Praeger.
Lanoue, D.J. 1991. “Debates That Mattered: Voters’ Reactions to the 1984 Canadian Leadership Debates.” Canadian Journal of Political Science 24:51–65.
Lazarsfeld, P.F., B. Berelson and H. Gaudet. 1944. The People’s Choice. 3d ed. New York: Columbia University Press.
LeDuc, L. 1990. “Party Strategies and the Use of Televised Campaign Debates.” European Journal of Political Research 18:121–41.
LeDuc, L., and R. Price. 1985. “Great Debates: The Televised Leadership Debates of 1979.” Canadian Journal of Political Science 18:135–53.
———. 1990. “Campaign Debates and Party Leader Images: The ‘Encounter ‘88’ Case.” Paper presented at the annual meeting of the Canadian Political Science Association, Victoria.
McCombs, M.E. 1972. “Mass Communication in Political Campaigns: Information, Gratification, and Persuasion.” In Current Perspectives in Mass Communications Research, ed. F.G. Kline and P.J. Tichenor. Beverly Hills: Sage Publications.
MacDermid, R. 1987. “The Recall of Past Partisanship: Feeble Memories or Frail Concepts.” Paper presented at the annual meeting of the Canadian Political Science Association, Hamilton.
MacDonald, L.I. 1984. Mulroney: The Making of a Prime Minister. Toronto: McClelland and Stewart.
Martel, M. 1983. Political Campaign Debates: Images, Strategies and Tactics. New York: Longman.
Maser, P. 1989. “On the Hustings.” In A. Frizzell, J.H. Pammett and A. Westell, The Canadian General Election of 1988. Ottawa: Carleton University Press.
Miller, A.H., and M. MacKuen. 1979. “Learning About the Candidates: The 1976 Presidential Debates.” Public Opinion Quarterly 43:326–46.
Miller, A.H., M.P. Wattenberg and O. Malanchuk. 1986. “Schematic Assessments of Presidential Candidates.” American Political Science Review 80:521–40.
Miller, A.H., W.E. Miller, A.S. Raine and T.A. Brown. 1976. “A Majority Party in Disarray: Policy Polarization in the 1972 Election.” American Political Science Review 70:753–78.
Nie, N.H., S. Verba and J.R. Petrocik. 1979. The Changing American Voter. Cambridge: Harvard University Press.
Patterson, T.E. 1980. The Mass Media Election: How Americans Choose Their President. New York: Praeger.
Perlin, G. 1988. “Opportunity Regained: The Tory Victory in 1984.” In Canada at the Polls, 1984, ed. H.R. Penniman. Washington, DC: American Enterprise Institute for Public Policy Research.
Ranney, A., ed. 1979. The Past and Future of Presidential Debates. Washington, DC: American Enterprise Institute for Public Policy Research.
Robinson, J.P. 1972. “Mass Communication and Information Diffusion.” In Current Perspectives in Mass Communications Research, ed. F.G. Kline and P.J. Tichenor. Beverly Hills: Sage Publications.
Robinson, M.J., and M.A. Sheehan. 1983. Over the Wire and on TV. New York: Russell Sage.
Schrott, P.R. 1990. “Electoral Consequences of ‘Winning’ Televised Campaign Debates.” Public Opinion Quarterly 54:567–85.
Sears, D.O., and S.H. Chaffee. 1979. “Uses and Effects of the 1976 Debates: An Overview of Empirical Studies.” In The Great Debates: Carter vs. Ford, 1976, ed. S. Kraus. Bloomington: Indiana University Press.
Sears, V. 1985. “The Buttery-Smooth Conservatives.” In A. Frizzell and A. Westell, The Canadian General Election of 1984. Ottawa: Carleton University Press.
Shabad, G., and K. Anderson. 1979. “Candidate Evaluations by Men and Women.” Public Opinion Quarterly 43:18–35.
Sigelman, L., and C.K. Sigelman. 1984. “Judgments of the Carter-Reagan Debate: The Eyes of the Beholders.” Public Opinion Quarterly 48:624–28.
Simpson, J. 1985. “The Vincible Liberals.” In A. Frizzell and A. Westell, The Canadian General Election of 1984. Ottawa: Carleton University Press.
———. 1989. “The Fog Merchants.” Globe and Mail, 1 March, A6.
Tannenbaum, P.H., B.S. Greenberg and F.R. Silverman. 1962. “Candidate Images.” In The Great Debates: Kennedy vs. Nixon, 1960, ed. S. Kraus. Bloomington: Indiana University Press.
Wiseman, N. 1987. “The Use, Misuse, and Abuse of the National Election Studies.” Journal of Canadian Studies 21:21–37.