
JAMES CLICK
On Sunday morning, August 13, 1972, the Detroit Tigers had dropped into second place, a game behind the Baltimore Orioles in the AL East. After holding off the Orioles for months, the Tigers were in a free fall with just 3 wins in their last 13 games. Only the Orioles’ mediocre 7-7 record over the previous two weeks was keeping the Tigers from falling further behind.
Billy Martin, in his second year at the helm of the Tigers, decided desperate times called for desperate measures. Instead of the customary impassioned speech to the team or deftly organized “players-only” meeting, Martin decided to shake things up on the field. He wrote down the names of his starters on slips of paper, put them into a hat, and filled out his lineup card by pulling out the names at random. Whether because of the lineup changes or something else, the Tigers won the first game of their doubleheader with the Indians, 3-2. Then, using their traditional lineup for the nightcap, they got crushed, 9-2.
Picking a lineup is one of baseball’s most scrutinized decisions. Players often discuss feeling more comfortable in one lineup spot or another. Whether a player bats seventh or fifth can cause major controversy on sports radio and talk shows. Managers move players around the lineup in attempts to increase the team’s run scoring, both by getting better players more plate appearances and by supposedly protecting the big bats in the lineup.
Martin’s challenge to one of baseball’s most visible strategies thus raises an important question: Just how important is batting order in determining a team’s success? There have been many attempts at an answer. In his 1988 Bill James Baseball Abstract, Bill James wrote that the key to scoring in any individual inning is getting the first batter on base. After noticing that teams scored the most runs in the first inning, the fewest in the second, and about equal amounts in each subsequent inning, he posited that a player with a low on-base percentage should bat in the third spot in the lineup, since that spot is the least likely to lead off the second inning. After that, which spot bats first in any given inning is largely out of the manager’s hands.
James’s theory was logical, but he lacked a useful method to test it. With the increased popularity of personal computers, other baseball fanatics took up the task, building models that could be used to test theories about lineups. In an article originally appearing at Baseball Prospectus.com, we explored this problem in more depth using a custom program called Baseball Lineup Order Optimization Program (BLOOP). BLOOP is essentially a very fast version of the Strat-O-Matic baseball simulation game. Instead of rolling dice to determine what happens in a given at-bat, the computer generates a random number, based on ranges inputted for each player. For example, for a player with a .300 batting average, if the computer generates a random number (always from 0 to 1) that falls between 0 and .3, the player gets a hit. BLOOP allows us to attack the basic questions of lineups. How much does lineup order affect team scoring? Where is the ideal place to bat sluggers? Should a team’s best hitters be bunched together or spread out?
In BLOOP, each player is assigned a range of probabilities for different events, for instance a single, double, triple, home run, walk/hit by pitch (HBP), or strikeout. Here is a basic example: Joe Smith—single: .232 (23.2 percent); double: .035; triple: .012; home run: .002; walk/HBP: .069; strikeout: .010. The sum of the first five outcomes (.350) corresponds to Smith’s on-base percentage (OBP). In any at-bat, if the random number generated by the program is less than .350, he reaches base. If the number falls between 0 and .232 (his probability of a single), he is credited with a single. If the number falls between .233 and .267 (the sum of the probability of a single and a double), he gets a double, and so on. The program then adjusts the game situation accordingly and moves on to the next batter. By specifying the types of hits a player makes, as well as incorporating walks and HBPs, we get a more detailed list of results that better reflects the player’s true abilities.
Using BLOOP, we played tens of thousands of seasons with different lineups and reached a few basic conclusions.
First, using a lineup of players similar to a typical major league team, the difference between the most optimal (lineups ordered by descending OBP or slugging average [SLG]) and least optimal batting orders (for example, lineups where the pitcher bats leadoff and the best players bat at the bottom of the order) was 26 runs, a similar finding to several other previous studies on batting order. Although 26 runs (about 2.5 wins in the standings) may seem like a big difference, that’s the gap between the most and least optimal lineups; few managers ever reach these extremes. The standard baseball lineup actually comes fairly close to achieving optimal results based on our simulation. Changing a lineup from the industry standard to our ideal model typically nets at most 10 runs over a whole season, or about 1 win. This small range of available improvement means that minor changes to the lineup for brief periods of time have virtually no discernible effect on run scoring.
In most cases, switching two hitters in the lineup will gain or lose teams only a handful of runs over the course of an entire season, to say nothing of a week or a month. In extreme cases, it gains a bit more. For example, the 2004 Giants typically batted Barry Bonds in the fourth spot in the lineup. BLOOP found that if the Giants moved Bonds to the third spot, they gained about 7 runs, mostly because Bonds saw about 18 more plate appearances (PA) per season. Moving him from third to second netted another 18 PA and an additional 2 runs; from second to first yielded 1 more run on average. All told, that’s 10 runs the Giants sacrificed by batting Bonds fourth instead of leadoff, or about 1 win in the standings. Moving other batters into more optimal positions gets the Giants up to about a win and a half, nearly all of their final 2-game deficit to the Dodgers that year. Similarly, if the 2005 Yankees had for some reason led off with Tony Womack all year and batted Derek Jeter ninth, they would have given Womack about 144 PA that should have gone to Jeter, costing the Yanks as much as 14 runs over the course of the season.
Second, a team’s best hitters should bat sequentially. Lineups in which a team’s three best hitters batted with either one or two average batters between them fell 8 runs short of the lineup in which the top batters batted in three sequential spots.
Third and most obvious, OBP is the most important variable—more important than SLG or AVG. Given any group of nine hitters, the batting order that scores the most runs is the one ranked in order of descending OBP. Give the hitters who make the fewest outs the most chances to bat, and you’ll score more runs.
For a follow-up article, we fed BLOOP a more varied group of players in an effort to discern the optimal interplay between on-base percentage and slugging average, given that managers are almost always dealing with players superior in one metric but inferior in the other. Using Wily Mo Pena (a .259/.316/.527 hitter in 2004, indicating a low OBP and high SLG) and Luis Castillo (.291/.373/.348 in ’04, high OBP, low SLG) as samples, BLOOP found that lineups featuring Castillo in the leadoff spot scored 2 to 3 runs more than those without him there. Pena’s OBP was bad enough that batting him leadoff instead of Castillo would cost a team 3 to 4 runs, but a lineup batting Pena second or lower scores nearly as many runs as a lineup batting Castillo second. While baseball’s best hitters—those who are strong in both OBP and SLG—should be batted as high in the lineup as possible, teams that are forced to choose between OBP and SLG are generally following a highly optimal model, using on-base fiends up top and big sluggers toward the middle. OBP is generally about twice as important as SLG when considering lineup order—identical lineups sorted by descending and ascending OBP show double the difference in runs scored to the same lineup sorted by SLG. Players such as Tony Womack or Jose Reyes, who display little of either skill, should not bat near the top.
While a program such as BLOOP allows us to test theories of lineup order, it is forced to make several assumptions. It excludes stolen bases, assumes all batters are league-average baserunners (both in taking the extra base and grounding into double plays), and doesn’t adjust batter performance based on external factors such as the opposing pitcher or ballpark. Adding these features to BLOOP would allow us to test a few more theories about lineups, but we would once again be working in the absence of actual game data. Because teams vary from the traditional lineup structure so infrequently, there is very little real-life data to use in testing batting orders. Despite this lack of variety, some questions about the lineup can be answered with actual data.
BLOOP’s final assumption—that batter performance is largely independent of outside factors—begs one of the lineup’s most essential questions: Can one hitter “protect” another? The theory of protection was put to the ultimate test by the San Francisco Giants from 2001 to 2004. Provided a lineup of Bonds and seven hitters who (with rare exceptions such as 37-homer hitter Rich Aurilia in 2001) were either league average or worse, managers Dusty Baker and Felipe Alou faced the daily chore of somehow forcing the opposing pitcher to pitch to Bonds rather than walking him (see Table 1-3.1).
TABLE 1-3.1 Barry Bonds’s Performance and Following Batters, 2001–2004
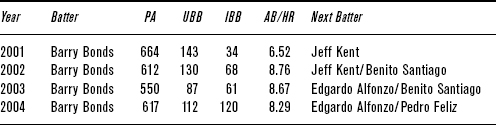
In 2001 and 2002, the primary batter behind Bonds was Jeff Kent, who hit .298/.369/.507 and .313/.368/.565 in those two seasons. In 2001, teams intentionally walked Bonds only 34 times, even though he hit home runs at a staggering rate, once every 6.5 at-bats. But in 2002, they increasingly began pitching around him. With the team 4.5 games behind the Dodgers on June 27, the Giants swapped Kent and Bonds in the order, batting Kent third and Bonds in the cleanup spot. This didn’t work. Before the switch, Bonds walked in 93 of his 293 PAs (63 unintentional walks [UBB], 30 intentional [IBB]), hitting a home run every 7.8 ABs. After the switch, he walked in 87 of 268 PAs (52 unintentional walks, 35 intentional walks), hitting a home run every 11.1 ABs. After the Giants moved Bonds to the cleanup spot, his walk rate increased slightly, his intentional walk rate increased significantly, and his home-run rate plunged, possibly because he was seeing significantly fewer hittable pitches.
With Bonds still batting cleanup in 2003, the trend continued, though teams pitched to Bonds a little more, walking him “only” 148 times. But in 2004, the situation spiraled out of control: he walked in 37.6 percent of his plate appearances. Even if Bonds never swung his bat all year, he still would have had the highest OBP on his team and the seventeenth highest in the NL. His 120 intentional passes were more than all but three other players’ total walks on the season. Teams had quit pitching to Barry Bonds.
Who could blame them? Averaging the hitters who followed Bonds in 2004 and weighting for playing time, the composite batter mustered a .288/.346/.450 line. Whom would you rather pitch to: the man hitting .362 and slugging .812 with the bases empty or a slightly above-average hitter with a man on first? Nearly 40 percent of the time, NL pitchers chose the latter. It would also be easy to blame batters in front of Bonds—the rest of the Giants’ lineup managed only a meager .264/.330/.411 line—for providing the opposition with more “walk-friendly” situations. If Bonds consistently came to the plate with more men on base and fewer outs, the opposing pitcher would likely be less inclined to give him a free pass for fear of prolonging a rally or encouraging a big inning. But breaking down Bonds’s plate appearances by baserunners and outs, Figure 1-3.1 shows that he came to the plate almost exactly as often as the average league batter in each situation.
FIGURE 1-3.1 Percentage of PA by baserunner/out situation for Barry Bonds and average MLB batters, 2004

So Bonds did not encounter a disproportionate number of “walk-friendly” situations. (The chart is ordered by league-wide walk rate in the situation from left to right.) If he were coming to the plate when teams were more likely to walk any batter, he would see a significant number of his plate appearances coming toward the left side of the graph. (Actually, to get as many walks as Bonds did purely from the baserunner/out situation, he would have had to come to bat with runners on second and third and one out for 126 percent of the time—which is, of course, impossible.) Instead, teams chose to walk Bonds, because in their estimation the likelihood of the Giants’ scoring was lower if they put him on and pitched to the next man.
Bonds’s predicament shows the theory of protection in a nutshell. The following batter doesn’t have to be as good as the man he’s protecting. But the difference between the two must be small enough that the presence of an additional baserunner increases the likely number of runs scored more than pitching to the inferior batter decreases them. In 2004, the Giants could send up no such batter to follow Bonds.
There are two main aspects of protection that must be considered: (1) if batters see better pitches to hit if they are protected, and (2) if they see any pitches to hit at all. The first is largely a performance question; the second is a decision made by pitchers and managers. Thus, the analysis of these two aspects differs. The first question can be answered by looking at the data, while the second asks us to analyze a conscious decision made by the opposition.
Whether batters see better pitches would seem to be very easy to answer on the surface: We simply break down batting performance data by the next batter. Breaking Bonds’s playing time into PAs in front of three classes of subsequent batters, we see that he batted .404/.644/.981 in front of “poor” batters, .571/.824/1.571 in front of “average” batters, and .342/.598/.778 in front of “good” batters. However, there are several problems with these numbers. First, the sample sizes of “poor” and especially “average” batters are very small—only 87 and 17 PAs, respectively. Second, batting-order changes are not random. While players may fall into one of the offensive categories overall, they may be moved around the order based on whether the opposing pitcher is right- or left-handed, or perhaps a hitting style that better fits a particular park. Bonds may appear to do worse when better batters are behind him, but that may be because the better batters are behind him when left-handed pitchers are on the mound, or when the Giants are in pitcher-friendly Dodger Stadium instead of Coors Field.
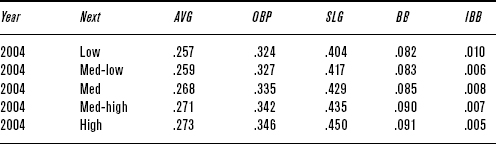
But on a larger scale, this study can reveal whether batter performance changes as the quality of the following batter changes. Using all batters in the league gives us a large enough sample that other changes in environment will not skew the results. The results are in Table 1-3.2. In this case, we find a nice, steady upward trend as the quality of the following batter increases, supporting the theory that batters hit better when the player behind them in the lineup is better. Case closed, right? But there’s one major problem: Teams tend to group their batters by their ability; the worst hitters bat lowest in the lineup, and the best bat toward the top or the middle. Players who bat in front of high-quality batters are thus more likely to be high-quality batters themselves; it isn’t the guy behind them that’s particularly notable, but rather those hitters’ overall ability that creates the illusion of lineup protection.
TABLE 1-3.2 Batting Performance by Following Batter Quality, 2004
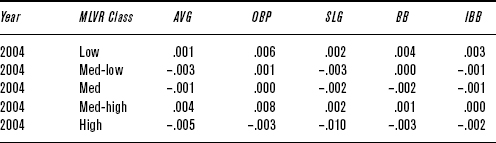
To correct for this problem, rather than looking at the raw numbers that batters put up, broken down by who’s batting behind them, we can compare those raw numbers to what we would expect the batters to do based on their season numbers. The results of this study are in Table 1-3.3. Suddenly, rather than a smooth progression as subsequent batter quality increases, the numbers come very close to zero. Batting performance does not change significantly with the quality of the following batter, and it does not change in any meaningful manner as batter quality trends upward or downward.
TABLE 1-3.3 Relative Batting Performance by Following Batter Quality, 2004
What does this mean if you’re the pitcher, or the pitcher’s manager? Do you pitch to the star hitter, or pitch around him and deal with the next guy? League run expectation charts—which show the average number of runs scored in an inning for every baserunner/out situation—show that walking a batter always increases run expectation. For instance, in 2004, walking a batter with the bases empty increased run scoring by .3880, .2630, and .1325 runs with 0, 1, and 2 outs, respectively. But protection isn’t about the league average; it’s about the elite batters and the specific quality of the following batter. To answer the question, then, we need to see how various batters affect run expectations.
This is difficult because the traditional metrics used to measure batting performance—the kind we see on the back of a baseball card—don’t say much about performance in specific baserunner/out situations. For instance, take two hypothetical players who have the exact same stats, except that one hits 20 doubles, zero triples, and 20 home runs and the other hits zero doubles or home runs but 40 triples. The two players would have exactly the same AVG/OBP/SLG but would alter the run expectations in different ways. The first batter would end up on second half the time and score half the time, while the second batter would always end up on third. As Palmer and Thorn pointed out in The Hidden Game of Baseball, a home run is not worth two doubles, and a triple is not worth three singles. So although our two batters have the same AVG/OBP/SLG, they contribute to run scoring in different ways. Instead, we must look at various batters’ more specific outcomes—singles rate (1B/PA), doubles rate, etc.—and see how they correlate to traditional metrics and changes in run expectation tables.
First, let’s look at a simple example. Rangers first baseman Mark Teixeira leads off an inning, giving the Rangers a run expectation of .5379 runs if they were a league-average offense. However, when we input Teixeira’s averages, the run expectancy increases to .5556, meaning if the Rangers followed Teixeira with an average lineup, they could expect to score .5556 runs in the inning. If, instead, the opposing team chooses to walk Teixeira and the average lineup follows, the run expectancy increases to .9259. But if the next batter makes an out after Teixeira reaches first, the run expectancy falls back to .5496, lower than the .5556 with Teixeira leading off. Thus, if the man behind Teixeira is guaranteed to make an out, the opposing team reduces the expected runs the Rangers would score by walking Teixeira—the Rangers failed to protect him. Of course, no major league player is an automatic out, but we can use this method to find situations in which protection fails. In this case, note that the difference between the two batters would have to be very close to Teixeira’s actual line on the season to force the opposition to pitch to him, because the run expectancy with him leading off the inning (.5556) is almost exactly the same as when he’s on first and the next batter makes an out (.5496). Even if the batter behind Teixeira is hitting just .100, the opposition is still better off pitching to Teixeira.
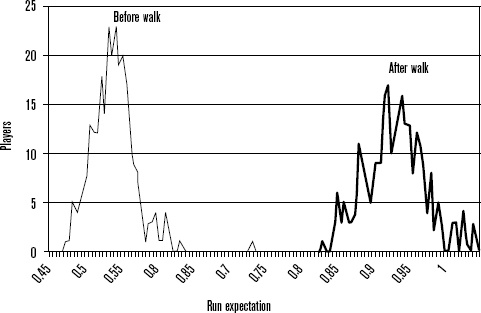
Expanding the same analysis to all players who notched at least 300 PA in 2004, Figure 1-3.2 shows how the run expectations for the two situations in question shake out.
The large bump at the left is the number of players whose run expectation falls into that range with the bases empty; the bump at the right is the same, but with a man on first. If there were any place where these two areas overlapped, it would be in lineup combinations in which the opposing team would be better served by walking the initial batter and pitching to the next man. In this case, no such situations existed among all regulars in 2004. Even Chad Moeller—who hit a brutal .208/.261/.303 as the Brewers’ catcher—could “protect” Bonds with the bases empty. It’s still unlikely that teams would pitch to Bonds in that situation, but the numbers say they should.
FIGURE 1-3.2 Run expectations for regulars before and after a walk–bases empty, none out
In other situations, things can change dramatically. Looking at the same data, but with runners on second and third and two outs, Figure 1-3.3 shows that things look very different.
The curve on the left is the run expectation before a walk with men on second and third with two out. The curve on the right is the run expectation after a walk to load the bases. The area where these two curves overlap is where existing combinations of batters fail to protect each other. In this situation, there are quite a few instances among regulars in which the opposing team would do well to walk the initial batter and pitch to the next man. (Note the small bump around .8 for the first series. This outlier is Bonds, a player so dominant that well over 75 percent of the league’s regulars can’t protect him adequately in this situation.)
These situations are few and far between. With men on second and third and two out, the second batter has to be on the order of 60 points worse in AVG, 95 points worse in OBP, and over 175 points worse in SLG to make it advantageous for the opposing team to walk the initial batter. Except for players hitting in front of the pitcher, such disparities are seldom found between two batters in consecutive spots in the batting order. It can be very difficult for a team to find someone to protect a player like Bonds. In 2004, standouts such as Miguel Tejada, Chipper Jones, and Ichiro Suzuki would have fallen short of the performance needed to justify pitching to Bonds in this situation.
FIGURE 1-3.3 Run expectations for regulars before and after a walk–second and third, two outs

Out of all twenty-four baserunner-out situations, only half have protection failure thresholds that occurred between any two regular batters in 2004. For these twelve, for an intentional walk to have a positive run expectancy for the pitcher, the differences between the performance of the two batters can be found in Table 1-3.4. For example, with a runner on third and two outs, the pitching team would decrease its opponents’ run expectation by walking any batter who was more than .028/.051/.085 better than the following batter. This is by far the most common situation in which an intentional walk is a viable strategy. Other situations, such as first and third with one out, have such an enormous run expectaton gap that they occur only when one of the league’s worst batters is hitting behind Barry Bonds. From the PA% column—the percentage of plate appearances in which each situation arises—it becomes obvious that protection is likely to break down very rarely indeed.
TABLE 1-3.4 Required Differences Between Consecutive Batters for an IBB to Benefit the Pitching Team, as Measured by Run Expectancy

Protection is overrated. There’s no evidence that having a superior batter behind another batter provides the initial batter with better pitches to hit; if it does, those batters see no improvement in performance as a result. Additionally, it’s very rare that a situation arises in which run expectation drops after the pitching team walks the batter at the plate. Therefore, if the pitching team does walk a batter because it would rather pitch to the following man, it is almost always making a mistake by opening the door for a big inning. The situation changes late in close games as the importance of a single run begins to trump that of many runs, but even in those situations, the difference between the two batters would have to be extreme.
In short, most of the hand-wringing and scrutiny of batting orders is for naught. Batting order simply does not make that much difference. Managers tinkering with lineups so rarely shun convention that most of their changes would affect their teams’ output by only a few runs over the course of a season. Sorting a lineup in descending order of OBP yields the most runs, but players with high SLG can offset a low OBP as early as third in the lineup. The conventional lineup’s most egregious flaw is that it costs the game’s best players about 18 PA per lineup spot per season. If Barry Bonds led off instead of hitting fourth, he would see about 54 more PA per year, adding perhaps 10 runs to the Giants’ offensive output. Teams without a player of Bonds’s caliber could gain about 10 runs (1 win) a year by routinely batting their players in order of descending OBP. Furthermore, managers worrying about protecting their best hitters need not fret. Situations in which the pitcher would gain by walking the initial batter to pitch to the following man are so rare that employing an optimal lineup order would eliminate nearly all of them. Intentionally walking any batter in a correctly ordered lineup is nearly always a bad decision.
So was Billy Martin crazy? Not, at least, with regard to his batting order. He understood that who is in the lineup is much more important than where they bat. Were it not that the conventional wisdom has become self-fulfilling prophecy—batting order is important because everybody thinks it’s important—Martin could have pulled his lineups out of a hat all year long and hardly lost a game in the standings.