Did Derek Jeter Deserve the Gold Glove?
JAMES CLICK
There is nothing on earth anybody can do with fielding.
—Branch Rickey
Depending on whom you talk to, Derek Jeter is either among the best defensive players in the game today or one of the worst. Fans, scouts, and commentators lavish praise on the Yankees shortstop for his exciting plays in the field: throws to first while leaping backward into left field, running headlong into the stands to catch a foul pop-up, or his famous flip to Jorge Posada to nab Jeremy Giambi at home plate. Jeter is one of the game’s great entertainers, constantly displaying the utmost limits of his effort and talent. But performance analysts, citing various metrics showing that Jeter has often cost the Yankees some 20 runs a year compared with the average shortstop, are less enthralled.
As in many other great baseball debates, the numbers challenge our visual impressions. Which should we believe? Toronto’s general manager, J. P. Ricciardi—former assistant GM to Oakland’s Billy Beane—summed things up in a Q&A with Baseball Prospectus’s Jonah Keri in 2004: “By watching [Jeter] play, I know I want the ball hit to him. Maybe that’s the scout part of me. Defense is probably the one area where I disregard the numbers. A lot of people that aren’t around the game, that’s where the arguments come from. They don’t see players play every day. If you don’t see that every day, you’re not going to get the full picture. Certain guys make plays every day.”
Both sides of the argument are problematic. Commonly used defensive statistics—the building blocks of any metric or measure of performance—are terribly and perhaps irrevocably flawed. The mainstream measure of defensive performance—the error—is a judgment call by the game’s official scorer, who is guided only by his gut and a vague reference in the rules to “ordinary effort.” Most of the time, he is correct. But consider a player who reached third but was given a double instead of a triple because the ball took a bad hop on the fielder. Or a pop-up that lands safely among three players, any one of whom could have called the others off and taken it. In these and countless other situations, the official statistics are not an objective reflection of what’s happening on the field. These discrepancies are the primary reason that standard defensive statistics cannot be used to determine quality of defensive performance—the same play on the same field can be seen differently by different scorers depending on their interpretation of the word “ordinary.” A home run is a home run, but an error is not always an error.
But throwing out the numbers completely is just as bad. Human memory is one of the worst data-collection devices in the world. In How We Know What Isn’t So, Thomas Gilovich noted the many problems with human perception and analysis of everyday events. We find nonexistent patterns in random data, extrapolate from too little information, weight events that confirm our preconceptions vastly more than those that disagree with them, and eagerly accept secondhand information as fact. This is not to say that our eyes lie to us all the time, but there are inherent biases when people trust only their eyes.
Watching baseball is no different. You could spend a year watching two shortstops, both of whom fielded the exact same number of balls, threw the same number of guys out, and made the same number of errors. If one did it with flair—diving for balls, charging hard, and barehanding a dribbler—and the other did not, you would almost certainly rate the flashy player as the superior fielder. We all tend to remember special events, such as difficult plays and plays that we didn’t expect to be made. But while spectacular effort is a joy to watch, it should not be confused with results.
The first step to evaluating defense is to acquire meaningful information. Just as we cannot use a statistic like errors because it isn’t consistently applied to identical situations, we cannot rely on our visual interpretations because they too are inconsistent, weighing identically efficient plays differently based on the apparent difficulty of the fielder’s maneuvers.
To a large extent, this means we must throw errors out of the equation when measuring defense. Bill James recognized this when he introduced range factor and defensive efficiency; the former is a measure of how many balls a player fielded per game (using assists and put-outs), and the latter is a measure of the percentage of balls in play a team defense turned into outs. The crucial component to these two metrics is not the performance of the defense once a defender has the ball but rather the act of getting to the ball in the first place. A player cannot make an error on a ball he doesn’t reach. In effect, errors are the same as hits as far as the defense is concerned; they are simply balls on which the defense failed to make the play.
Though stats like range factor were advancements over fielding percentage, they still rested on the assumption that, over a season, most players at similar positions had the same number of fielding opportunities. Anyone who’s watched Carl Yastrzemski, Manny Ramirez, or any other left fielders in Fenway knows that that’s not the case. To correct for these inequalities—no one really expected Yaz to scale the Green Monster to field balls that would be easy outs in any other park—several new fielding metrics have been created to better estimate the number of chances presented to each fielder.
At Baseball Prospectus, Clay Davenport’s Fielding Runs (FR) uses five adjustments to each fielder’s situation to better estimate his total chances: park factor, total balls in play allowed, groundball/flyball tendencies, pitcher handedness, and men on base. By adjusting each fielder’s total chances, FR avoids punishing players like Yastrzemski or Ramirez for failing to scale the wall or shortstops for working with high-strikeout pitching staffs who don’t give them as many chances. Individual defensive performance can then be converted into estimated runs saved or lost by each fielder. FR provides a handy way to compare historical player performance, particularly for players who played before play-by-play data were available.
For the first eight seasons of his career, Jeter did not do well when measured by FR. Table 3-2.1 shows his defensive stats. A “Rate” of 100 represents an average shortstop. Jeter’s Rate of 88 in his rookie season means he cost the Yankees 12 percent more runs per 100 games than an average shortstop would. FRAA is Fielding Runs Above Average, and FRAR is Fielding Runs Above Replacement. These stats measure the total runs a player was worth over the season compared to either an average fielder (FRAA) or a theoretical replacement-level fielder—a waiver acquisition or a Triple-A player (FRAR). In 1996, Jeter was 18 runs worse than the average shortstop but 14 runs better than a replacement-level shortstop. His major league rank in Rate among all shortstops who played at least 81 games at the position is listed in the final column.
TABLE 3-2.1 Derek Jeter Defensive Stats, 1996–2004

By these measures, Jeter performed well below the average major league shortstop from 1996 through 2004, costing the Yankees a total of 140 runs, or about 1.5 games per season. He did arrest that trend in 2005, adding 6 runs to the Yankees’ ledger with his glove.
But 2005 aside, the reason Jeter has hurt his team defensively is that he doesn’t get to many balls and is not spectacularly efficient with those he does get to. There was even a popular joke that new fans initially thought Jeter’s first name was “Pastadiving” since the phrase “Past a diving Jeter” was uttered so often during broadcasts. He’s consistently near the bottom of the league in chances, put-outs, and assists. Many of his flashy plays would be routine for a better defensive shortstop like Miguel Tejada or Rafael Furcal.
When Jeter won the Gold Glove in 2004, he posted the best defensive numbers of his career to that point, jumping from a Rate of 80 to 98 and from 23 runs below average to 3. He still didn’t deserve the Gold Glove—the Orioles’ Tejada posted the league’s best fielding numbers—but he showed an impressive jump from his established career levels. Searching for the reasons for this remarkable turnaround, Clay Davenport could find no single change that clearly explained it. Instead, Jeter’s numbers—put-outs, assists, double plays, all relative to chances and league average—were up across the board, vaulting him from objectively terrible to merely below average.
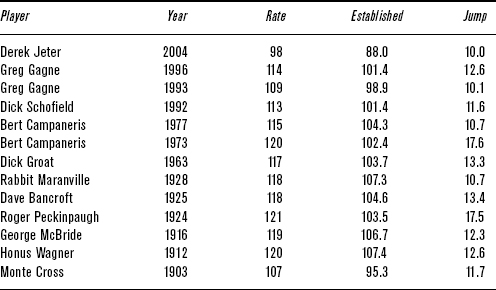
How unprecedented was this sudden jump in defensive performance? At first it does not look like such a great leap. Since 1901, there have been 180 instances, about two per year, of a regular shortstop improving his Rate by 18 or more runs from one season to the next. But Jeter’s improvement was not a correction for a bad year; by 2004, he had had eight years to establish himself as one of the game’s worst defensive shortstops. The list of shortstops with at least eight years in the majors who improved on their established career Rate by more than 10 runs amounts to just eleven men, shown in Table 3-2.2.
TABLE 3-2.2 Sudden Defensive Improvements at Shortstop

The difference between Jeter and the others is that nearly all of the other ten were above-average fielders. Greg Gagne in 1993 and Monte Cross in 1903 were the only ones with below-average numbers before their jump. No shortstop as bad as Jeter had a career year with the glove like he did in 2004. Only Johnnie LeMaster in 1984 and Pat Meares in 2000 were even close. Jeter improved his defense even more in 2005, recording the first above-average season in his ten-year career.
So how did a thirty-year-old shortstop with a long track record of terrible defense suddenly post consecutive seasons of roughly league-average defense? One answer is that Jeter isn’t the best shortstop on his own team. When the Yankees acquired Alex Rodriguez before the 2004 season, they launched a debate about who should play shortstop. Should it be the incumbent, the Yankee captain and beloved superstar? Or should it be the two-time Gold Glove winner and reigning AL MVP? Rodriguez held all the hardware, but he settled the debate almost before it began. The Yankees were Jeter’s team, he said, and he volunteered to move to third base. But was this the best decision for the Yankees?
In the spring of 2004, Joe Sheehan of Baseball Prospectus advocated moving Jeter to center field, where his athleticism would mitigate his flaws—“slow reaction time and poor footwork.” Incumbent center fielder Bernie Williams had been deteriorating defensively for a few seasons—things got so bad the next spring that the Yankees briefly moved second baseman Tony Womack to left and Hideki Matsui to center—and with Rodriguez on the scene, the move appeared to make sense. This idea, as well as others floated during the brief public debate, revolved around Bill James’s idea of a defensive spectrum. In its original version, moving from left to right in order of increasing difficulty, the spectrum looked like this:
1B—LF—RF—3B—CF—2B—SS—C
James determined the spectrum both from observation and from the tendencies of players to change positions later in their careers as their defense eroded. The Astros’ Craig Biggio is a good example: He originally came up as a catcher, then moved to second and then outfield after the Astros signed Jeff Kent. Likewise, the Cardinals’ Albert Pujols moved from left to first when he was hampered by injuries. The Orioles’ Cal Ripken Jr. shifted from short to third late in his career (after going the opposite way in his rookie season). Pete Rose regressed from second to third to first. Many prospects start out at shortstop but move to other positions as they advance up the organizational ladder.
Though it’s a handy guide to the relative difficulty of defensive positions, the spectrum does not estimate how a player would perform defensively if moved to another spot on the diamond. Players who saw significant time at more than one position in a single season can give an idea of how well any player would do at a different defensive position. This method will likely downplay the difference between positions because teams will use only versatile defensive players at more than one position. The method doesn’t consider any hypothetical performances—we don’t know how Willie Mays would have worked out at shortstop or Johnny Bench in center—but players who did play multiple positions in one season give us an idea of what we could expect of others making similar transitions.
The Orioles have bounced Melvin Mora all over the diamond. In 2002, he played at least ten games in left field, in center field, and at shortstop, where he posted Rates of 110, 108, and 99, respectively. These numbers fit with the defensive spectrum: Mora was better in left than in center and better in center than at short. In 2003, he played left, right, and short, with Rates of 111, 92, and 90. These numbers again slide down James’s defensive spectrum as expected. The difference between left field and right field is larger than anticipated, but there are bound to be a few fluky seasons here and there, especially when dealing with small sample sizes.
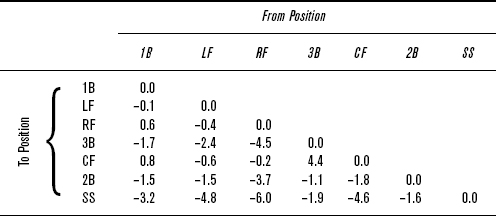
The results of comparing the various performances can be found in Table 3-2.3. (Catchers have been excluded, as catching is distinctly different from the other positions.)
TABLE 3-2.3 Comparative Defensive Performances

The vertical columns are the position from which the player moved, and the horizontal rows are the new position. The numbers show change, in runs per year, in going from the old position to the new. For example, a player moving from left field, the second column, to third, the fourth row, would be estimated to be 2.4 runs worse at third than he was in left. (The reverse transition—moving from third to left—is not shown because it is simply the negative of the displayed value: in this case, the player would be approximately 2.4 runs better in left.) While many positions fit our preconceptions—players moving from shortstop perform better at any other position—there are some inconsistencies with James’s original theory and within the chart itself. For example, players moving from left field perform slightly worse if they move to right field (–0.4) but slightly better if they move to first (0.1, the inverse of moving from first to left). But players moving from first to right perform better in right (0.6), seemingly indicating that if a player were to move from left to first to right, he would do better than if he simply moved from left to right. This is nonsense, but it shows that players who have played both first base and a corner outfield position have not performed consistently better at either position.
There is one correction to James’s original scale: Third and center should be switched. Players who played both third and center were 4.4 runs better in center than at third, one of the largest differences on the chart. Other than that, the spectrum falls into place as James originally drew it up.
Using Table 3-2.3, teams could begin to break free of the constraints of positional thinking. If a team needs a new right fielder, its managers don’t have to search their farm system or the free-agent market for players with experience playing right field. Instead, teams can speculate how many runs various players already on their team would gain or cost them if moved to right field. Suddenly, the number of available options increases dramatically. If a team needs an outfielder, but there are only infielders available on the free-agent market, it could sign one of the quality infielders and train an incumbent to play outfield. Using the defensive spectrum, the team would be able to better project the costs and benefits of that move as compared to signing a poorer-quality player with outfield experience.
Getting back to the Yankees in spring 2004, it’s possible to estimate their ideal defensive alignment. From 2001 to 2003, Jeter averaged a Rate of 85, Rodriguez 102, and Williams 95. With Rodriguez at third, we estimate he would gain 1.9 FR, raising his Rate to about 104; the three positions would average a Rate of 94.7. Moving Jeter to center would raise his Rate to about 90 (85 + 4.6), with Rodriguez playing shortstop at 102 and Williams at DH. Then, if the Yankees could find a third baseman with a Rate of 92 or better, they would come out ahead. From 2001 to 2003, twenty-six players totaled 92 or better at third in at least a full season of playing time. Based on information available at the time, moving Jeter to center and bringing in a defender like Ty Wigginton (99.5 Rate), Vinny Castilla (97.5), or Shea Hillenbrand (97.5) would have saved 5 to 7 more runs than moving Rodriguez to third—roughly 1 in the standings, if things broke right.
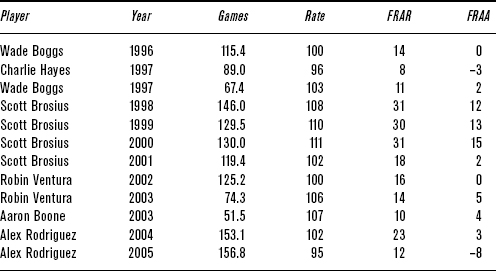
While the Yanks would likely have benefited slightly from moving Jeter to center, his sudden defensive improvement made the argument null. Could they have known he would improve? Did they think the presence of a great fielder like Rodriguez to Jeter’s right would allow the shortstop to field a few more grounders up the middle? Considering Jeter’s continued improvement in the 2005 season, it seems like a plausible theory. But as Table 3-2.4 shows, Rodriguez does not appear to be significantly better at third than Jeter’s previous partners there.
Rodriguez’s Rates of 102 and 95 in 2004 and 2005, respectively, were significantly worse than the combination of Robin Ventura and Aaron Boone in 2003 and than Scott Brosius’s four years of quality defense from 1998 to 2001. Expanding to other teams, there is no correlation between changes in the performance of third basemen and shortstops. A new third baseman on a team doesn’t have a predictable effect on the performance of the incumbent shortstop. There is no evidence that Rodriguez’s presence caused Jeter’s defensive improvement.
TABLE 3-2.4 Primary Yankees Third Basemen, 1996–2004

These issues raise one final aspect of measuring defense in baseball: the interaction between teammates. Fielding, unlike hitting, is inherently a team activity. The nine players ideally act as one unit. While defense primarily involves the range of the individual fielders, it also involves their choices once they’ve reached the ball. The combination of skill and choice could cause FR to give too much credit to a player like Jeter and too little to Rodriguez if the two fielders have chosen to let Jeter field many balls that either man could field equally well. If this is the case, FR—or any defensive metric—may be misinterpreting this choice as a change in the skill of one or both. From the perspective of the players, the end result—an out—is the same, but from the perspective of individual defensive statistics, the end result is different.
All available individual defensive statistics have problems. Understanding what those problems are allows us to use the available information as best we can without overstating our conclusions. In the case of Derek Jeter’s radical improvement as measured by FR, it’s possible that FR is overlooking a choice in the Yankees infield, but it’s also possible that Jeter simply had a great year or two with the glove. Or perhaps A-Rod has helped him work on his technique. Regardless of the reason, Jeter’s transformation is no illusion; he vaulted from the depths of the shortstop position to become a league-average defender in 2004 and 2005. Did he deserve the Gold Glove? Not according to the numbers. But he deserves credit for a drastic improvement in his defensive performance.