Preface to the Paperback Edition
Why Is The American League Better Than The National League?
One of baseball’s greatest qualities is its ability to constantly surprise. Every season brings new fodder for discussion, new events that change the way we see the game. That element of surprise and wonder is one of the biggest reasons why we wrote Baseball Between the Numbers. The events of 2006 drove us to update the book for 2007, starting with this chapter.
The ink was barely dry on the hardcover before new questions started zooming in. Coors Field was a topic of great debate in the book’s last edition, given its Nintendo-like offensive levels. But in 2006, offense at Coors Field dropped dramatically. Rockies pitchers started putting up ERAs that didn’t look like model numbers from Boeing. Opposing pitchers no longer suffered night sweats thinking about their next start in Denver. Many attributed the change to the Rockies placing baseballs in humidors before games, deadening fly balls that once soared out of the park. Others gave the Rockies credit for producing a new generation of pitchers, both through the farm system and careful mining of the free-agent market, the trade wire and other sources. Analysts typically look at three-year spans to assess the impact of a ballpark; 2006 could just be a brief anomaly, and Matt Holliday might hit 58 homers in 2007. But one season’s results do make us take notice. The baseball world will keep a closer eye on the park in 2007, 2008, and beyond, watching to see which Coors is the real McCoy.
In mere months, “Is Joe Torre a Hall of Fame Manager?” morphed into “Will Joe Torre Have a Job Next Season?” The Yankees got a breakthrough season from young starter Chien-Ming Wang and a bounceback year for Mike Mussina. But the decline of Randy Johnson and other pitching woes had Bombers fans wringing their hands all season. When the Yankees fell in four games in the League Division Series, many speculated that Torre would take the fall for a sixth straight season without a World Series championship, an eternity in the Bronx. Torre’s job in the Yankee dugout has since become more secure. Meanwhile, the characteristics that make one manager a genius and another a bum remained open to debate.
For a brief period after the 2006 season, Alex Rodriguez’s job security looked far more tenuous than Torre’s. Last year we asked, “Is A-Rod Overpaid?” Using a multitiered system, we found that yes, he was indeed overpaid. The argument has escalated since then. Rodriguez’s 2006 season was a strong one by many standards. But a $25 million-a-year contract raises certain expectations. A-Rod saw his numbers drop off significantly from his 2005 MVP levels. Many noted a slip in his defense too. After the 2006 season, people were no longer asking if he was overpaid, but by how much.
As we reflected back on the chapter “Is David Ortiz A Clutch Hitter?” the larger question of whether clutch hitting exists again surfaced. One of A-Rod’s biggest shortcomings, his critics claimed, was his constant failures in “clutch situations.” These accusations were mostly unfounded. A 1-for–14 performance in the 2006 playoffs is far too small a sample from which to draw any meaningful conclusion. When we look at his body of work over the course of his career, Rodriguez’s numbers late in games, with runners in scoring position and in other pivotal instances, don’t look much different from his efforts the rest of the time. But perceptions are powerful things, and exceedingly difficult to change. David Ortiz clubbed a few more walk-off hits in 2006. A-Rod failed a few more times. The image of one as folk hero and the other as an overpaid choker grew in the public’s mind, fairly or not.
Near the end of the book, we asked “Why Doesn’t Billy Beane’s Shit Work In The Playoffs?” After multiple attempts, Beane’s Oakland A’s finally got off the schneid, winning a first-round series. But an unceremonious LCS sweep brought the question back to the fore. We never found out if John Schuerholz’s stuff would work in the postseason, as the Braves missed the playoffs for the first time since the 1994 labor stoppage. We did learn that a strong starting rotation and an airtight defense can trump a lineup full of on-base demons come October, as the 2006 Tigers—for a while, anyway—looked like the 2005 White Sox, Version 2.0. Finally, we gained another point in favor of momentum being overrated. A big losing streak and near-collapse right before the postseason may not be as damaging as you’d expect. The 2005 White Sox nearly blew the AL Central to the hard-charging Indians before going on to win it all; the 83-win 2006 Cardinals came even closer to blowing their division, then beat all comers en route to the World Series trophy.
One of the biggest stories of the 2006 season, though, was one we didn’t address in the first edition of Baseball Between the Numbers: The disparity that’s emerged between the American League and the National League. Yes, an NL team, the St. Louis Cardinals, won the 2006 World Series. But other indicators point to the AL being the stronger league. The AL beat the NL in interleague play 154–98 in 2006. That’s a staggering .611 winning percentage, the equivalent of a 99-win team. The question naturally arises: Are the American League players, on average, that much better than those in the National League?
The results of interleague play, by themselves, don’t answer this question. From a mathematical point of view, whether a game is won or lost is equivalent to whether a coin lands heads or tails, or whether a free throw is hit or missed. In each case, we’re dealing with a situation that has only two possible outcomes. These situations are relatively easy to model, using what’s called a binomial probability distribution. If the real odds for all the interleague games were 50–50, there would be a .016 percent chance—1 in 6,250—that one side or the other would win 154 (or more) times in 252 tries. Most scientific applications, in order to explain an event as being caused by something other than chance, want to get that number under 5 percent, or one in 20. By that test, the AL certainly looks better than the NL.
Or maybe not. We have a series of procedures at Baseball Prospectus that we use to evaluate how good one league is relative to another. They all work by comparing how player performance changes relative to their league. Suppose you have a group of players who are, collectively, 10 percent better than average in their league. After moving to another league, let’s say that same group is now only average. We would then suspect that the second league was about 10 percent harder than the first. Stats go down, league got harder; stats go up, league got easier.
Individual players must be weighted equally in each league. Otherwise, what looks like an upsurge in offense might just be a case where someone like Barry Bonds got twice as many plate appearances. The simplest way to do this is to use the Common Plate Appearance, or CPA. The CPA stat is simply the lesser of the two plate appearance totals. In other words, if Jeff Conine had 432 plate appearances for the AL Orioles and 107 for the NL Phillies in 2006, the CPA would be 107, the lesser of the two. In the league where the player batted less, the stats stand as they are; but in the other league, they all get multiplied as CPA × PA.
Ideally, you can use a direct approach, testing the players who played in each of the two leagues you are trying to measure. The 2006 season was a particularly good one for this, since there was a relatively large number of players (such as Bobby Abreu, Ron Belliard, Sean Casey, and Aubrey Huff) who switched leagues in midseason. All told, there were 3,360 common plate appearances in 2006, the second-highest total ever; the average for the 10 previous years was 2,053. Going by that approach, the AL comes out as 5.8 percent harder than the NL.
Fortunately for us, we can also use an indirect approach to the problem. We can use a third league as a standard reference point. Let’s say that A and B are the leagues we are testing, and C is our reference league. You look at every single player who was in both leagues A and C and check out how their stats changed; then you look at all the players who played in leagues B and C and see how their stats changed. The ratio of the changes is a measure of the difficulty ratio of leagues A and B.
Let’s get concrete. For our statistic, we’re going to use equivalent runs (EqR) per out. The principal benefit of this measure is that EqR has been corrected for both the average offensive level of the league in question and for park effects (See the Glossary at the end of the book for a definition of EqR). In this case, we want to compare the 2006 AL to the 2006 NL; we’re using the 2005 NL as our third league.
All of the players in both the 2005 NL and 2006 NL combined for 61,322 CPA. These players produced .1868 EqR/out in the 2005 NL, and .1779 in the 2006 NL. The ratio here is 1.050.
All of the players from the 2005 NL and 2006 AL combined for 11,223 CPA. They produced .1787 EqR/out in the 2005 NL and .1588 EqR/out in the 2006 AL, for a ratio of 1.125.
The ratio of the ratios is (1.050/1.125), or 0.933. It suggests that the 2006 AL was about 7 percent harder to hit in than the 2006 NL.
Of course, that’s just one point. We actually want as many points as we can get, so we do this for every league-season within 25 years. If you’re a student of baseball analysis, this may look a lot like the study that analyst Dick Cramer did more than 25 years ago—a study that was originally published in SABR’s 1980 Baseball Research Journal, reprinted in its entirety in Pete Palmer’s The Hidden Game of Baseball and criticized strongly in Bill James’ Historical Baseball Abstract. And you would be right, except for one significant difference.
Cramer weighted the comparisons solely by the number of CPA between players. We’re doing the same thing here, except that we divide that weight by the number of years of difference between the leagues. That way, leagues with more CPA closer in time—say 2003 compared to 2001, over 1999 compared to 1987—count the most. It also means that we’re more confident than Cramer that the player’s skill level hasn’t changed dramatically over time, although it’s still an issue.
Overall, the findings say that the 2006 AL was about 8.6 percent tougher to hit in than the 2006 NL. So conventional wisdom, in this case, had it right. The cases of 21 of the 29 leagues tested, and all of them for the last six years, indicate that the 2006 AL was the harder league.
If the average AL team had an 8.6 percent advantage in runs scored, we would expect the team to win 54 percent of the time, not 50 percent of the time. Go back to the probabilities discussed earlier: Replace a 50 percent coin-flip chance of winning each game with 54 percent, and there is a 1 percent chance that a team would post a record of 154–98 or better. That is a 63-fold increase over our initial guess, but it’s still outside the range of probability. We’re still missing something.
Of course, we’ve only been looking at half of the problem—we can dig deeper by doing the same analysis with pitchers as we did with hitters. While we would expect pitchers to behave in more or less the same way as hitters, they wouldn’t necessarily be exactly the same. As it turns out, they don’t look exactly the same at all; the difficulty trend for pitchers is somewhat steeper than it is for hitting, although the shape is pretty much the same. This may explain why the rules have had to be adjusted periodically to maintain the balance between hitting and pitching, and that those changes—such as lowering the pitcher’s mound after pitchers dominated in the late 1960s—have usually been aimed at pumping up the offense. Using the same analysis we used for hitters, we find that the AL pitchers of 2006 were expected to be 4.5 percent better than those in the NL.
A team that scores 8.6 percent more runs and allows 4.5percent less has an expected winning percentage of .564. Plug a .564 winning percentage into a probabilities table and the chance of a 154–98 record goes up to 5.7 percent. That’s above the 5 percent threshold generally needed to reject random chance. In other words, the AL was somewhat lucky to have so good a record in 2006. But AL teams could have reasonably expected to beat NL teams, and by a wide margin.
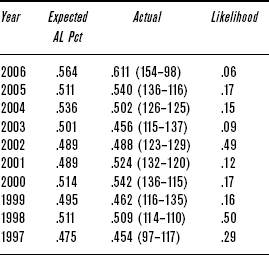
Looking back over the history of interleague play, we can see that this was the least likely result yet given the AL’s expected winning percentage. The “favored” league based on difficulty analysis has won the interleague series eight out of 10 times so far (all records from AL point of view):
TABLE X.1 Interleague Play Results, 1997–2006
We can go beyond this. The All-Star Game has been played since 1933 and is a reasonable test of the overall talent of the league—or would be, if they played more than one game. We should also add a caveat about how the All-Star Game isn’t a full sample of the league, but just the cream of the crop, and thus not necessarily representative of the league strength as a whole. It’s easier for an imbalance to occur with 50 players than with several hundred.
With that said, the difficulty test has picked the winner of the All-Star Game 46 out of 75 times. In particular, the difficulty test saw the NL break away from the AL around 1952, with the NL holding a sometimes wide margin as the stronger league every year from 1952 to 1991, with the sole exception of 1972. During those 40 years, the NL won 31 of 43 All-Star Games (ties excluded). The difficulty rating also saw the AL take over as the more difficult league in 1992, with the AL holding that title for most of the 15 years since—the AL has gone 11–3–1 in the All-Star game since then.
Extending this analysis to the World Series is a riskier proposition; just because the league as a whole is weaker does not mean that its best team is, any more than that its best players are. In fact, the simple test of which league is more difficult hasn’t done any better at picking World Series winners than flipping a coin, with 51 right and 51 wrong after the Cardinals’ win in 2006.
With that established, let’s dig deeper. When did the gap between the AL and NL start to emerge? Was there a similar gap before that favoring the NL? Why and how do these gaps emerge in the first place?
The NL of the late 1950s held a bigger edge over the AL than the current AL-over-NL gap, with integration playing a major role. The NL of 1901 also showed a bigger gap, in that case a result of the AL just getting started as a rival major league. The AL quickly reversed that gap in 1902. Once the league demonstrated it wasn’t going to fold right away, players were more than willing to leave the despised NL owners behind; MLB labor relations in the 1890s were as hideous as anything in our lifetimes. The AL’s sizable gap persisted until 1912. The AL opened another gap in the early 1920s, as stars such as Babe Ruth drove the league to improve, while the NL basically stagnated at 1912 levels. The next big shift occurred after 1925, thanks to the advent of farm systems. Branch Rickey and other NL team operators used player development to their advantage far more than their AL brethren in those early years, allowing the NL to roar back with very rapid growth after 1925.
In the chapter “Batting Practice: Is Barry Bonds Better Than Babe Ruth?” there’s a table that shows the ratio of difficulty ratings going back to the 1950s. There’s a jump in the gap between NL and AL batters that happens around 1951 and persists until 1990. The usual explanation is that National League teams were more aggressive in implementing racial integration.
We can test this theory through a career MVP score, a measure that tabulates a player’s career value to make it easier to compare his contributions to that of another player. Using the 20-year span from 1947, when Jackie Robinson broke the color barrier, to 1967, when the amateur draft started, we can gain some insight into how this progressed. The top-ranked players who would have been prohibited from playing before 1947 were, in order of career value: Willie Mays, Hank Aaron, Ernie Banks, Frank Robinson, Jackie Robinson, Roberto Clemente, Roy Campanella, Minnie Minoso, Juan Marichal, Camilo Pascual, Orlando Cepeda, Larry Doby, Billy Williams, Maury Wills, Vada Pinson, Don Newcombe, Bob Gibson, Jim Gilliam, Luis Aparicio, and Bobby Avila.
Five of the 20—Minoso, Pascual, Doby, Aparicio, and Avila—were AL guys, and they rank 8–10–12–19–20 on this list. Yes, the NL did a lot better in integrating top-flight players onto its rosters (and would continue to pick up difference makers in the early 1960s, with Joe Morgan, Dick Allen, and Fergie Jenkins among the best of those). Until the onset of the draft, black players wanted to “play in Jackie’s league” and showed a pretty clear preference to sign with NL teams when they had free opportunity to do so.
In 1991, the tide turned in the AL’s favor, a talent gap that still exists today. We ran a program that divided players into groups based on where they went. For instance, the 1991 statistics of players in the American League who also played in the AL in 1992 combined for a .264 Equivalent Average and 9,208 EqR. The 1991 AL stats of players who then played in the NL in 1992 totaled a .244 EqA and 771 EqR (see the Glossary at the back of the book for a definition of EqA). That ratio, 771 EqR moving to the other league over the 9,208 who stayed, is 8.4 percent, one of the smaller totals of the last 20 years. If we do the exact same thing for players in the 1991 NL and break them up based on where they went the next year, then 7,909 EqR stayed put, and 999 moved to the AL—12.6 percent. That difference, a little over four percentage points in the AL’s favor, is the largest change in either direction in the last 20 years, and part of a sustained AL advantage from the mid-1980s to mid-1990s, as shown in Table X.2. A positive number suggests a net talent flow to the AL. Note the increase in player movement after 1995 and the see-sawing back and forth since 1997.
TABLE X.2 Forward One Year, Ratio of Switching EqR to staying EqR, 1985–2005
We went through a 10-year stretch where the AL took more talent from the NL than it gave back.
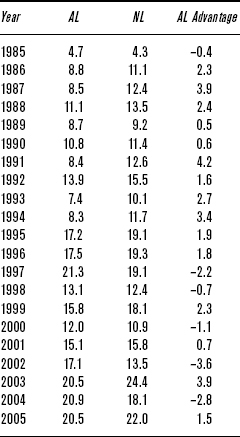
We don’t have an analogue as clean as EqR with which to test pitchers. Instead, we used Runs Above Replacement level (RAR), based on a replacement value of a 6.00 ERA. That is, ERAs below 6.00 would yield positive RAR figures, while ERAs above 6.00 would yield negative results, as shown in Table X.3. Again, positive in the third column means a net flow of talent from the NL to the AL:
TABLE X.3 One Year Forward, Ratio of RAR, Switching Pitchers to Staying Pitchers, 1985–2005

Again, there were some wild oscillations in recent years, like a big gain for the NL in 2000–2001. Of pitchers with 20+ RAR in 2000, the NL lost Rick Reed, Steve Parris, Pat Hentgen, Chris Holt, and Rob Bell, five pitchers. But it gained Mac Suzuki, Albie Lopez, James Baldwin, Kevin Appier, Steve Trachsel, Jeff Fassero, Tomo Ohka, Steve Karsay, Justin Speier, Mike Fyhrie, Rick White, Jose Santiago, Mike Trombley, and Kent Bottenfield, 14 pitchers. The 2003 season saw a reverse swing. The AL lost six 20+ RAR pitchers in Roger Clemens, David Wells, John Thomson, Andy Pettitte, Victor Zambrano, and Andy Hawkins. But it gained 15 such pitchers: Kevin Brown, Javier Vazquez, Curt Schilling, Miguel Batista, Mark Redman, Octavio Dotel, Paul Quantrill, Joe Nathan, Ron Villone, Terry Adams, Gil Heredia, Ugueth Urbina, Justin Speier, Sidney Ponson, and Jeff D’Amico. The top four pitchers gained were better in 2003 than any of the ones lost.
Why did this happen? Several pitchers migrated to the two teams with the most aggressive recent approach to player acquisition and the biggest recent payrolls, the Yankees and the Red Sox (the Mets later moved into this echelon too). The spillover effect of the Yanks’ and Red Sox’s aggressiveness was a keeping-up-with-the-Joneses effect, with other AL teams becoming more aggressive in chasing free-agent talent. In the AL East in particular, the perceived need for pitching has grown to massive proportions; think of the $105 million the Blue Jays shelled out after the 2005 season to ink A. J. Burnett and B. J. Ryan in an effort to chase down the front-running Yankees and Red Sox.
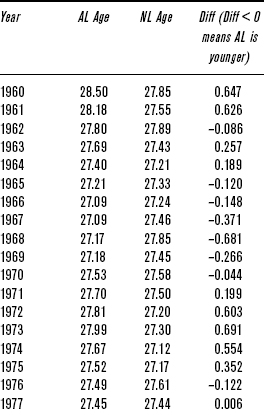
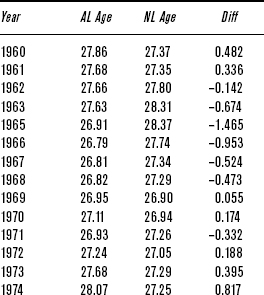
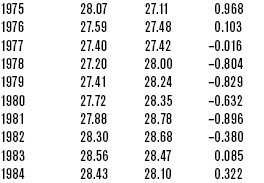
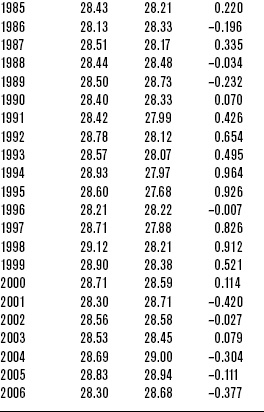
Of course, free agency and trades aren’t the only ways a team can stock its roster. A team’s age can also make a big impact. A club full of up-and-coming 25-year-olds will often click better than a roster bogged down with late–30s talent on their last legs. Indeed, an interesting pattern has emerged: The AL has become younger than the NL. Weighting players by plate appearances or innings pitched, the AL used to be older, but no longer. This trend is more pronounced for batters than pitchers; but for both sets of players, starting around 1982 (five years after the 1977 expansion), the NL was predominantly younger than the AL. That trend has reversed itself, with the AL the younger league in seven of the last eight years, as shown in Tables X.4 and X.5.
TABLE X.4 Batter Age, 1960–2006 (weighted by PA)


Another way to attack this discussion is to look at contributions from players who were rookies in the past three years in each league. This helps gauge the influx of top young talent in the AL vs. the NL. Since the leagues have varied in size—the AL now has two fewer teams than the NL, but it wasn’t always that way—we looked at average contribution per recent rookie. The result: There was no clear pattern on the position player side.
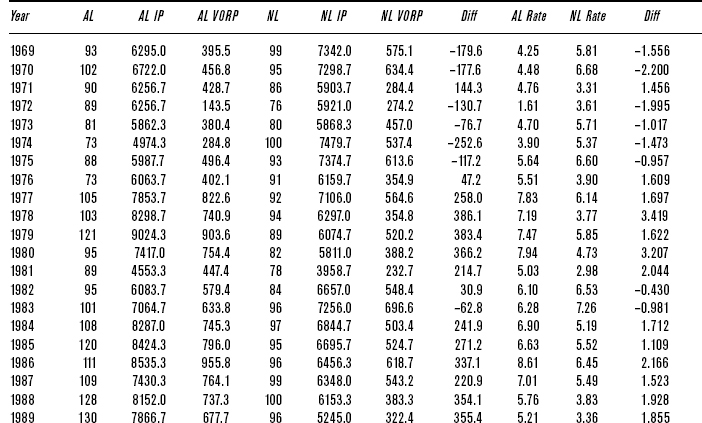
But on the pitching side, the AL has been getting slightly more production out of “recent rookie” pitchers than the NL has for a couple of decades. Starting with the advent of divisional play in 1969, the NL had more productive near-rookie hurlers for six out of seven years. Over the next 31 years (starting in 1976), only five times have the NL’s young hurlers been better, on average, than their AL counterparts. That could mean that the AL has been getting slightly better pitching for a long time, allowing the overall quality of the league to rise, eventually catching and passing the NL.
One possible explanation for this advantage among AL younger pitchers might be the impact of the designated hitter rule. The advent of the DH rule coincides almost exactly with the AL’s newfound edge in quality young pitching. It’s possible that the DH rule has allowed AL pitchers to focus and specialize on pitching more than NL pitchers have. That could in turn make those AL pitchers a bit better at pitching than NL ones, since they don’t have other demands on their skills, such as hitting and bunting. Table X.6 shows the gap.
TABLE X.5 Pitcher Age, 1960–2006 (weighted by IP)
One caveat to this rookie and near-rookie analysis: Rookie performance is often something of a counterfactual indicator. Good rookie performances, especially spread over the depth of a class, tend to indicate that the quality of the league they were joining was unusually low, not that the rookies themselves were better than average. Thus, it could be that AL rookies during the time frame examined were better, but that’s not absolutely certain.
So what lessons can we take away from the AL’s rise to supremacy? Does anything need to be done to level the playing field between the two leagues? Can anything be done? Or is 2006 just an extreme example of a natural cycle that happens whenever any set of sports teams is split into leagues or conferences?
The reason for the current imbalance is fundamentally different from old reasons, which generally relied on a big event (such as the AL’s beginnings as a major league or integration) creating an imbalance and then holding that imbalance for a decade or more. Volatility, in the form of turnover in players, has increased dramatically since 1990. Getting rid of interleague play could drive the NL to be a little more aggressive in the free-agent market, since it currently causes more NL teams to have sub-par records. If NL teams become less willing to lose their own players and more willing to acquire talent from other teams, that should drive the gap between the two leagues back toward equilibrium.
Since interleague play is not going away any time soon, perhaps NL fans’ best hope for parity is some equivalent to the Yankees that will make all the other teams compete harder to keep up. The NL has never had such a team; its closest recent equivalent to a dynasty, the Atlanta Braves, won fourteen straight division titles but only one world championship in that span. The Mets have recently been spending money—and developing top young talent through their farm system—as if they aim to dominate the league for some time. If they succeed at this, then the Braves, Cardinals, Dodgers, and anyone else with World Series hopes will have to become that much better to have a chance of making it. That way, too, we could see a return to parity.
TABLE X.6 AL Near-Rookie Pitchers vs. NL Near-Rookie Pitchers, 1969–2006 (AL/NL Columns Are # of Near-Rookie Pitchers in Each League)