With the alerts firing from Prometheus into Alertmanager, the only thing left to do is to send requests to Jenkins to scale the service. We already created a similar Alertmanager config in one of the previous chapters, so we'll comment only on a few minor differences. The configuration is injected into the alert-manager service as a Docker secret.
Since secrets are immutable, we cannot update the one that is currently used. Instead, we'll have to remove the stack and the secret and create them again.
docker stack rm monitor

docker secret rm alert_manager_config
Now we can create a new secret with the updated Alertmanager configuration.
echo "route:
  group_by: [service,scale]
  repeat_interval: 5m
  group_interval: 5m
  receiver: 'slack'
  routes:
  - match:
      service: 'go-demo_main'
      scale: 'up'
    receiver: 'jenkins-go-demo_main-up'

receivers:
  - name: 'slack'
    slack_configs:
      - send_resolved: true
        title: '[{{ .Status | toUpper }}] {{\
.GroupLabels.service }} service is in danger!'
        title_link: 'http://$(docker-machine ip\
swarm-1)/monitor/alerts'
        text: '{{ .CommonAnnotations.summary}}'
        api_url: 'https://hooks.slack.com/services\
/T308SC7HD/B59ER97SS/S0KvvyStVnIt3ZWpIaLnqLC u'
  - name: 'jenkins-go-demo_main-up'
    webhook_configs:
      - send_resolved: false
        url: 'http://$(docker-machine ip swarm-1)/jenkins/job\
/service- scale/buildWithParameters?token=DevOps22&service=\
go-demo_main&scale=1'
" | docker secret create alert_manager_config -
Remember that the gist with all the commands from this chapter is available from 12-alert-instrumentation.sh (https://gist.github.com/vfarcic/8bafbe912f277491eb2ce6f9d29039f9). Use it to copy and paste the command if you got tired of typing.
The difference, when compared with the similar configuration we used before, is the scale label and a subtle change in the Jenkins receiver name. This time we are not grouping routes based only on service but with the combination of the labels service and scale. Even though we are, at the moment, focused only on scaling up, soon we'll try to add another alert that will de-scale the number of replicas. While we would accomplish the current objective without the scale label, it might be a good idea to be prepared for what's coming next.
This time, the match section uses a combination of both service and scale labels. If they are set to go-demo_main and up, the alert will be forwarded to the jenkins-go-demo_main-up receiver. Any other combination will be sent to Slack. The jenkins-go-demo_main-up receiver is triggering a build of the Jenkins job service-scale with a few parameters. It contains the authentication token, the name of the service that should be scaled, and the increment in the number of replicas.
The repeat_interval is set to five minutes. Alertmanager will send a new notification every five minutes (plus the group_interval) unless the problem is fixed and Prometheus stops firing alerts. That is almost certainly not the value you should use in production. One hour (1h) is a much more reasonable period. However, I'd like to avoid making you wait for too long so, in this case, it's set to five minutes (5m).
Let us deploy the stack with the new secret.
DOMAIN=$(docker-machine ip swarm-1) \
    docker stack deploy \
    -c stacks/docker-flow-monitor-slack.yml \
    monitor
There's only one thing missing before we see the alert in its full glory. We need to run the Jenkins job manually. The first build will fail due to a bug we already experienced in one of the previous chapters.
Please open the service-scale activity screen.
open "http://$(docker-machine ip swarm-\
 1)/jenkins/blue/organizations/jenkins/service-scale/activity"
You'll have to login with admin as both username and password. Afterward, click the Run button and observe the failure. The issue is that Jenkins was not aware that the job uses a few parameters. After the first run, it'll get that information, and the job should not fail again. If it does, it'll be for a different reason.
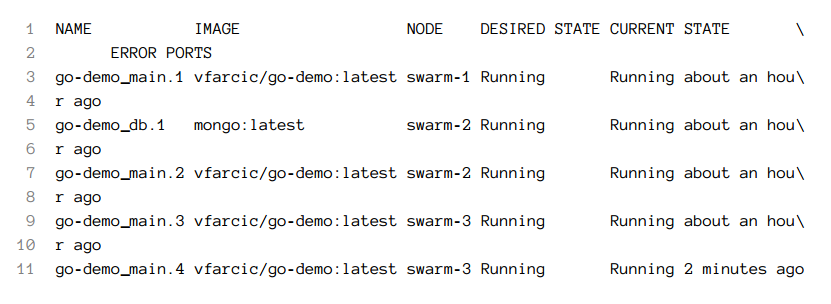
The go-demo_main service should have three replicas. Let's double-check that.
docker stack ps \
    -f desired-state=Running go-demo
The output should be similar to the one that follows (ID are removed for brevity).

Before we proceed, please make sure that all replicas of the monitor stack are up and running. You can use docker stack ps monitor command to check the status.
Now we can send requests that will produce delayed responses and open the Prometheus alerts screen.
for i in {1..30}; do
    DELAY=$[ $RANDOM % 6000 ]
    curl "http://$(docker-machine ip swarm-1)/demo/hello?delay=$DELAY"
done

open "http://$(docker-machine ip swarm-1)/monitor/alerts"
The godemo_main_resp_time alert should be red. If it is not, please wait a few moments and refresh the screen.
Prometheus fired the alert to Alertmanager which, in turn, notified Jenkins. As a result, we should see a new build of the service-scale job.
open "http://$(docker-machine ip \
swarm-1)/jenkins/blue/organizations/jenkins/service-\
 scale/activity"
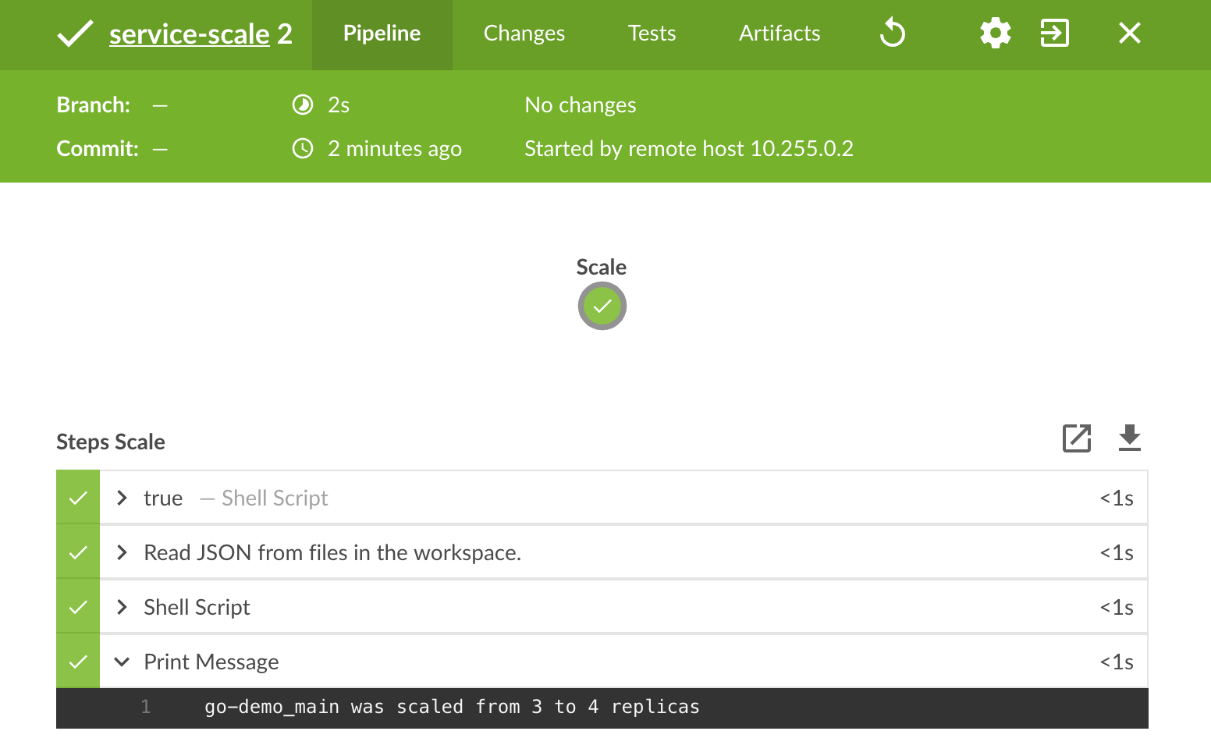
Please click on the latest build. It should be green with the output of the last task set to go-demo_main was scaled from 3 to 4 replicas:

We should confirm that Jenkins indeed did the work it was supposed to do. The number of replicas of the go-demo_main service should be four.
docker stack ps \
    -f desired-state=Running go-demo
The output of the stack ps command is as follows (IDs are removed for brevity).

Since we stopped simulating slow responses, the alert in Prometheus should turn into green. Otherwise, if Prometheus would continue firing the alert, Alertmanager would send another notification to Jenkins ten minutes later. Since the service has the com.df.scaleMax label set to four, Jenkins job would not scale the service. Instead, it would send a notification to Slack so that we (humans) can deal with the problem.
Let's remove the stack and the secret and work on Alertmanager configuration that will also de-scale services.
docker stack rm monitor

docker secret rm alert_manager_config
The command that creates a new secret is as follows.
echo "route:
  group_by: [service,scale]
  repeat_interval: 5m
  group_interval: 5m
  receiver: 'slack'
  routes:
  - match:
      service: 'go-demo_main'
      scale: 'up'
    receiver: 'jenkins-go-demo_main-up'
  - match:
      service: 'go-demo_main'
      scale: 'down'
    receiver: 'jenkins-go-demo_main-down'

receivers:
  - name: 'slack'
    slack_configs:
      - send_resolved: true
        title: '[{{ .Status | toUpper }}] {{\
.GroupLabels.service }} service is in danger!'
        title_link: 'http://$(docker-machine ip\
 swarm-1)/monitor/alerts'
        text: '{{ .CommonAnnotations.summary}}'
        api_url: 'https://hooks.slack.com/services\
/T308SC7HD/B59ER97SS/S0KvvyStVnIt3ZWpIaLnqLCu'
  - name: 'jenkins-go-demo_main-up'
    webhook_configs:
      - send_resolved: false
        url: 'http://$(docker-machine ip swarm-\
 1)/jenkins/job/service-scale\
/buildWithParameters?token=DevOps22&service=go-demo_main&scale=1'
  - name: 'jenkins-go-demo_main-down'
    webhook_configs:
      - send_resolved: false
        url: 'http://$(docker-machine ip swarm-1)\
/jenkins/job/service-scale\
/buildWithParameters?token=DevOps22&service=go-demo_main&scale=-1'
" | docker secret create alert_manager_config -
We added an additional route and a receiver. Both are very similar to their counterparts in charge of scaling up. The only substantial difference is that the route match now looks for scale label with the value down and that a Jenkins build is invoked with scale parameter set to -1. As I mentioned earlier in one of the previous chapters, it is unfortunate that we need to produce so much duplication. But, since Webhook url cannot be parametrized, we need to hard-code each combination. I would encourage you, dear reader, to contribute to Alertmanager project by adding Jenkins receiver. Until then, repetition of similar configuration entries is unavoidable.
Let us deploy the monitor stack with the new configuration injected as a Docker secret:
DOMAIN=$(docker-machine ip swarm-1) \
    docker stack deploy \
    -c stacks/docker-flow-monitor-slack.yml \
    monitor
Please wait until the monitor stack is up-and-running. You can check the status of its services with docker stack ps monitor command.
While we're into creating services, we'll deploy a new definition of the go-demo stack as well.
docker stack deploy \
    -c stacks/go-demo-instrument-alert-2.yml \
    go-demo
The new definition of the stack, limited to relevant parts, is as follows.
...
  main:
    ...
    deploy:
      ...
      labels:
        ...
        - com.df.alertName.3=resp_time_below
        - com.df.alertIf.3=sum(rate(http_server_resp_\
time_bucket{job="my-service", le="0.025"}[5m]))\
/ sum(rate(http_server_resp_time_count{job="my-service"}[5m])) > 0.75
        - com.df.alertLabels.3=scale=down,service=go-demo_main
        ...
We added a new set of labels that define the alert that will send a notification that the service should be scaled down. The expression of the alert uses a similar logic as the one we're using to scale up. It calculates the percentage of responses that were created in twenty-five milliseconds or less. If the result is over 75 percent, the system has more replicas than it needs so it should be scaled down.
Since go-demo produces internal pings that are very fast, there's no need to create fake responses. The alert will fire soon.
If you doubt the new alert, we can visit the Prometheus alerts screen.
open "http://$(docker-machine ip swarm-1)/monitor/alerts"
The godemo_main_resp_time_below alert should be red.
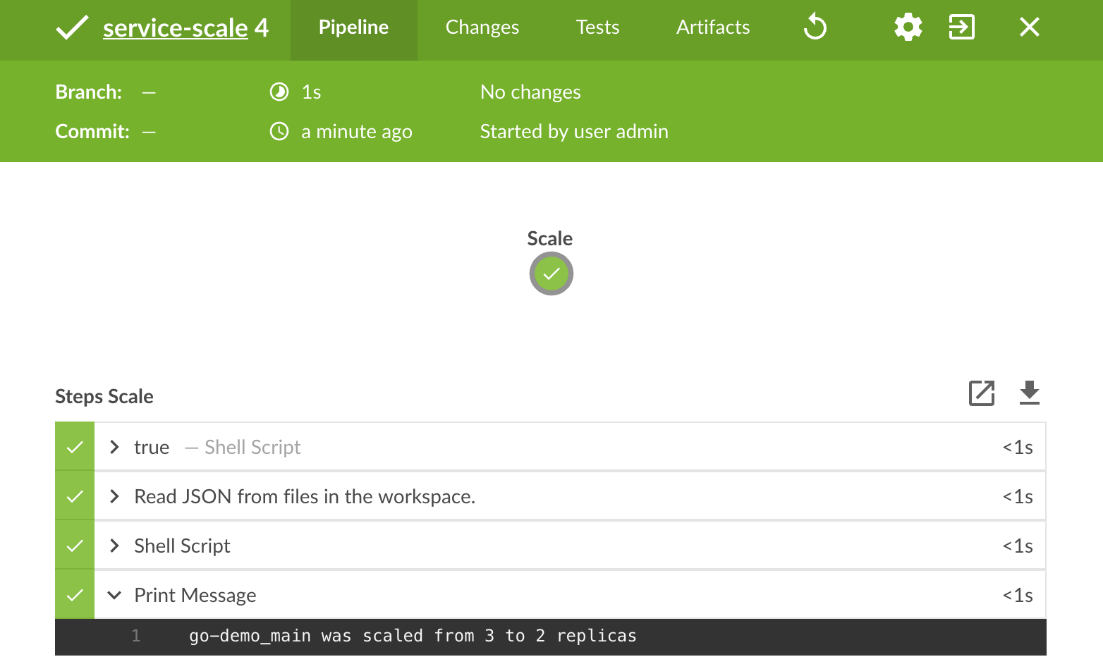
Similarly, we can visit Jenkins service-scale job and confirm that a new build was executed.
open "http://$(docker-machine ip swarm-\
 1)/jenkins/blue/organizations/jenkins/service-scale/activity"
The output of the last step says that go-demo_main was scaled from 3 to 2 replicas. That might sound confusing since the previous build scaled it to four replicas. However, we re-deployed the go-demo stack which, among other things, specifies that the number of replicas should be three.
That leads us to an important note.

Prometheus will continue firing alerts because the service is still responding faster than the defined lower limit. Since Alertmanager has both the repeat_interval and the group_interval set to five minutes, it will ignore the alerts until ten minutes expire. For more information about repeat_interval and group_interval options, please visit route (https://prometheus.io/docs/alerting/configuration/#route) section of Alertmanager configuration.
Once more than ten minutes pass, it will send a build request to Jenkins. This time, since the service is already using the minimum number of replicas, Jenkins will decide not to continue de-scaling and will send a notification message to Slack.
Please visit the #df-monitor-tests channel inside devops20.slack.com (https://devops20.slack.com/). Wait for a few minutes, and you should see a Slack notification stating that go-demo_main could not be scaled.
Specifying long alertIf labels can be daunting and error prone. Fortunately, Docker Flow Monitor provides shortcuts for the expressions we used.
Let's deploy the go-demo stack one last time.
docker stack deploy \
    -c stacks/go-demo-instrument-alert-short.yml \
    go-demo
The definition of the stack, limited to relevant parts, is as follows:
...
  main:
    ...
    deploy:
      ...
      labels:
        ...
        - com.df.alertIf.1=@service_mem_limit:0.8
        ...
        - com.df.alertIf.2=@resp_time_above:0.1,5m,0.99
        ...
        - com.df.alertIf.3=@resp_time_below:0.025,5m,0.75
      ...
This time we used shortcuts for all three alerts. @resp_time_above:0.1,5m,0.99 was expanded into the expression that follows:
sum(rate(http_server_resp_time_bucket{job="my-service",
 le="0.1"}[5m])) / sum(rate(http_server_resp_time_count{job="my-\
 service"}[5m])) < 0.99'''
Similarly, @resp_time_below:0.025,5m,0.75 became the following expression.
sum(rate(http_server_resp_time_bucket{job="my-service", \
 le="0.025"}[5m])) / sum(rate(http_server_resp_time_count{\
job="my-service"}[5m])) > 0.75 '''
Feel free to confirm that the alerts were correctly configured in Prometheus. They should be the same as they were before since the shortcuts expand to the same full expressions we deployed previously.
We managed to create a system that scales services depending on thresholds based on response times. It is entirely automated except if the service is already running the minimum or the maximum number of replicas. In those cases scaling probably does not help and humans need to find out what is the unexpected circumstance that generated the alerts.
We started with expected and created a fallback when unexpected happens. Next, we'll explore the situation when we start from unexpected.