CHAPTER 5
Shifts in Marine Biogeographic Ranges

Christopher J. Osovitz and Gretchen E. Hofmann
Abstract. Global climate change brings new threats to wildlife as the environmental conditions of ecosystems rapidly change. Among the most significant of these challenges for California’s marine ecosystems is ocean warming, a result of global warming. Ocean warming could impact nearly every marine species, as temperature affects virtually every biological process from cellular reactions to individual behavior, and is believed to be an important factor in setting species distribution limits. In this study, gene expression profiles of purple sea urchins, Strongylocentrotus purpuratus, are used as an indicator of the physiological effects of environmental variation along a latitudinal gradient from their southern range boundary in Baja California northward to Oregon, the United States. The purple sea urchin is an ecologically important California species that helps to regulate kelp forest densities, and its sister species, the red sea urchin, S. franciscanus, is the subject of one of California’s largest fisheries. Gene expression profiles of S. purpuratus in Oregon most resembled those from Baja California, suggesting that local thermal variation may have a greater physiological impact on this species than differences in temperature seen across large-scale differences in latitude. These data suggest that the small-scale complexity of the marine environment along the California coastline may result in spatial complexity of optimal sea urchin habitat. If true, ocean warming may be more likely to fragment the range of S. purpuratus, rather than shifting it to the predominantly cooler waters of the north Pacific. Therefore, the best management strategy to protect S. purpuratus during a period of ocean warming might be to identify locations where local variation may be optimal for S. purpuratus, instead of managing based on the expectation that each population will migrate poleward.
Key Points
• Assuming only poleward movement of purple sea urchins in response to ocean warming is too simplistic. The upwelling patterns along the Pacific Coast create complex temperature patterns that can dictate locations of refugia.
• As part of a long-term conservation strategy, urchin-specific Marine Protected Areas (MPAs) may be appropriate in areas that are currently cooler, such as Northern California and Oregon, where urchins are currently abundant and living substantially below their upper temperature limits. These MPAs should include specific monitoring of sea urchins, as MPAs can also increase urchin predator density.
• In southern California and Baja California, managing Strongylocentrotus purpuratus in the cooler refugia created by coastal upwelling will likely be the most efficacious manner of protecting the purple urchin and the closely related red urchin that is the focus of a large California fishery. However persistence of the geographic patterns of upwelling should be monitored.
• Protecting these two species of urchins will likely have the added effect of maintaining kelp forest communities in general.
INTRODUCTION
California’s marine ecosystems are already being effected by current ocean warming, and future warming may challenge the survivorship of many members of the California marine ecological community, including fish, sea urchins, mussels, macroalgae, and sea stars, among others (e.g., Harley et al. 2006, Brierley and Kingsford 2009, Hoegh-Guldberg and Bruno 2010). As a result, scientists face a pressing need to understand and predict the nature of current and future biological impacts of climate change in order to best manage and preserve the state’s natural marine ecosystems and fisheries. The biological impact of ocean warming on marine species may mirror that of global warming on terrestrial species, that is many species ranges may simply shift either pole-ward or deeper into the ocean (e.g., Fields et al. 1993, Parmesan and Yohe 2003, Root et al. 2003) or perhaps marine climate change could have a more complex effect on ocean species (e.g., Schiel et al. 2004, Harley et al. 2006). However, very few investigations have undertaken a physiological approach to elucidate the mechanisms of biological change at the cellular level. The central aim of this study is to assay broad-scale patterns of gene expression, which we use as an indicator of variation across the physiological processes within different urchin populations, to examine how ocean warming may impact economically and ecologically important California sea urchin species.
The current prevailing assumption is that ocean warming will force marine species ranges to shift toward the poles or into deeper waters that are historically colder regions (e.g., Fields et al. 1993, Harley et al. 2006). This prediction relies on an often untested assumption that key environmental factors that are important to the well being of a species, such as temperature, vary smoothly and predictably over a geographic scale. A common approach to evaluating risks related to climate change involves linking patterns of key factors to species ranges, based on the idea that species live in areas where such factors are within species’ tolerance limits. Plotting the location of these estimated tolerance limits defines what is called the “climate envelope” of a species (Hijmans and Graham 2006), and we can then examine how projected changes in climate may lead to shifts in the location of tolerance limits. The variability of environmental factors across space, however, may appear smooth at a large scale, but when examined on a smaller scale the smoothness often disappears.
When examined at a continent-wide scale, many marine and terrestrial species have been found to have already shifted their ranges pole-ward (e.g., Sorte et al. 2010, Burrows et al. 2011). An examination of organisms of coastal California’s marine ecosystems on a finer scale reveals complex spatial patterns of environmental variation, rather than smooth gradients (e.g., Broitman and Kinlan 2006). Oceanographic properties, such as regional eddies and coastal upwelling, disrupt not only the latitudenal gradient in temperature, but also other factors, such as temporal variability, productivity, and water turbidity. The complexity of these environmental patterns complicates predictions regarding the biological effects of future climate change.
Also undermining our ability to predict the responses of many marine species to climate change is a fundamental lack of understanding of the direct effects of ocean temperature on the physiology of marine species (Helmuth et al. 2005, Osovitz and Hofmann 2007). Stated more simply, we do not yet understand what natural environmental conditions are optimal for many species, largely because it is difficult to measure “contentment” in species. Without knowledge of the physiological mechanisms of environmental tolerance, our ability to predict the biological outcomes of future climate change will be limited to observed ecological patterns of change in response to past climate events (Helmuth et al. 2005). A significant gap in our knowledge regarding the biological impacts of climate change is the extent to which organisms can physiologically tolerate or adjust to environmental change. This knowledge will provide insight into how much environmental change particular species are likely to be able to tolerate, and how successfully the species may respond to novel climate conditions.
Very few studies have measured large-scale patterns of gene expression to study the effects of environmental variation in natural habitats (e.g., Place et al. 2008). The activity, or “expression,” of many genes results in the production of a protein that carries out a cellular function. When cells are confronted by stressful or changing conditions, they often respond by expressing different genes that could alleviate the stress of the new environment (Schulte 2001). For example, the freshwater common carp possesses three different genes that each expresses a different version of a single muscle-contraction protein (Turay et al. 1991). Although these three proteins carry out the same function, muscle contraction, they differ in their ability to function at different temperatures (Turay et al. 1991). The cells of the carp express different ratios of these three proteins depending on the temperature of the water in which the carp is swimming (Turay et al. 1991). As a result, the temperature recently experienced by a carp can be inferred simply from the pattern of expression of its muscle-contraction genes. However, we know little about which specific genes marine organisms might activate in order to live within complex fluctuating environmental settings, like those of coastal ecosystems, so investigating this question would benefit from a broader-scale analysis of gene expression.
A molecular tool, called the cDNA (complementary DNA) microarray, represents a powerful technique to assay the expression of thousands of genes simultaneously (Brown and Botstein 1999, Gracey and Cossins 2003). This allows us to investigate which genes vary by location and assumedly play a role in environmental tolerance. Here, custom cDNA microarrays constructed for Strongylocentrotus purpuratus (Stimpson), the purple sea urchin, were employed to investigate the association of gene expression and environmental variation among natural populations of S. purpuratus at a biogeographic scale among natural populations along the west coast of North America.
The purple sea urchin is an ideal organism to investigate the potential cellular impacts of environmental variation across a species’ biogeographic range. One factor that makes it attractive for this type of study is the shape of its range. Its biogeographic range is extensive and essentially one-dimensional (e.g., Sagarin and Gaines 2002a), extending from southeast Alaska to Punta Eugenia in the middle of the Baja California peninsula (Figure 5.1) without extending too far from the shore, reaching a maximum depth of approximately 100 m. Thus, the purple sea urchin’s range encompasses thousands of kilometers from the northern range boundary to the southern range boundary, but the east-west range is very narrow. The thermal variation across the full latitudinal extent of the range is substantial, with sustained temperatures spanning from 20°C (68°F) in the south in the summer to 4°C (40°F) in Alaska in winter. However, the range also includes strong variation at much smaller scales: Two locations used in this study, Point Conception and Refugio, California, though separated by less than 100 km, display a mean annual thermal disparity of 3°C (5.4°F) because these two sites bracket a location of ocean currents convergence.
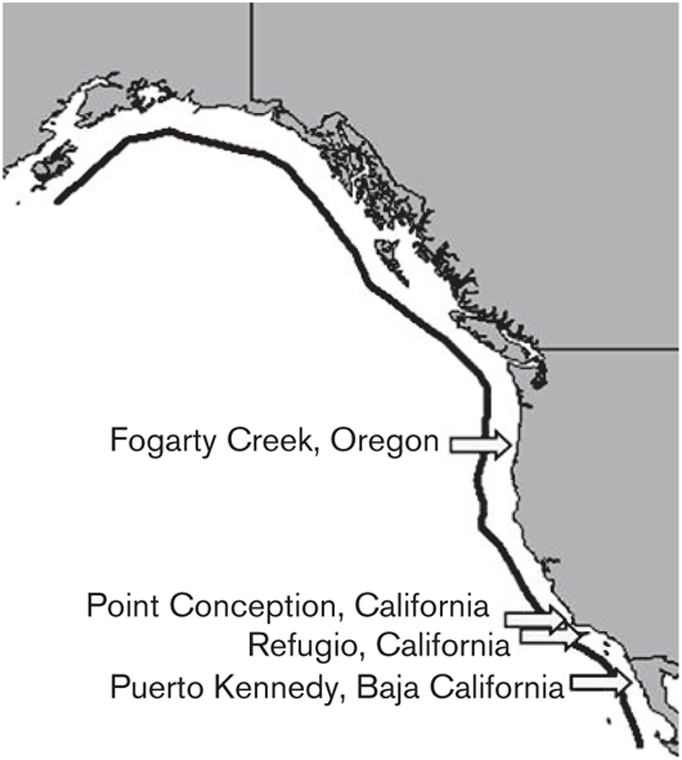
FIGURE 5.1: A map of the geographic range (dark line) and collection sites (arrows) of the purple sea urchin, S. purpuratus.
S. purpuratus is an important contributor to the ecology of coastal ecosystems (Pearse 2006), in that algal grazing by this species plays a role in the regulation of the size and abundance of kelp forests (Watanabe and Harrold 1991, Dayton et al. 1992), which host many California marine species including fish and marine mammals. Its sister species S. franciscanus, the red sea urchin, is the focus of a large California fishery (Botsford et al. 2004). This urchin is harvested in mass from California waters for sushi. Therefore, the impact of climate change on S. purpuratus and S. franciscanus could have considerable effects on kelp forest communities as well as the California sea urchin trade. These two sea urchin species are very similar genetically, and thus, S. purpuratus offers an excellent model through which to investigate the potential impacts of climate change on California’s sea urchin and kelp communities.
The central approach of this study was to measure gene expression patterns in natural populations of purple sea urchins along their biogeographic range as a proxy measure for their physiological tolerances in these environments. As typically framed on a large spatial scale, “rules of thumb” for how species respond to warming (i.e., based on climate envelope models built for other species, especially in terrestrial systems) would predict that the urchins located closest to each other geographically would display the most similar patterns of gene expression, because gene expression is influenced by environment. Alternatively, a geographic pattern of gene expression where pairs of more distant urchin populations display gene expression patterns just as similar or even more similar than pairs that are near each other could indicate that the typical framing on how species might shift geographically is a poor model for species in complex coastal habitats.
METHODS
1. Custom Microarray Construction
To construct a custom cDNA microarray, we first isolated RNA from several genes that may be of interest from S. purpuratus tubefoot tissue (see Osovitz and Hofmann 2005 for details on RNA isolation methods). For this microarray, RNA was isolated from over 200 S. purpuratus individuals that were exposed to a broad range of environmental conditions. The intent of this exposure was to collect isolated fragments of all of the genes that may be involved in environmental tolerance across the natural range of S. purpuratus. This collection of RNA fragments was then reverse transcribed into DNA (called cDNA). Each cDNA fragment was then stored separately in bacterial cells on plastic plates at –80°C (this process is called gene cloning). This type of collection of cDNA fragments is called a cDNA library, and it allows the isolated gene fragments to be stored indefinitely.
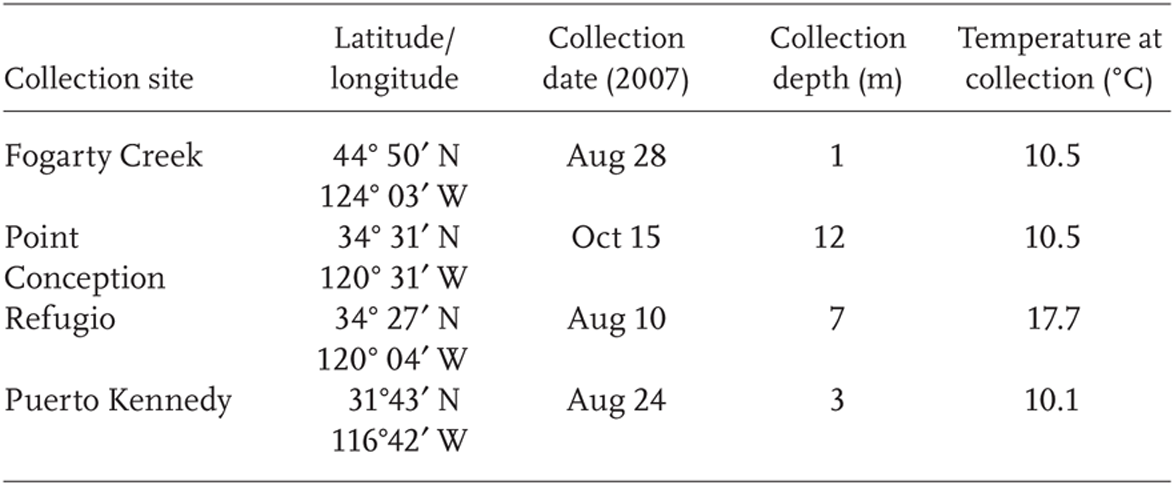
TABLE 5.1
Details of the four field collection sites
A total of 3072 gene clones from this library were sequenced in order to examine how many of the genes were unique, and how many were redundant. Of this total, 564 were found to be non-redundant and were selected for microarray printing (defined below). A total of 227 of these gene clones remain unidentified, meaning that we do not yet know the function of these genes. In addition to the 564 clones, an additional 232 unique cDNA clones, selected from results of preliminary temperature experiments (unpublished data), were added from a separate S. purpuratus cDNA library generated from urchin larvae.
A total of 796 (564 + 232) unique S. purpuratus genes were then printed in the following manner onto several cDNA microarrays, which were used for all analyses in this study. A single microarray is a regular glass microscope slide chemically coated to allow attachment of DNA segments. The “printing” is a procedure that transfers cDNA gene clones from our plastic plates onto the glass slides by a microarray printing robot. A very similar construction process is described in more detail by Place and Hofmann (2008).
2. Tissue Collection and Custom Microarray Use
Tissue collection and field temperature data
For this experiment, nine S. purpuratus individuals were collected by SCUBA from each of four subtidal sites (approximately 10–20 m depths) along the organisms’ biogeographic range: (1) Fogarty Creek, Oregon, (2) Point Conception, California, (3) Refugio, California, and (4) Puerto Kennedy, Baja California (Table 5.1, Figure 5.1). Tissue samples (tubefoot) were dissected immediately after collection; tubefoot tissue was flash frozen in liquid nitrogen to preserve natural gene expression levels. During the tissue dissection period, adult sea urchins were suspended in seawater until 100–250 mg portions of tubefoot tissue could be excised from each individual. Field temperatures were acquired by a dive computer at the time of collection, and in addition for Refugio, by tidbit loggers attached to nearby moorings at 9 m depths.
cDNA sample preparation and microarray hybridization
RNA was isolated from the tubefoot tissue using the protocol similar to that used by Place et al. (2008), as described above. Microarray processing and analysis were carried out according to the methods described by Place et al. (2008). Briefly, three pooled samples were generated for each site, by combining equal RNA quantities of three individual S. purpuratus RNA preparations. The pooled RNA samples were then transcribed to cDNA and applied to the custom cDNA microarrays to competitively hybridize to the cDNA printed on the slides. This hybridization (which is when DNA strands naturally attach to each other) was done in the presence of fluorescent tags, which enabled later quantification of the RNA for each gene that was present in each sample at the time of collection. This quantification was carried out by a fluorescent microarray scanner and analyzed using scanner-specific software (see Place et al. 2008). After quality screening, data were analyzed using one-way ANOVA by site and Principal Component Analysis (PCA) analysis where groups of genes whose expression were correlated were used as principal components (see Raychaudhuri et al. 2000). The False Discovery Rate (FDR) method (Benjamini and Hochberg 1995) was used to control for error associated with multiple comparisons in the results of the one-way ANOVAs.
RESULTS
Geographic variation in gene expression
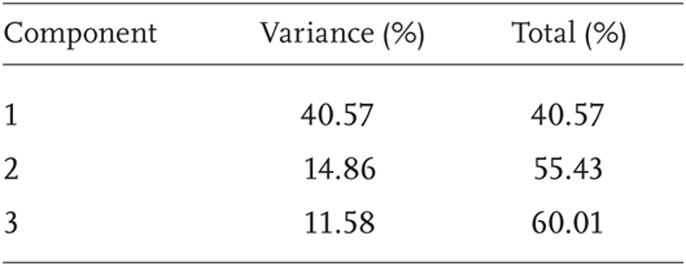
Only 195 of the 796 genes were found in sufficient abundance to be analyzed. Of these 195 gene comparisons, 36 were found to vary significantly using one-way ANOVA. Of these genes, 12 were previously identified and cataloged, eight were identified as hypothetical genes, and 16 remain as unidentified DNA segments. A summary of the results of PCA performed on the geographic expression are presented in Table 5.2. In the PCA, 60% of the total variation can be represented among the first three principal components (Table 5.2). However, the second and third components are the focus of this chapter, as each of these two components represented a different suite of genes that covaried to a relatively large degree among the samples. The reason is that there exist some genes that are expressed in all individuals at high levels, among them so-called “house-keeping” genes required for basic cell function, and others that are rarely expressed. Since this study was concerned with variation among urchins exposed to different environments, not the gene-to-gene variation within individuals that comprised the first component of the statistical analysis, this component was ignored. Focusing on these components allows the analysis of geographic and environmental patterns of gene expression. Unfortunately, many of the genes represented in these principal components remain unidentified, so we are unable to analyze which biochemical pathways may be most affected by environmental variation. However, we are able to analyze the geographic patterns of expression of these gene suites to investigate which geographic sites have the most similar impact on the function of the cells of these purple sea urchins.
TABLE 5.2
Percentage of variance explained by each of the first three principal components, and the cumulative variance of all of the components
To visualize the relationships among the microarrays, each array was plotted onto components 2 and 3 (Figure 5.2). The individual arrays were generally assorted in groups within their sites (Figure 5.2). For comparisons among sites, Fogarty Creek, Oregon, and Puerto Kennedy, Baja California, overlapped very closely on component 2 and partially overlapped on component 3. The gene expression patterns observed in the urchins collected at Refugio, California, and Point Conception, California, both plotted onto their own coordinates of the graph (Figure 5.2).
Habitat temperatures
The habitat temperatures at the time of collection were similar for all sites [near 10°C (50°F)] except Refugio, which was approximately 17.7°C at the time of collection (Table 5.1). Over a longer timescale, however, the temperatures of the collection sites decreased from south to north by approximately 2–5°C between each site from Refugio, California, to Fogarty Creek, Oregon, for much of the month prior to tissue collection (Figure 5.3). Gene expression can change in response to short-term as well as long-term environmental conditions, so temperature over both of these timescales could have influenced the expression of genes in these sea urchin populations. Long-term temperature data for the Baja site were not available.
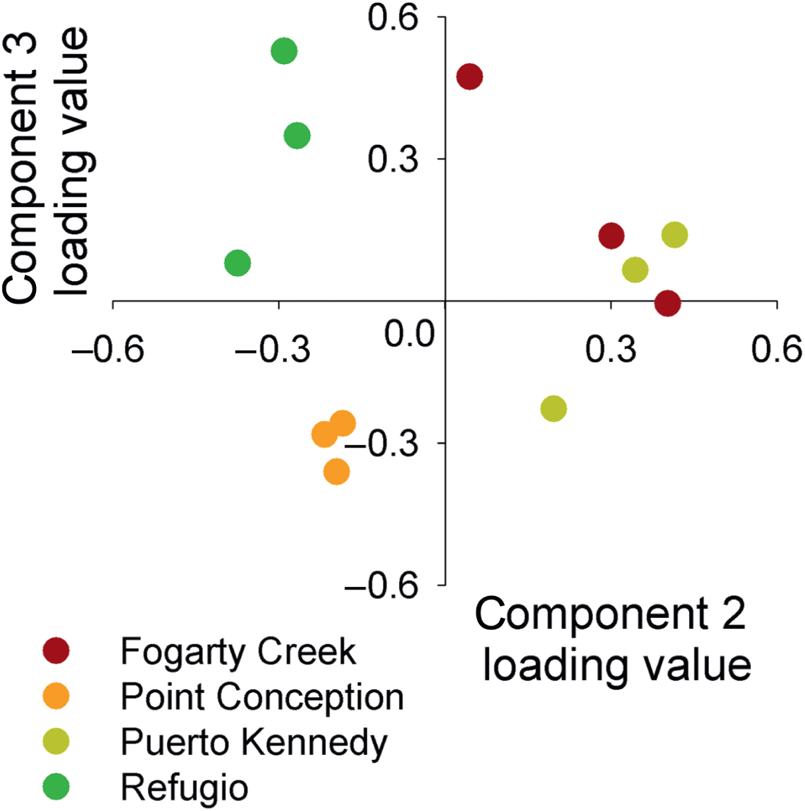
FIGURE 5.2: Each of the 12 microarrays plotted onto components 2 and 3 and colored by their geographic site.
DISCUSSION
This study is one of the few to use functional measures to directly test the cellular state of natural populations across their range (e.g., Sagarin and Somero 2006, Lester et al. 2007, Place et al. 2008), by comparing natural populations of urchins near the middle of their range in Oregon to those closer to their range edge in Baja California. A central aim of this study was to utilize a multi-gene effort in an attempt to assemble environmental “fingerprints” of cellular and organismal state at varying biogeographic positions, and to use this information to infer the influences of environmental variation on natural marine populations. The results of this approach contrasted with the prediction that geographic distance would be negatively correlated with gene expression similarity. Instead, variation in gene expression was at least as pronounced over short distances (100 km) as larger ones (>1500 km). This finding supports the notion that the California coast is a variable complex region, driven by regional processes, such as upwelling and variation in coastal topography and ocean currents. These results also suggest that it is unlikely that a simple “climate envelope” model, which can be thought of as a temporal snapshot of a highly variable system, will be able to predict the biological impacts of climate change on California’s marine coastal ecosystems. Change in the climate of this habitat could lead to such changes as range contractions and / or fragmentation based on small-scale geographic changes rather than generally predicted range shifts.

FIGURE 5.3: Thermal profiles near the collection sites of Fogarty Creek, OR; Point Conception, CA; and Refugio, CA, for 30 days prior to collection. Note: Data for the Baja California site were not available.
The central aim of the research described in this study was to assess the cellular expression states of S. purpuratus along the biogeographic range in order to better understand how it might respond to future environmental change. This was addressed by measuring gene expression levels with a custom cDNA microarray in natural populations of S. purpuratus at four sites along its range: (1) Fogarty Creek, Oregon, (2) Point Conception, California, (3) Refugio, California, and (4) Puerto Kennedy, Baja California. The central finding of the study is that the gene expression profiles of S. purpuratus located at the two most distant sites, Fogarty Creek, Oregon and Puerto Kennedy, Baja California, were the two most similar among all four sites.
These observed geographic patterns of gene expression were inconsistent with the predictions of a generalized climate envelope as typically envisioned on a large (e.g., continent-wide scale) scale, which would predict that urchins located at sites nearest to each other would experience the most similar physiological challenges, and thereby display the more similar gene expression patterns. The reasons for this unexpected geographic pattern are not readily apparent. One possible explanation is that these patterns are associated with the level of temporal environmental variation experienced at each site caused by upwelling, as was found by Stillman and Tagmount (2009) in porcelain crabs on the California coast. Indeed, the local temporal variation in temperature due to the timing of upwelling events was a better predictor of gene expression than mean habitat temperature in natural populations of these crabs (Stillman and Tagmount 2009). The frequency of coastal upwelling is possibly a factor in producing the gene expression profiles we found in the purple urchin, but the patterns of regional coastal upwelling are both spatially and temporally complex (Pickett and Schwing 2006), making this hypothesis difficult to test. Certainly, in theory, gene expression would more likely be affected by the high seawater-nutrient content and / or cool waters brought to the surface by coastal upwelling than by similarities in mean sea-surface water temperature. Complexity in upwelling patterns thus suggests that predicting the future spatial patterns of species associated with upwelling conditions will be particularly challenging.
A similar association between the gene expression profiles of spatially distant populations was found in intertidal Mytilus californianus mussels in central Oregon and Northern Baja, California (Place et al. 2008). These similarities between shallow water S. purpuratus sea urchins and intertidal M. californianus mussels suggest that intertidal communities may respond to changes due to climate change in a manner similar to how shallow subtidal species react, despite the fact that intertidal mussels are expected to respond predominantly to the timing of tides (Helmuth et al. 2002). Instead, the temporal variability in the environment, derived from night / day cycles, upwelling, etc., may be a large driver of these gene expression patterns (e.g., Stillman and Tagmount 2009).
Another example of the physiological effects of the complex California coastal ecosystem is the difference in S. purpuratus expression profiles across the area around Point Conception. The Point Conception and Refugio, California sites, though separated by less than 100 km, are also separated by Point Conception itself, which experiences colliding ocean currents. As a result, there is a mean annual thermal disparity of 3°C (5.4°F) across this point. The thermal disparity is similar to that observed between Point Conception and central Oregon. At Point Conception, colliding ocean currents carry waters southward from Alaska and northward from Southern California, producing a broad range of environmental conditions over a small geographic distance. This sharp thermal cline is believed to be a reason why Point Conception acts as a major marine zoogeographic boundary in California (Briggs 1974), again highlighting the spatial complexity of the California near-shore coastal ecosystem. These results suggest that the spatial complexity of environmental factors along the marine coast of California may invalidate the assumptions and thereby the predictions generated by a standard “climate envelope” model for these species.
Another aspect of the study that could have influenced our results is the differences in collection depth among the different sites (Table 5.1). While the overall pattern of gene expression that we observed did not correlate very well with the depth of collection, it cannot be ruled out that the similarity of the gene expression profiles of the Oregon and Baja California sea urchins could be a product of those urchins’ relatively shallow collection depth. However, no study of such an effect has ever been conducted, so the potential for this effect is unknown.
One aspect that could confound the results of this study is that some S. purpuratus individuals may be more closely related to those living nearest to them, and we would expect more closely related individuals to have more similar gene expression patterns. However, the only examination of the genetic relatedness of S. purpuratus looked at the sequence of genes along its range, and found that the gene sequences of the Oregon sea urchins probably differ from those occurring in Baja California (S. Palumbi, pers. comm.), but our study found similarity in gene expression patterns between these two populations. Therefore, it seems that the pattern of gene expression similarity between Oregon sea urchins and those from Baja California found in this study is unlikely a result of genetic relatedness.
SOLUTIONS, ADAPTATION, AND LESSONS LEARNED
In the end, we are still left with the question “Where will S. purpuratus and S. franciscanus sea urchins go in response to climate change?” The answer to this question lies in the answers to two more basic questions: (1) What are the physiological or ecological limits of environmental change for California’s marine species? And (2) how will patterns of environmental change manifest themselves along the California coast? The study described in this chapter was primarily aimed at answering the physiological aspect of the first question. Species’ ecologies, for example, range shifts, will certainly play a role in determining the biological fate of California’s marine ecosystems. However, while the potential biological impacts of climate change on the marine environment have been considered extensively (e.g., Parmesan and Yohe 2003, Helmuth et al. 2005, Harley et al. 2006), predictions of species responses have not.
On average, the surface seawater of California has warmed 1.3°C (2.3°F) over the last 50 years (Di Lorenzo et al. 2005), and while some California marine species’ ranges have recently shifted pole-ward into historically cooler habitats (e.g., Zacherl et al. 2003, Sorte et al. 2010), the environmental complexity of the California coastal marine ecosystem could instead force species ranges to fragment, species to go extinct, or cause complex ecological shifts (e.g., Schiel et al. 2004, Helmuth et al. 2006). In other words, species may be isolated from historically cooler habitats by virtual blockades of warmer waters to the north of their range. While many marine invertebrates, such as sea urchins, mussels, and snails, do not travel far as adults, their larvae can float in the water column for up to a few weeks often traveling great distances before they morph into their adult form. However, since marine larvae are too small to fight against water currents, their movements are at the mercy of these currents, and current dynamics can also act as a dispersal barrier. Owing to the high levels of environmental variation in the intertidal zone, intertidal species may be more likely to go extinct than subtidal species (Stillman 2003). Shallow subtidal species, on the other hand, may be able to tolerate greater levels of environmental change (Stillman 2003) or migrate into deeper waters in response to climate change. Alternatively, the distributions of some shallow-water species may be regulated by factors other than temperature and pH, such as coastal topography (e.g., Broitman and Kinlan 2006), loss of “ecosystem engineers” (Moore et al. 2007), or a combination of several environmental factors (Scavia et al. 2002, Thompson et al. 2002). Likely, the biological impacts of climate change will be mediated synergistically through both physiological and ecological mechanisms (Clarke 1993, Sanford 1999).
California sea urchin species face not only ocean warming, but also acidification driven by rising CO2 emissions and commercial harvesting. One of the main management tools at our disposal is the implementation of harvesting regulations, such as those in Marine Protected Areas (MPAs) to limit the fishing stress. However, no-take zones, such as MPAs, also have complex ecological effects and have been shown to limit urchin populations through increases in fish- and lobster-predator abundance (Behrens and Lafferty 2004). Climate change, particularly ocean acidification, which may negatively affect sea urchin growth rates (O’Donnell et al. 2010), in conjunction with harvesting and MPAs, may increase the rate of sea urchin decline in California. In this case, urchin-specific MPAs may be recommended in areas that are currently cooler, such as Northern California and Oregon, where urchins are currently abundant and living substantially below their upper temperature limits.
Manager Comments
Christopher J. Osovitz
in conversation with
Deborah Aseltine-Neilson
Osovitz: To your knowledge, are temperature gradients considered in locations for marine protected areas, or in other designations that limit fishing in California?
Aseltine-Neilson: Yes, temperature gradients are considered in locations for management of species. Currently, the California Department of Fish and Wildlife has divided the California coast info four management regions, and some biogeographic regions have been identified within those regions. These four areas are used for wildlife management, but fisheries management as well. The understanding is that these regions will likely change as California’s climate changes.
Osovitz: To the extent that climate change is currently considered in marine spatial planning and policy, would you say that in general there is an assumption that marine species will “simply” shift toward the north? Are there good examples of plans or policies that have tried to delve into the complexity of factors that may influence species distributions, and potential responses to changes in ocean conditions?
Aseltine-Neilson: This is a relatively new area of research. As of now, there is no scientific consensus in predictions regarding the biogeographic responses of California’s marine species. This is partly because the geography of the physical conditions is complicated by oceanographic factors, such as upwelling, currents, and El Nino. As of now, we are not beginning with the prediction that species will simply shift northward. Since we do not have the specifics of all of these factors, we are not making specific predictions regarding future changes in biogeographic ranges. As we learn more, these factors will be considered in future action plans.
Osovitz: To what extent is ocean acidification, and potentially higher vulnerability of species like urchins that produce calcareous shells, figuring into marine conservation?
Aseltine-Neilson: We certainly recognize that ocean acidification is a potentially very serious issue, but there isn’t very much information on specifically how ocean acidification might impact California’s ecosystems yet. The research is still be compiled, but the California Department of Fish and Wildlife is very interested in seeing the results of these studies. One way that this type of change may impact management strategies is that these strategies may become more precautionary, as there is some data that suggest that ocean acidification could have the largest impacts of any of the changing climate factors. One question left unanswered is whether the current species have the genetic makeup to tolerate acidification. For sea urchins, for example, their ability to produce roe in an acidified climate is the most important factor for fisheries. Do these species currently possess the genes to produce roes in acidified environments? Another system that we are monitoring is marine pteropods, which are tiny shelled mollusks. These tiny creatures play an important role in foodwebs, which support important commercial fisheries, such as salmon. As a result, it is likely that in the future we will integrate an ecosystem management approach with approaches intended to mitigate the biological impacts of climate change. But again, before any of these approaches are included in management action plans in California, we will need to know much more about the potential effects of OA on California’s ecosystems.
LITERATURE CITED
Behrens, M. D. and K. D. Lafferty. 2004. Effects of marine reserves and urchin disease on southern Californian rocky reef communities. Marine Ecology-Progress Series 279:129–139.
Benjamini, Y. and Y. Hochberg. 1995. Controlling the false discovery rate: A practical and powerful approach to multiple testing. Journal of the Royal Statistical Society: Series B 57:289–300.
Botsford, L. W., A. Campbell, and R. Miller. 2004. Biological reference points in the management of North American sea urchin fisheries. Canadian Journal of Fisheries and Aquatic Sciences 61:1325–1337.
Brierley, A. S. and M. J. Kingsford. 2009. Impacts of climate change on marine organisms and ecosystems. Current Biology 19:R602–R614.
Briggs, J. C. 1974. Marine Zoogeography. McGraw Hill, New York, NY.
Broitman, B. R. and B. P. Kinlan. 2006. Spatial scales of benthic and pelagic producer biomass in a coastal upwelling ecosystem. Marine Ecology-Progress Series 327:15–25.
Brown, P. O. and D. Botstein. 1999. Exploring the new world of the genome with DNA microarrays. Nature Genetics 21:33–37.
Burrows, M. T., D. S. Schoeman, L. B. Buckley, P. Moore, E. S. Poloczanska, K. M. Brander, C. Brown, J. F. Bruno, C. M. Duarte, B. S. Halpern et al. 2011. The pace of shifting climate in marine and terrestrial ecosystems. Science 334:652–655.
Clarke, A. 1993. Temperature and extinction in the sea – A physiologist’s view. Paleobiology 19:499–518.
Dayton, P. K., M. J. Tegner, P. E. Parnell, and P. B. Edwards. 1992. Temporal and spatial patterns of disturbance and recovery in a kelp forest community. Ecological Monographs 62:421–445.
Di Lorenzo, E., A. J. Miller, N. Schneider, and J. C. McWilliams. 2005. The warming of the California current system: Dynamics and ecosystem implications. Journal of Physical Oceanography 35:336–362.
Fields, P. A., J. B. Graham, R. H. Rosenblatt, and G. N. Somero. 1993. Effects of expected global climate-change on marine faunas. Trends in Ecology & Evolution 8:361–367.
Gracey, A. Y. and A. R. Cossins. 2003. Application of microarray technology in environmental and comparative physiology. Annual Review of Physiology 65:231–259.
Harley, C. D. G., A. R. Hughes, K. M. Hultgren, B. G. Miner, C. J. B. Sorte, C. S. Thornber, L. F. Rodriguez, L. Tomanek, and S. L. Williams. 2006. The impacts of climate change in coastal marine systems. Ecology Letters 9:228–241.
Helmuth, B.E., B.R. Broitman, C.A. Blanchette, S. Gilman, P. Halpin, C.D.G. Harley, M.J. O’Donnell, G.E. Hofmann, B. Menge, and D. Strickland. 2006. Mosaic patterns of thermal stress in the rocky intertidal zone: Implications for climate change. Ecological Monographs 76:461–479.
Helmuth, B., C. D. G. Harley, P. M. Halpin, M. O’Donnell, G. E. Hofmann, and C. A. Blanchette. 2002. Climate change and latitudinal patterns of intertidal thermal stress. Science 298:1015–1017.
Helmuth, B., J. G. Kingsolver, and E. Carrington. 2005. Biophysics, physiologicalecology, and climate change: Does mechanism matter? Annual Review of Physiology 67:177–201.
Hijmans, R. J. and C. H. Graham. 2006. The ability of climate envelope models to predict the effect of climate change on species distributions. Global Change Biology 12:2272–2281.
Hoegh-Guldberg, O. and J. F. Bruno. 2010. The impact of climate change on the world’s marine ecosystems. Science 328:1523–1528.
Lester, S. E., B. P. Kinlan, and S. D. Gaines. 2007. Reproduction on the edge: Large-scale patterns of individual performance in a marine invertebrate. Ecology 88:2229–2239.
Moore, P., S. J. Hawkins, and R. C. Thompson. 2007. Role of biological habitat amelioration in altering the relative responses of congeneric species to climate change. Marine Ecology-Progress Series 334:11–19.
O’Donnell, M.J., A.E. Todgham, M.A. Sewell, L.M. Hammond, K. Ruggiero, N.A. Fangue, M.L. Zippay, and G.E. Hofmann. 2010. Ocean acidification alters skeletogenesis and gene expression in larval sea urchins. Marine Ecology Progress Series 398:157–171.
Osovitz, C.J. and G.E. Hofmann. 2005. Thermal history-dependent expression of the hsp70 gene in purple sea urchins: Biogeographic patterns and the effect of temperature acclimation. Journal of Experimental Marine Biology and Ecology 327:134–143.
Osovitz, C. J. and G. E. Hofmann. 2007. Marine macrophysiology: Studying physiological variation across large spatial scales in marine systems. Comparative Biochemistry and Physiology A-Molecular & Integrative Physiology 147:821–827.
Parmesan, C. and G. Yohe. 2003. A globally coherent fingerprint of climate change impacts across natural systems. Nature 421:37–42.
Pearse, J. S. 2006. Perspective – Ecological role of purple sea urchins. Science 314:940–941.
Pickett, M. H. and F. B. Schwing. 2006. Evaluating upwelling estimates off the west coasts of North and South America. Fisheries Oceanography 15:256–269.
Place, S. P., M. J. O’Donnell, and G. E. Hofmann. 2008. Patterns of gene expression in the intertidal mussel, Mytilus californianus: Physiological response to environmental factors on a biogeographic scale. Marine Ecology-Progress Series 356:1–14.
Raychaudhuri, S., J. Stuart, and R. Altman. 2000. Principal components analysis to summarize microarray experiments: Application to sporulation time series. Pacific Symposium on Biocomputing 5:452–463.
Root, T. L., J. T. Price, K. R. Hall, S. H. Schneider, C. Rosenzweig, and J. A. Pounds. 2003. Fingerprints of global warming on wild animals and plants. Nature 421:57–60.
Sagarin, R. D. and S. D. Gaines. 2002a. The ‘abundant centre’ distribution: To what extent is it a biogeographical rule? Ecology Letters 5:137–147.
Sagarin, R. D. and G. N. Somero. 2006. Complex patterns of expression of heat-shock protein 70 across the southern biogeographical ranges of the intertidal mussel Mytilus californianus and snail Nucella ostrina. Journal of Biogeography 33:622–630.
Sanford, E. 1999. Regulation of keystone predation by small changes in ocean temperature. Science 283:2095–2097.
Scavia, D., J. C. Field, D. F. Boesch, R. W. Buddemeier, V. Burkett, D. R. Cayan, M. Fogarty, M. A. Harwell, R. W. Howarth, C. Mason et al. 2002. Climate change impacts on US coastal and marine ecosystems. Estuaries 25:149–164.
Schiel, D. R., J. R. Steinbeck, and M. S. Foster. 2004. Ten years of induced ocean warming causes comprehensive changes in marine benthic communities. Ecology 85:1833–1839.
Schulte, P. M. 2001. Environmental adaptations as windows on molecular evolution. Comparative Biochemistry and Physiology Part B: Biochemistry & Molecular Biology 128:597–611.
Sorte, C. J. B. and G. E. Hofmann. 2004. Changes in latitudes, changes in aptitudes: Nucella canaliculata (Mollusca: Gastropoda) is more stressed at its range edge. Marine Ecology-Progress Series 274:263–268.
Sorte, C. J. B., S. L. Williams, and J. T. Carlton. 2010. Marine range shifts and species introductions: Comparative spread rates and community impacts. Global Ecology and Biogeography 19:303–316.
Stillman, J. H. 2003. Acclimation capacity underlies susceptibility to climate change. Science 301:65.
Stillman, J. H. and A. Tagmount. 2009. Seasonal and latitudinal acclimatization of cardiac transcriptome responses to thermal stress in porcelain crabs, Petrolisthes cinctipes. Molecular Ecology 18:4206–4226.
Thompson, R. C., T. P. Crowe, and S. J. Hawkins. 2002. Rocky intertidal communities: Past environmental changes, present status and predictions for the next 25 years. Environmental Conservation 29:168–191.
Turay, L., G. F. Gerlach, and G. Goldspink. 1991. Changes in myosin HC gene-expression in the common carp during acclimation to warm environmental temperatures. Journal of Physiology 435:102.
Watanabe, J. M. and C. Harrold. 1991. Destructive grazing by sea-urchins Strongylocentrotus spp in a central California kelp forest – Potential roles of recruitment, depth, and predation. Marine Ecology-Progress Series 71:125–141.
Zacherl, D., S. D. Gaines, and S. I. Lonhart. 2003. The limits to biogeographical distributions: Insights from the northward range extension of the marine snail, Kelletia kelletii (Forbes, 1852).Journal of Biogeography 30:913–924.