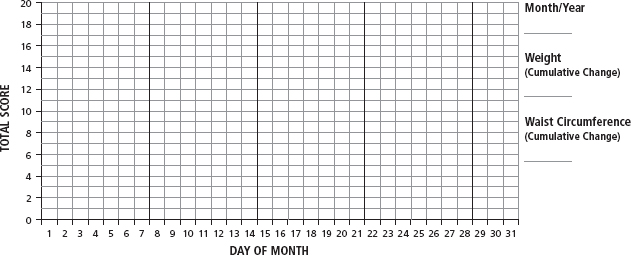
MONTHLY PROGRESS CHART
This chart will let you monitor your progress month to month. In addition, you will be able to see how the amount of processed carbohydrate you eat each day may affect your results. Graph your Total Score from the Daily Tracker onto this chart by placing a circle (•) in the appropriate place, or download the file from www.alwayshungrybook.com. Use the ink color that corresponds to the number of processed carbohydrates you consumed on that day as indicated on the Daily Tracker (0 to 1—green; 2—yellow; 3 or more—red). If starting the program in the middle of a month, leave the preceding days blank. At the end of the month, record cumulative change in weight and waist circumference (compared to baseline).
Enter your baseline measurements (before starting the program):
Weight _____________ Waist circumference _____________
