CHAPTER 16
Analysis of Financial Institutions
Solutions
- A is correct. Banks are more likely to be systemically important than non-financial companies because, as intermediaries, they create financial linkages across all types of entities, including households, banks, corporates, and governments. The network of linkages across entities means that the failure of one bank will negatively affect other financial and non-financial entities (a phenomenon known as financial contagion). The larger the bank and the more widespread its network of linkages, the greater its potential impact on the entire financial system. The assets of banks are predominantly financial assets, such as loans and securities (not deposits, which represent most of a bank’s liabilities). Compared to the tangible assets of non-financial companies, financial assets create direct exposure to a different set of risks, including credit risks, liquidity risks, market risks, and interest rate risks.
- A is correct. Basel III specifies the minimum percentage of its risk-weighted assets that a bank must fund with equity capital. This minimum funding requirement prevents a bank from assuming so much financial leverage that it is unable to withstand loan losses or asset write-downs.
- C is correct. The approach used by Johansson to evaluate banks, the CAMELS approach, has six components: (1) capital adequacy, (2) asset quality, (3) management capabilities, (4) earnings sufficiency, (5) liquidity position, and (6) sensitivity to market risk. While the CAMELS approach to evaluating a bank is fairly comprehensive, some attributes of a bank are not addressed by this method. One such attribute is a bank’s competitive environment. A bank’s competitive position relative to its peers may affect how it allocates capital and assesses risks.
- A is correct. The underwriting expense ratio is an indicator of the efficiency of money spent on obtaining new premiums. The underwriting loss ratio is an indicator of the quality of a company’s underwriting activities—the degree of success an underwriter has achieved in estimating the risks insured. The combined ratio, a measure of the overall underwriting profitability and efficiency of an underwriting operation, is the sum of these two ratios.
- C is correct. The products of the two types of insurance companies, P&C and L&H, differ in contract duration and claim variability. P&C insurers’ policies are usually short term, and the final cost will usually be known within a year of the occurrence of an insured event, while L&H insurers’ policies are usually longer term. P&C insurers’ claims are more variable and “lumpier” because they arise from accidents and other less predictable events, while L&H insurers’ claims are more predictable because they correlate closely with relatively stable, actuarially based mortality rates applied to large populations. The relative predictability of L&H insurers’ claims generally allows these companies to have lower capital requirements and to seek higher returns than P&C insurers.
- C is correct. The combined ratio, which is the sum of the underwriting expense ratio and the loss and loss adjustment expense ratio, is a measure of the efficiency of an underwriting operation. A combined ratio of less than 100% is considered efficient; a combined ratio greater than 100% indicates an underwriting loss. Insurer C is the only insurer that has a combined ratio less than 100%.
- C is correct. Over the past three years, there has been a downward trend in the two VaR measures—total trading VaR (all market risk factors) and total trading and credit portfolio VaR. This trend indicates an improvement in ABC Bank’s sensitivity, or a reduction in its exposure, to market risk. The two liquidity measures—the liquidity coverage ratio and the net stable funding ratio—have increased over the past three years, indicating an improvement in ABC Bank’s liquidity position. Trends in the three capital adequacy measures—common equity Tier 1 capital ratio, Tier 1 capital ratio, and total capital ratio—indicate a decline in ABC Bank’s capital adequacy. While the total capital ratio has remained fairly constant over the past three years, the common equity Tier 1 capital ratio and the Tier 1 capital ratio have declined. This trend suggests that ABC Bank has moved toward using more Tier 2 capital and less Tier 1 capital, indicating an overall decline in capital adequacy.
- A is correct. Claims associated with life and health insurance companies (Cobalt) are more predicable than those for property and casualty insurance companies (Vermillion). Property and casualty insurers’ claims are more variable and “lumpier” because they arise from accidents and other unpredictable events, whereas life and health insurers’ claims are more predictable because they correlate closely with relatively stable actuarially based mortality rates when applied to large populations.
- B is correct. The loss and loss adjustment expense ratio decreased from 61.3% to 59.1% between 2016 and 2017. This ratio is calculated as follows: (Loss Expense + Loss Adjustment Expense)/Net Premiums Earned. The loss and loss adjustment expense ratio indicates the degree of success an underwriter has achieved in estimating the risks insured. A lower ratio indicates greater success in estimating insured risks.
- B is correct. The quality of earnings is directly related to the level of sustainable sources of income. Trading income tends to be volatile and not necessarily sustainable. Higher-quality income would be net interest income and fee-based service income. Because N-bank’s 2017 trading revenue contribution is the lowest relative to other banks, its quality of earnings would be considered the best of the three banks.
- B is correct. Trading revenue per unit of risk can be represented by the ratio of annual trading revenue to average daily trading value at risk (VaR) and represents a measure of reward-to-risk. The trading revenue per unit of risk improved at N-bank (from 134× to 160×) between 2016 and 2017, and there was no change at T-bank (80×). VaR can be used for gauging trends in intra-company risk taking.
- B is correct. Exhibit 4 indicates that exposure to free-standing credit derivatives dramatically declined from a peak during the global financial crisis in 2008. If a derivatives contract is classified as freestanding, changes in its fair value are reported as income or expense in the income statement at each reporting period. The immediate recognition of a gain or loss in earnings, instead of reporting it in other comprehensive income, can lead to unexpected volatility of earnings and missed earnings targets. As a result, earnings volatility from the use of credit derivatives most likely decreased.
- A is correct. A bank’s net interest margin represents the difference between interest earned on loans and other interest-bearing assets and the level of interest paid on deposits and other interest-bearing liabilities. Banks typically borrow money for shorter terms (retail deposits) and lend to customers for longer periods (mortgages and car loans). If the yield curve unexpectedly inverts, the short-term funding costs will increase, and the net interest margin will most likely decrease (not remain unchanged or increase).
- C is correct. Reverse repurchase agreements represent collateralized loans between a bank and a borrower. A reverse repo with a 30-day maturity is a highly liquid asset and thus would directly affect the liquidity coverage ratio (LCR). LCR evaluates short-term liquidity and represents the percentage of a bank’s expected cash outflows in relation to highly liquid assets.
- C is correct. Industry C, representing global commercial banks, most likely has the highest level of global systemic risk because global commercial banks have the highest proportion of cross-border business. Unlike banks, the overall insurance market (of which Industry A is a subset) has a smaller proportion of cross-border business, and insurance companies’ foreign branches are generally required to hold assets in a jurisdiction that are adequate to cover the related policy liabilities in that jurisdiction. As an international property and casualty (P&C) insurer, Company A provides protection against adverse events related to autos, homes, or commercial activities; many of these events have local, rather than international, impact. Industry B, credit unions, most likely has the lowest level of global systemic risk. Credit unions are depository institutions that function like banks and offer many of the same services, but they are owned by their members rather than being publicly traded as many banks are.
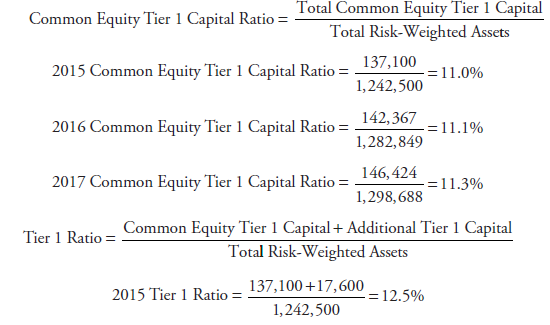
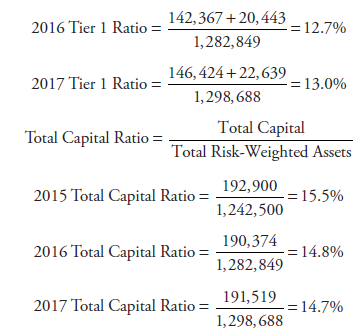
- A is correct. Company XYZ’s key capital adequacy ratios show mixed conditions. The ratios are calculated as follows:


2017 2016 2015 Common equity Tier 1 capital ratio 11.3% 11.1% 11.0% Tier 1 capital ratio 13.0% 12.7% 12.5% Total capital ratio 14.7% 14.8% 15.5% The common equity Tier 1 capital ratio and the Tier 1 capital ratio both strengthened from 2015 to 2017, but the total capital ratio weakened during that same period, signaling mixed conditions.
- A is correct. Company XYZ’s liquid assets as a percentage of total assets declined each year since 2015, indicating declining liquidity.
2017 2016 2015 $m % of Total
Assets$m % of Total
Assets$m % of Total
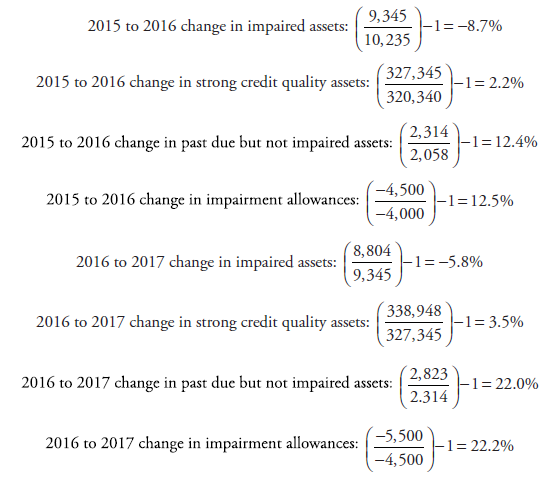
AssetsTotal liquid assets 361,164 18.7% 354,056 19.7% 356,255 21.1% Investments 434,256 22.5% 367,158 20.4% 332,461 19.7% Loans Consumer loans 456,957 450,576 447,493 Commercial loans 499,647 452,983 403,058 Total loans 956,604 49.6% 903,559 50.3% 850,551 50.4% Goodwill 26,693 1.4% 26,529 1.5% 25,705 1.5% Other assets 151,737 7.9% 144,210 8.0% 121,780 7.2% Total assets 1,930,454 100% 1,795,512 100% 1,686,752 100% - C is correct. Impairment allowances have increased proportionately to the increases in the amount of past due but not impaired assets, which may be in anticipation of these past due assets becoming impaired. Impaired assets have decreased each year while strong credit quality assets have increased each year, which suggests lowering impairment allowances as a result of improving credit quality of these financial instruments.
At December 31 2017 2016 2015 $m $m $m Strong credit quality 338,948 327,345 320,340 Good credit quality 52,649 54,515 54,050 Satisfactory credit quality 51,124 55,311 56,409 Substandard credit quality 23,696 24,893 27,525 Past due but not impaired 2,823 2,314 2,058 Impaired 8,804 9,345 10,235 Total gross amount 478,044 473,723 470,617 Impairment allowances −5,500 −4,500 −4,000 Total 472,544 469,223 466,617 YoY change in impaired assets −5.8% −8.7% YoY change in strong credit quality assets 3.5% 2.2% YoY change in past due but not impaired assets 22.0% 12.4% YoY change in impairment allowances 22.2% 12.5% Note: YoY = year-over-year

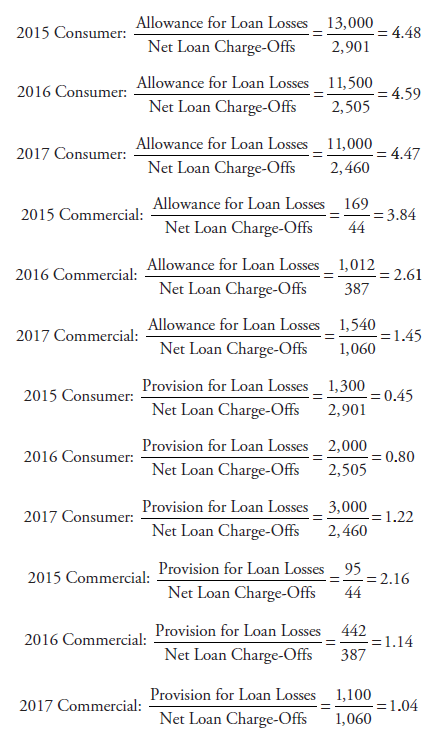
- C is correct. The allowance for loan losses to net commercial loan charge-offs has been declining during the last three years, which indicates that the cushion between the allowance and the net commercial loan charge-offs has deteriorated.

2017 2016 2015 $m $m $m Consumer loans Allowance for loan losses 11,000 11,500 13,000 Provision for loan losses 3,000 2,000 1,300 Charge-offs 3,759 3,643 4,007 Recoveries 1,299 1,138 1,106 Net charge-offs 2,460 2,505 2,901 Commercial loans Allowance for loan losses 1,540 1,012 169 Provision for loan losses 1,100 442 95 Charge-offs 1,488 811 717 Recoveries 428 424 673 Net charge-offs 1,060 387 44 Allowance for loan losses to net loan charge-offs: consumer 4.47 4.59 4.48 Allowance for loan losses to net loan charge-offs: commercial 1.45 2.61 3.84 Provision for loan losses to net loan charge-offs: consumer 1.22 0.80 0.45 Provision for loan losses to net loan charge-offs: commercial 1.04 1.14 2.16 - B is correct. The net benefit plan obligation has steadily decreased during the last three years, which indicates a lower degree of risk posed by the benefit plan.