Movers, Shakers, Moneymakers
Most cruise liners double as pirate ships when they are not carrying passengers. And sometimes when they are.
Worldwide cruise industry revenue
vs.
Pirate attacks in Indonesia

Continued high piracy rates in Indonesia are partly attributable to international bureaucratic red tape. Indonesia has no jurisdiction outside of its own waters, so pirates can evade capture by sailing over toward the sea surrounding Singapore or Malaysia.
SOURCES:
Cruise Market Watch, “2014 Cruise Trends Forecast”
ICC International Maritime Bureau, “Piracy and armed robbery against ships”
Price per gallon of gas
vs.
Lawyers in Texas
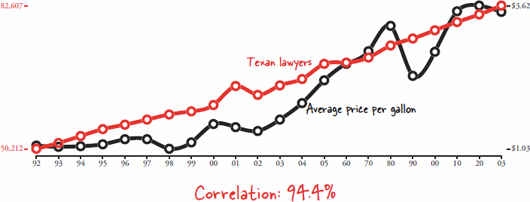
Gas prices are highly dependent on where you live. In the United States, a rule of thumb is that Mississippi is roughly the center of a bull’s-eye where gas is the cheapest, and gas gets more expensive in rings as you go farther out. California, Oregon, and Washington State are the priciest. Virginia is the exception on the East Coast, with drastically lower gas prices than its neighbors.
SOURCES:
U.S. Energy Information Administration
American Bar Association, National Lawyer Population by State
Value of the Victoria’s Secret Fantasy Bra
vs.
U.K. men who smoke cigarettes
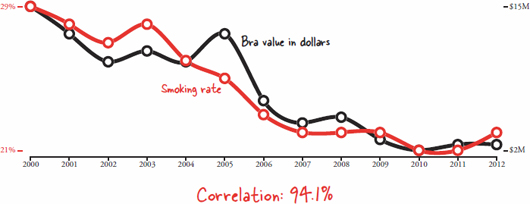
The $15 million bra was called “Red Hot Fantasy” and was modeled by Gisele Bündchen. In 1996, the bra was called the “Million Dollar Miracle.” Any guesses what its estimated value was?
SOURCES:
Wikipedia: “Victoria’s Secret Fashion Show”
U.K. Office for National Statistics, General Lifestyle Survey and Opinions and Lifestyle Survey
March Madness TV ad revenue
vs.
Breweries in the United States
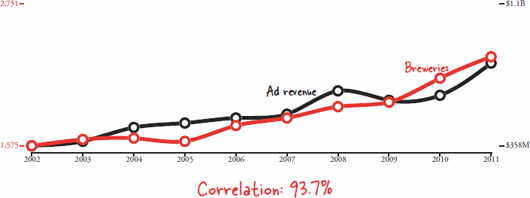
A graph depicting the number of breweries in the United States over the past two hundred years takes on a unique shape. The overall count of breweries is only just now reaching the level it was at in the 1880s. In between was the mid-twentieth-century lull, which had even more of a long-term impact than Prohibition.
SOURCES:
Kantar Media (Remember when we discussed Y-axes in the introduction? Check out how powerful changing the axes on a graph can be by comparing this March Madness line to the one here.)
Beer Institute, Historical Sources
Brewing Industry Research Program
Spending on Christmas gifts
vs.
Juvenile drug arrests
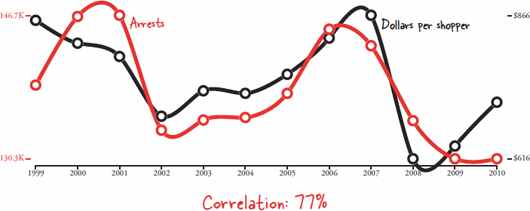
When polled in November 2014, fewer than 10 percent of Americans were willing to report being “not sure” exactly how much they were going to spend on Christmas presents. Everyone else had apparently predicted to the dollar how much they were going to spend.
SOURCES:
Gallup Poll, survey question: “Roughly how much money do you think you personally will spend on Christmas gifts this year?” (1,028 respondents, at least 50 percent of whom were cell phone respondents contacted by using random digit dialing methods. Hats off to those who respond to survey cold calls on their cell phone.)
U.S. Department of Justice, Federal Bureau of Investigation: Uniform Crime Reports
LEGO revenue
vs.
Worldwide revenue from commercial space launches

If you’re paying close attention to the graphs, you may be wondering what “mDKK” is. The answer would be “millions of Danish krones.” LEGO Group is based in Denmark, so all of its finances are in the Danish krone. The krone has a terrible exchange rate to the USD.
SOURCES:
LEGO Group Annual Reports
Federal Aviation Administration, “Commercial Space Transportation: 2010 Year in Review”
Domino’s is a front company: The real reason they have pizza is to feed their army of computer hackers.
Earnings per share of Domino’s Pizza Group
vs.
Economic loss due to cybercrime
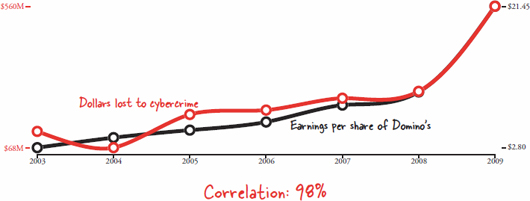
“Cybercrime” is incredibly difficult to track. Besides the surface difficulty of defining cybercrime and tracking cause of losses, many local police departments are simply not equipped to handle cybercrime reports.
SOURCES:
Domino’s Pizza Annual Reports
Internet Crime Complaint Center, referred cases only
Cosmopolitan magazine ad revenue
vs.
Coal imports to Germany

Cosmopolitian is one of the top money-making magazines. However, it doesn’t even begin to compare to People, which brought in nearly $1 billion in 2012.
SOURCES:
The Association of Magazine Media
U.S. Energy Information Administration, International Energy Statistics
Krispy Kreme doughnut stores
vs.
Market share for midsize vans

Krispy Kreme is incredibly interested in being a deluxe brand. Since 2005, they have closed hundreds of locations housed in gas stations and grocery stores that made them look cheap and “normal.”
SOURCES:
Advertising Age, “Krispy Kreme’s Secret Growth Recipe”
U.S. Department of Transportation, Bureau of Transportation Statistics
Physical retail sales of video games
vs.
UFO sightings in Massachusetts
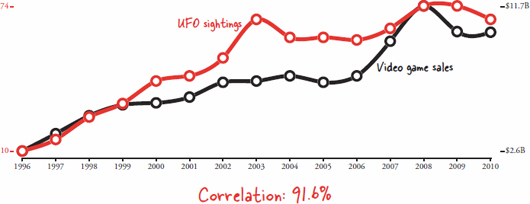
Physical sales of video games hit their all-time peak in 2008. As in, they will never, ever be that high again. Annual sales have since halved as the internet becomes the go-to distribution method.
SOURCES:
Entertainment Software Association, “Essential Facts About the Computer and Video Game Industry” (2014)
National UFO Reporting Center
Shoe sales
vs.
Mount Everest ascents
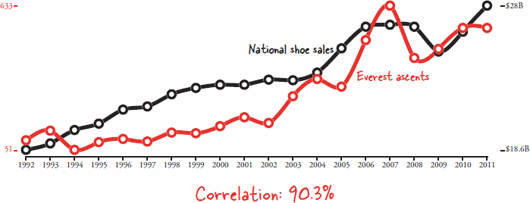
Contrary to popular belief, exposure to the cold and frostbite are not the top killers on Everest—they only account for about 12 percent of fatalities. One-third of deaths are due to something much simpler and predictable at five and a half miles up: falling.
SOURCES:
U.S. Department of Commerce, Monthly Retail Trade Report
CBC News, “Mount Everest by the numbers” (Ascents tracked by Eberhard Jurgalski for www.8000ers.com.)
Facebook users
vs.
Total U.S. wind power generation capacity
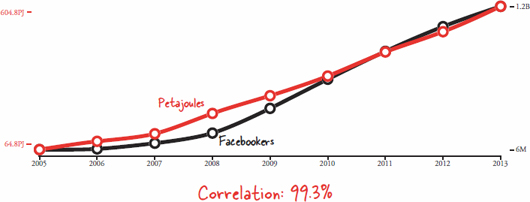
In order to time travel in Back to the Future, Dr. Brown needed 1.21 gigawatts of electricity. He got it from nuclear power, and later lightning, which is good, because at a measly 1.5MW maximum generating capacity and 25 percent average output, it would take more than 3,000 wind turbines to send the DeLorean anywhere interesting.
SOURCES:
The Guardian: Datablog, “Facebook: 10 years of social networking, in numbers”
U.S. Energy Information Administration (A petajoule is one quadrillion joules. Joules are a unit of energy, which makes them a more logical choice than the utility standard “kilowatt-hours.” Since kilowatts are a unit of energy over time, measuring kilowatt-hours instead of megajoules is like measuring distance in miles-per-hour-hours instead of just miles.)
Harley-Davidson’s motorcycle revenue
vs.
U.S. fertility rate
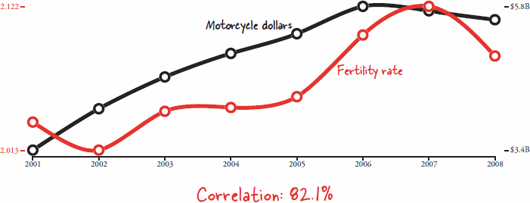
Any fertility rate below 2,110 (2.11 children per woman) results in a net loss of population based on average mortality. Without immigration, the U.S. population would decline.
SOURCES:
Harley-Davidson’s Annual Reports
U.S. National Center for Health Statistics, National Vital Statistics Report
German passenger car sales in the United States
vs.
Reports of UFOs that look like cigars

The jump in UFO reports in the late nineties is due not to an actual increase in UFO sightings, but more likely to a change in the ease of reporting: the internet. Once you no longer have to call a phone number and talk to a real person to report what you see, the likelihood that you’ll be willing to file a report dramatically increases.
SOURCES:
U.S. Bureau of Transportation Statistics, National Transportation Statistics
National UFO Reporting Center
Cost to send a postcard via USPS
vs.
Population of Canada

This is actually a really poor reason to move to Canada. Not because postal rates are a bad reason to make a life decision. Rather, in Canada, there’s no special postal rate for postcards. A postcard would cost nearly three times as much to mail in Canada as in the United States.
SOURCES:
U.S. Postal Service, “United States Domestic Postage Rate: Recent History” and unpublished data
Statistics Canada, “Population by year, by province and territory”
Canada Post, “Postage Stamps”
Estimated revenue from all bingo games
vs.
Homes with indoor houseplants
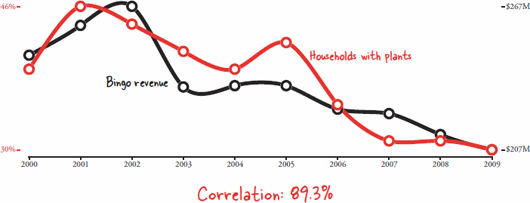
I like to imagine that instead of using a survey, the National Gardening Association sneaks into every house in the sample set to check for plants.
SOURCES:
Christiansen Capital Advisors LLC, “Gaming Revenue by Industry,” prepared for the American Gaming Association
The National Gardening Association, National Gardening Survey (2,000 respondents)
Pandora’s new business model reportedly involves encouraging the Yankees to recruit players from high schools.
Pandora’s net loss in millions
vs.
Average age of New York Yankees batters
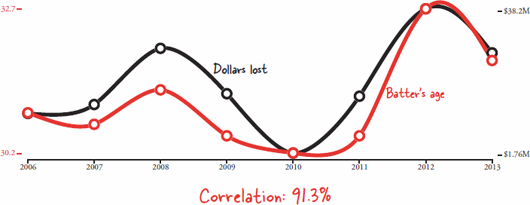
Pandora now pays enough in royalties every year to give $1 to every man, woman, and child in the United States. Even though Pandora has a premium version subscribers can pay for (Pandora One), they still make around seven times as much on advertising on the free accounts as they do from the paid accounts.
SOURCES:
Pandora’s SEC Filings
Baseball-Reference.com, New York Yankees Team Yearly Batting Stats
Microsoft’s revenue
vs.
Political action committees
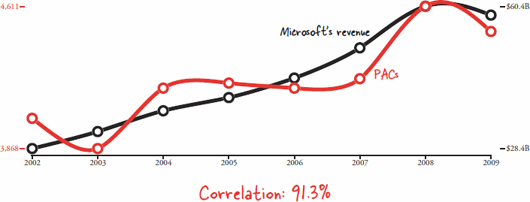
In 2012, an estimated $2.6 billion was spent on influencing the presidential election. This would have been enough money to produce another thousand episodes of The West Wing.
SOURCES:
Microsoft Investor Relations, Earnings Releases 2002–2009
U.S. Federal Election Commission, Press Release, May 2009
Entertainment Weekly, “The Lowe Down” (2002)
Aggregate worldwide income of oil companies
vs.
Travel books published

Of the companies in the world with the highest revenue, the only one in the top five that isn’t an oil company is Walmart.
SOURCES:
Carl H. Pforzheimer & Co., New York, NY, Comparative Oil Company Statements
Bowker, New Book Titles and Editions