CHAPTER 13
Manage Site Usage
In the previous chapter, we discussed all site designing and enhancements in SharePoint Online. In this chapter, we will discuss SharePoint site usage and analytics. All activities happening in sites are recorded by SharePoint, which we can analyze to manage the site better with improved performance. Activities like several users visiting the site, several times site are visited, traffic of site at a specified period, popular platforms in site traffic, users accessing content, most viewed content, contents shared with external users, modification of content, deletion of content, and so on, are stores which we can analyze and can act on it for better management and improved performance.
Structure
In this chapter, we will discuss the following topics:
- Site Usage
- File Activity Report
- Site Usage Report
- Site Activity Webpart
- Traditional Audit log report
- Storage Metrics
Objective
During the end of the chapter, you will get a clear understanding of the following:
- How to monitor activities under site usage
- Analyze file activity report
- Analyze site usage report
- Analyze using site activity webpart
- Understand traditional audit log report
- Analyze storage metrics
Site Usage
We can check the usage of the site, which contains information related to unique viewers, site visits, site traffic, popular platforms, most unique viewers, most viewed, shared with external users. Let’s perform the following steps to check site usage:
- Navigate to Site Contents (
<_layouts/15/viewlsts.aspx>) present on site. - You will find an option Site usage under command bar or from Site Settings drop-down. Click on Site usage (
https://<site url>/_layouts/15/siteanalytics.aspx) as seen in the following screenshot:
Figure 13.1: Site usage setting
- You will be redirected to the siteanalytics page. The first option under this you will find is Unique viewers that logs information regarding the total number of users visited the site to date.
- Information is displayed in graphical format. If we hover the mouse over any graph will show the number of users visited for that particular date.
- We can filter the information log in three categories like Last 7 days, last 30 days, last 90 days that holds information about numbers of users visited in last 7 days, 30 days or last 90 days respectively as seen in the following screenshot:

Figure 13.2: Unique viewer and Site visits
- The next option you will find is Site visits that logs information regarding the total number of time sites is visited for a particular date and display in graphical format, as seen in the above screenshot.
- Hover the mouse over any particular date will show several times the site visited for that particular date.
- We can filter this information log into three categories like the Last 7 days, last 30 days, last 90 days similar to option Unique viewers.
- The next option is Site traffic that holds information about the number of users visiting the site at a particular time that helps to analyze the load on-site at every moment so that can manage the performance of the site as seen in the following screenshot.
- This information can be filtered into three categories like Last 7 days, 30 days, 90 days:

Figure 13.3: Site traffic
- The next option is Popular platforms that hold information regarding the devices used for accessing the site from which we can analyze traffic is from which type of platform, whether desktop, mobile web, mobile app, tablet, or any other device. This information can be filtered in three categories like Last 7 days, 30 days, 90 days as seen in the following screenshot:

Figure 13.4: Popular platforms
- Next option Most unique viewers that hold information like which content is accessed by how many numbers of viewers for the past 7 days.
- Option Most viewed contains information like which content got how many views and displays most viewed content for past 7 days as seen in the following screenshot:
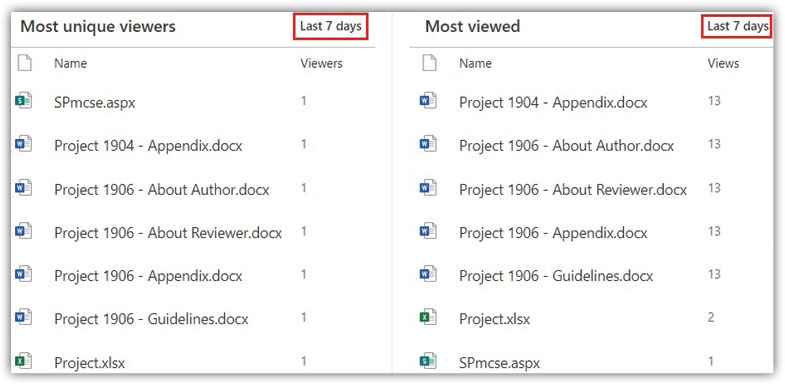
Figure 13.5: Unique viewers and Most viewed
- Another option you will find is Shared with external users that contains information regarding the contents shared with external users.
- We can generate a report by clicking the option Run report, select one library as a storage location for the report, then click in Run report as seen in the following screenshot:

Figure 13.6: Shared with external users
- There is no item I have shared outside of the organization, so there is no item in the screenshot above. But you can share with the external user and generate it. When you generate a report, it contains information like Resource Path, Item Type, Permission, User Name, User E-mail, User or Group Type, Link ID, Link Type, AccessViaLinkID.
File Activity Report
On the SharePoint admin center home page, we can now see the reports related to activity on file (File Activity Report) and site (Site Usage Report). The first report we will see in graphical format is the file activity report. You will find an option Details at the top right to that graph. Click on Details, as seen in the following screenshot. Let’s perform the following steps to check the SharePoint file activity report:

Figure 13.7: Activity report and usage report
- You will be redirected to the activity page. You will notice the activity reports in the graph can be filtered based on Files, Pages, Users.
- Category Files is chosen first. The graph shows the number of files viewed or edited, the number of files shared internally or externally. Click on the option Export present at the right sight of the graph; you will find a report containing details like Report refresh date, Viewed or edited, Synced, Shared internally, Shared externally, Report date, Report period.
- Below the graph, you will find a Details table. There is an option Export at the right sight of that table, clicking on that will generate a report containing details like Report refresh date, User principal name, Is deleted, Deleted date, Last activity date, Viewed or edited file count, Synced file count, Shared internally file count, Shared externally file count, Visited page count, Assigned products, Report period:

Figure 13.8: Site Activity Report
- The next category type under site activity is Pages. The graph shows the number of pages visited for a particular date.
- If you export the report from Details table you will find the columns in the report as Report refresh date, Visited page count, Report date, Report period:

Figure 13.9: Site Activity Report Category Pages
- The next category type under site activity is Users. If you export the report from Details table you will find the columns in the report as Report refresh date, Visited a page, Viewed or edited, Synced, Shared internally, Shared externally, Report date, Report period:
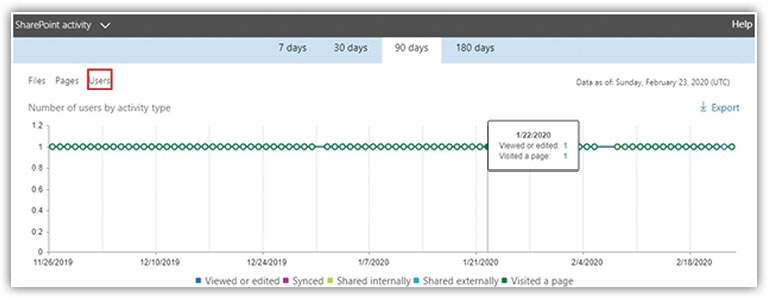
Figure 13.10: Site Activity Reports Category Users
- Click any one of the fields as shown in the image below, you will find options like Sort ascending, Sort descending, Columns, Filter. If you click on the Columns, you see all columns. Which of the columns selected those field details will be displayed in the table:

Figure 13.11: Filtering and Displaying Columns
Site Usage Report
The second report we will see in graphical format, on the SharePoint admin center home page, is file activity report, which contains activity details for Sites, Files, Storage, Pages. Let’s perform the following steps to check the Site Usage report:
- You will find an option Details at the top right to that graph. Click on Details.
- You will be redirected to the SharePoint site usage page. You will notice site usage reports in a graph can be filtered based on Sites, Files, Storage, Pages.
- Category Sites is chosen first. The graph shows total sites and active sites trend, as shown in the below screenshot Figure 13.12.
- Click on the option Export present at the right sight of the graph; you will find a report containing details like Report refresh date, Site type, Total sites, Active sites, Report date, Report period.
- Below the graph, you will find a Details table. There is an option Export at the right sight of that table, clicking on that will generate a report containing details like Report refresh date, Site Id, Site URL, Owner display name, Is deleted, Last activity date, File count, Active file count, Page view count, Visited page count, Storage used (Byte), Storage allocated (Byte), Root web template, Site owner principal Name, Report period:

Figure 13.12: Site usage category Sites
- The next category type under site usage is Files. The graph shows total files and active files trend for a particular date, as seen in the following screenshot.
- If you export the report from Details table, you will find the columns in the report as Report refresh date, Site type, Total, Active, Report date, Report period:
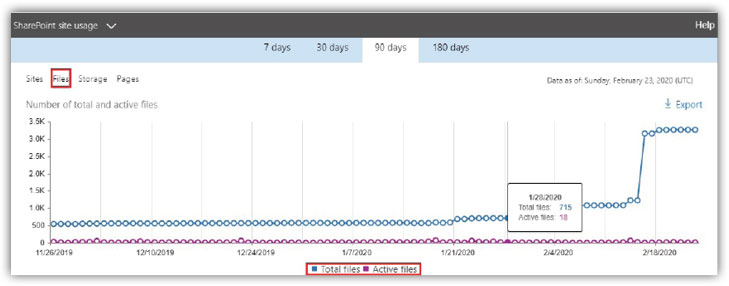
Figure 13.13: Site usage report category Files
- The next category type under site usage is Storage. The graph shows the total storage occupied trend for a particular date, as seen in the following screenshot.
- If you export the report from Details table you will find the columns in the report as Report Refresh Date, Site Type, Storage Used (Byte), Report Date, Report Period:

Figure 13.14: Site usage report category Storage
- The next category type under site usage is Pages. The graph shows total page views trend per particular date, as seen in the following screenshot.
- If you export the report from Details table you will find the columns in the report as Report refresh date, Site type, Page view count, Report date, Report period:
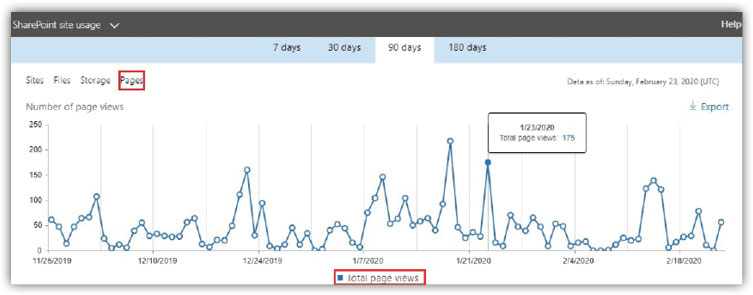
Figure 13.15: Site usage report category Pages
- Click any one of the fields as shown in the image below, you will find options like Sort ascending, Sort descending, Columns, Filter. If you click on the Columns, you see all columns. Which of the columns selected those field details will be displayed in the table.
- Click on the option Filter will show different conditions of filtering which we can apply to show data in the Details tab as seen in the following screenshot:

Figure 13.16: Filtering and Columns
- Click on all columns will show all details related to site usage, as seen in the following screenshot, which can be analyzed to manage your site better with improved performance:

Figure 13.17: Details table
Site Activity Webpart
We can audit the activity of site contents by adding one webpart on the site. Modern SharePoint provides a webpart called Site activity, as seen in the following screenshot below, that captures all activities on-site content like contents uploaded, modified, viewed, creation of libraries or lists, and so on:

Figure 13.18: Site activity webpart
We can see recent activities like files edited, viewed, site pages viewed in the below images. So, this webpart pulls all activities automatically and display here to end-users as seen in the following screenshot:
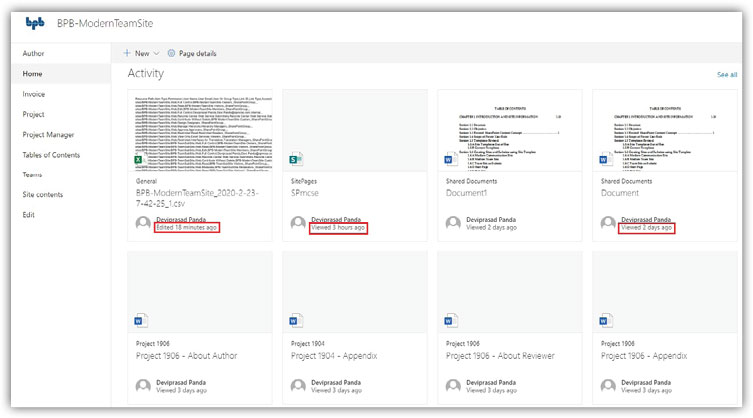
Figure 13.19: Activity details
Traditional Audit log reports
In the old way of checking logs from each site, settings are gradually going to be out of use. The new way of checking audit details is becoming so friendly and popular. Let’s perform the following steps to check traditional Audit log report:
- Navigate to Site Settings (
<_layouts/15/settings.aspx>). - Click on Site collection audit settings (
https://<site url>/_layouts/15/AuditSettings.aspx) present under Site Collection Administration as seen in the following screenshot:
Figure 13.20: Audit log reports
- We used to see the settings to enable events like Editing items, Checking out or checking in items, Moving or copying items to another location in the site, Deleting or restoring items related to documents and items and Editing content types and columns, Searching site content, Editing users and permissions related to Lists, Libraries, and Sites as seen in the following screenshot:

Figure 13.21: Traditional Audit Log Settings
- SharePoint Online, you will see these settings are going to be out of support and no such setting available to enable as seen in the following screenshot:
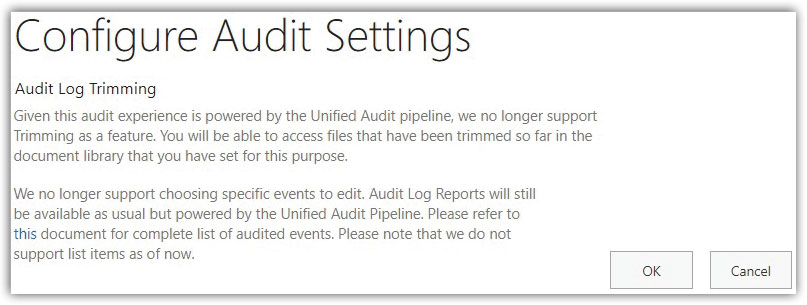
Figure 13.22: Audit Log Trimming
- Next, if you click on Audit Log Reports (
https://<site url>/_layouts/15/Reporting.aspx?Category=Auditing) present under Site Collection Administration, you will see reports Content viewing, Content modifications, Deletion, Content type and list modifications under the category Content Activity Reports. Reports like Policy modifications, Expiration and Disposition under category Information Management Policy Reports. Reports Auditing settings, Security settings under category Security And Site Settings Reports. Reports Run a custom report under category Custom Reports to audit as seen in the following screenshot:
Figure 13.23: Audit Log Report
- Click any one of the reports will ask a location to save the report. Select one document library to store reports and run to generate the report for audit.
Storage Metrics
Storage Metrics option captures the site collection storage details like what is the current storage occupied, which site, subsite, list, libraries, and other folders occupying how much storage so that we can plan for storage management for better site performance. Let’s perform the following steps to check storage metrics:
- Navigate to Site Settings (
<_layouts/15/settings.aspx>). - Click on Storage Metrics (
https://<site url>/_layouts/15/storman.aspx) present under Site Collection Administration, as seen in the following screenshot: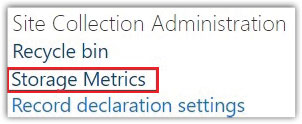
Figure 13.24: Storage Metrics Option Under Site Settings
- You will see the space occupied by the current site; subsites present under that site as seen in the following screenshot:

Figure 13.25: Storage Metrics in details
- If you click any subsite, then it will show a chart of storage occupied by all content types and subsites present under that subsite. So, clicking any of the items will show the storage occupied under those particular items.
Conclusion
In this chapter, we discussed how to check site usages. How to check and analyze different reports like File Activity Report, Site Usage Report. Discussed the use of webpart Site Activity Webpart to capture logs. Discussed traditional Audit Log Report also understood how to check storage metrics for site.
Points to remember
- Traditional Audit log report is going to be out of support, and we need to accept the new and modern way of different auditing activities in SharePoint Online.
- In this chapter, wherever its mentioned like this format
_layouts/15/****.aspx, means this section is added after the site URLhttp:// <site url> /_layouts/15/****.aspx. - Regular changes are applied in Office 365 and SharePoint Online by which there may be changes happening in the template or some other features.