9
Thermal Conductivity of ZrB2 and HfB2
Gregory J. K. Harrington and Greg E. Hilmas
Department of Materials Science and Engineering, Missouri University of Science and Technology, Rolla, MO, USA
9.1 Introduction
ZrB2 and HfB2 are proposed for use in hypersonic vehicles and reentry spacecraft where they will be used as thermal management materials for extreme thermal environments. These applications typically include sharp control surfaces (leading/trailing edges) as well as scramjet engine components [1–5]. Hypersonic control surfaces need thermal conductivities (k) that are as high as possible to conduct heat generated from atmospheric friction through the material so that it can be dissipated elsewhere [1, 3]. In addition, higher k values increase thermal shock resistance in high heat flux situations. Because engine components cannot radiate to the atmosphere, lower k refractory materials could be beneficial, depending on the cooling capabilities of the vehicle [3]. From a materials engineering perspective, the effects of processing, composition (intentional additions or from impurities), and the resulting microstructure need to be characterized to design materials with appropriate properties. The goal of this chapter is to review the state-of-the-art with respect to thermal conductivity for single-phase and composite ZrB2 and HfB2 ceramics.
9.2 Conductivity of ZrB2 and HfB2
9.2.1 Pure ZrB2
Few nominally phase-pure ZrB2 materials (referred to hereafter as “pure ZrB2”) have been produced for measurement of k. As summarized in Table 9.1, k has been reported for fewer than 25 materials starting with the work by Sindeband et al. [6] in 1950, up through the publication of this chapter. This is likely due to the difficulty of densifying ZrB2 without sintering aids and the frequency with which second phases are added to ZrB2 to improve strength, fracture toughness, resistance to oxidation, and thermal shock performance. From this point on, reports before 1980 are referred to as “historic” while anything after is considered “current.” Most studies have evaluated k indirectly using the bulk density (ρ), thermal diffusivity (D), and the constant pressure heat capacity (Cp), along with Equation 9.1 [8, 10–18, 20–23] (Jason Lonergan, Missouri University of Science and Technology, personal communication). However, a few studies have measured k directly using steady-state methods [7–9] or a direct dynamic method [19]. These exceptions have been noted in Table 9.1.
Table 9.1. Thermal conductivity of pure ZrB2 with information on starting/final materials, processing, and density.
| Powder processing | Purity (%) | Densification technique | Special notes(gs in µm) | ρrelative (%) | Thermal conductivity(k, W/m-K) | Ref. | |
| 25 °C | at max temp | ||||||
| Fused-salt electrolysis | — | PS | — | 85 | 24 | — | [6] |
| — | 96.3 | HP | — | 70 | — | 29 at 2200 °C | [7] |
| “Fluid energy milled” | 99.2 | HP | gs = 28.5 µm | 100 | — | 82 at 1000 °C | [8] |
| “Fluid energy milled” | 99.2 | HP | gs = 28.5 µm | 100 | — | 82 at 2000 °C | [8] |
| — | — | HP | — | 100a | — | 133 at 2020 °C | [9] |
| — | 99.1 (final) | HP | gs = 11 µm | 97.4 | — | 92 at 1143 °C | [10] |
| — | — | HP | gs = 13 µm | 100a | — | 84 at 885 °C | [11] |
| “Vibrogrinding” | — | CVD | Pyrolytic | 100a | — | 84 at 2150 °C | [12] |
| “Vibrogrinding” | — | PS 2100 °C | Ni sintering aid | 100a | — | 55 at 2200 °C | [12] |
| — | — | RF FZR | SX—a-direction | 100 | 132-145 | — | [13] |
| — | — | RF FZR | SX—c-direction | 100 | 95-102 | 78-82 at 200 °C | [13] |
| BM w/ZrO2 | 99.5 | HP at 2000 °C | gs = 5 µm | 75 | — | 43 at 2000 °C | [14] |
| AM w/WC | — | HP at 1900 °C | gs = 6 µma | 100 | 56 | 67 at 1325 °C | [15] |
| BM w/SiC | 98 | SPS at 1900 °C | gs = 3.0 µm | 95.6 | 113 | — | [16] |
| BM ZrH2 + B w/SiC | 99 ZrH2, 95.9 B | rxn SPS at 1800 °C | gs = 5.35 µm | 97 | 133 | — | [17] |
| HM Zr + B | 99.7 Zr, 99 B | rxn SPS | gs = 5.6 µm | 92.5 | — | 92 at 435 °C | [18] |
| BM w/ZrO2 | — | SPS at 2000 °C | gs = 6–11 µm | 95 | 50 | — | [19] |
| AM w/WC | — | HP at 1900 °C | gs = 3.3 µm | 100 | — | 59 at 2000 °C | [21] |
| BM w/ZrB2 | — | HP 2100 °C | gs = 22 µm | 97 | 93 | 97 at 2000 °C | [20] |
| BM w/ZrB2 | 98.7 | HP at 2150 °C | gs = 25, 0.2 wt%C sintering aid | 100a | 99 | 75 at 2100 °C | [22] |
| BM ZrH2 + B w/ZrB2 | 99.7 ZrH2, >99 B | HP at 1900 °C | gs = 5.5 µm | 100a | 107 | 66 at 2000 °C | (Jason Lonergan, Missouri University of Science and Technology, personal communication) |
| BM w/ZrB2 | 98.7 | HP at 2150 °C | gs = 21, 0.5 wt%C sintering aid | 100a | 89 | 87 at 200 °C | [23] |
AM, attrition milling; BM, ball milling; HM, hand milling; HP, hot pressing; PS, pressureless sintering; RF FZR, radio frequency float zone refinement; SPS, spark plasma sintering; gs, grain size.
adensity has been corrected to 100% by author.
For studies utilizing Equation 9.1, D was evaluated by dynamic methods including xenon flash [16, 17], laser flash [8, 10, 13–15, 20–23] (Jason Lonergan, Missouri University of Science and Technology, personal communication), or a plane temperature wave approach [12, 18]. Overall, D is the most important parameter for calculating k. Compared to Cp and ρ, D is the property that is most affected by changes in grain size and purity. In some cases, Cp values have either been measured by drop calorimetry [8], DSC [14, 15], or one of the flash techniques [13, 16, 17]. More likely, Cp values have been taken from thermochemical tables [10, 12, 18, 20–23] (Jason Lonergan, Missouri University of Science and Technology, personal communication), historic literature by either Schick [24] or Bolgar et al. [25], or sources such as the NIST-JANAF [26] tables or HSC chemistry [28] (HSC primarily derives its ZrB2 equations from the NIST-JANAF). Figure 9.1 shows Cp for ZrB2 as a function of temperature from several of studies [8, 14–17] as well as the thermochemical tables [24, 26–28].
Figure 9.1. Thermochemical and experimental heat capacity (Cp) values for ZrB2 [8, 14–17, 24, 26, 27].
Figure 9.1 shows obvious discrepancies among reported values. Despite divergence at higher temperatures, data from Schick et al., the NIST-JANAF tables, HSC, and a more recent DSC data by Zimmermann et al. [15] appear to agree between room temperature (RT) and approximately 200°C (430–550 J/kg-K). In contrast, room-temperature values reported by Guo et al. [17] and Ikegami et al. [16], which were both obtained by a comparison method using xenon flash, are approximately 20 and approximately 29% higher, respectively. The cause of the discrepancies in the Cp values is unclear, but it goes without saying that reliable Cp values are of utmost importance when calculating k. Finally, density is almost always evaluated using the Archimedes method. For cases in which density values are corrected for the effects of thermal expansion, tabulated data [20–23] (Jason Lonergan, Missouri University of Science and Technology, personal communication) or experimental dilatometry results [7, 8, 10, 13–15, 22] were used.
Most studies have used some type of milling procedure for particle size reduction, to mix the starting components, or to blend-in sintering aids. Contamination from milling media is common and may affect the properties of the densified ceramics. Only the modern reports provide much detail on the types of media used, with WC [15, 20], SiC [16, 17], ZrO2 [14, 19], and ZrB2 [21–23] (Jason Lonergan, Missouri University of Science and Technology, personal communication) being the most common media types. Pressure-assisted densification techniques such as hot pressing (HP) or spark plasma sintering (SPS; also known as field-assisted sintering (FAST) or pulsed electric current sintering (PECS)) were most often employed for the densification of ZrB2 [7–11, 14–23] (Jason Lonergan, Missouri University of Science and Technology, personal communication), but pressureless sintering (PS) [6, 12], chemical vapor deposition [12], and float zone refinement [13] have also been utilized. From these densification techniques, researchers were often successful at producing greater than or equal to 95% dense ceramics with several achieving full density. Figures 9.2 and 9.3 summarize thermal conductivity data from historic and current literature. All data have been presented “as published” unless otherwise noted in the figures.
Figure 9.2. Historic thermal conductivity as a function of temperature for ZrB2. Data for Clougherty changed testing method at 1000°C [6–12].
Figure 9.3. Current thermal conductivity as a function of temperature values for ZrB2. aData corrected for ρ. bData corrected for Cp [13–18, 20–23] (Jason Lonergan, Missouri University of Science and Technology, personal communication).
9.2.1.1 Historic ZrB2.
Historically, ceramics with the lowest thermal conductivities were produced by Sindeband et al. (~25 W/m-K) [6] and Neel et al. (20–46 W/m-K) [7], likely due to low relative densities, which were 85 and 70%, respectively. The effect of density is especially evident at elevated temperatures where k begins to rise as temperature increases, presumably due to photon heat transport across pores. Despite the low density of these ceramics, research by Neel et al. was significant in that ZrB2 was tested up to 2200°C, which has since only been equaled by Fridlender et al. [12]. In addition to high testing temperatures, Neel et al., along with Samsonov et al. [9] and Clougherty et al. [8], are the only researchers to perform direct steady-state measurements of thermal conductivity for any ZrB2-based materials.
Other historic k values for ZrB2 were obtained for ceramics that were >97% dense [10], fully dense [8], or had thermal conductivities corrected for porosity [9, 11, 12]. No clear trend in thermal conductivity as a function of temperature emerges as k increases for some and decreases for others as temperature increases. The k values also vary widely, from as low as approximately 35 W/m-K at 200°C to approximately 80 W/m-K at 2000°C. Both ZrB2 and HfB2 should exhibit k values that decrease with increasing temperature because they behave similar to metals whereby heat is transferred by phonons and electrons, both of which scatter more at elevated temperatures due to increased thermal vibrations. Based on this, and in comparison to the other historic literature values in Figure 9.2, values reported by Samsonov et al. are likely not representative of ZrB2 as k steadily increases from approximately 60 W/m-K at 1000°C to approximately 130 W/m-K at 2000°C.
Andrievskii et al. [11] also reported k values that increased with temperature, which was not explained. In contrast, Fridlender reported the addition of 1 wt% carbonyl nickel for densification of “sintered” ZrB2. The presence of Ni most likely caused the relatively low k values (50–54 W/m-K) and increasing k with temperature. Fridlender et al. also investigated pyrolytic ZrB2 produced by chemical vapor deposition (CVD) that led to a “columnar microstructure with semicoherent crystallite boundaries.” No overall temperature trend was apparent for k, but the higher conductivity (84–93 W/m-K) compared to sintered material was attributed to decreased phonon scattering from more coherent grain boundaries [12].
Finally, ZrB2 produced by Branscomb and Hunter [10] and Clougherty et al.1 [8] had the highest k values of the historic ceramics and had k values that decreased with temperature. This behavior is consistent with high relative density and purity. Further, Branscomb and Hunter reported the highest k at low temperature (105 W/m-K at 200°C) and the highest conductivity above 1000°C (~91 W/m-K at 1143°C, excluding Fridlender's pyrolytic ZrB2). Branscomb and Hunter analyzed the metallic impurity content and found their ceramic to be approximately 99.1 at% pure with the largest impurities being Fe (0.7 at%), Si (0.07 at%), and Nb (0.05 at%) with other impurities <0.02 at% [10]. However, the analysis did not include Hf (common impurity in Zr), C (typically introduced during processing), or O (from native oxide layers), which were likely also present. Despite this, their ZrB2 was one of the purest historic ceramics resulting in its high k.
9.2.1.2 Current ZrB2
Current studies summarized in Figure 9.3 are similar to historic studies (Fig. 9.2) as a large range of values have been reported. However, values are consistent with the main factors (i.e., density, purity, and grain size) that control k.
Thermal conductivity at the highest temperatures measured for current ZrB2 ceramics [15, 20–22] (Jason Lonergan, Missouri University of Science and Technology, personal communication) ranged from 43 W/m-K [14] to 75 W/m-K [22]. Room-temperature k values are all >85 W/m-K [13, 16–18, 21–23] (Jason Lonergan, Missouri University of Science and Technology, personal communication) with one exception at 56 W/m-K [15]. Despite the range of k values for ZrB2, consensus has not been reached on the intrinsic k of ZrB2.
To investigate ZrB2 as a lattice-matched substrate for GaN, Kinoshita et al. produced single-crystal (SX) ZrB2 by float zone refinement (Table 9.1). ZrB2 is hexagonal and has an anisotropic k. Measurements ranged from 132–145 W/m-K parallel to the a-axis to 95–102 W/m-K parallel to the c-axis (Fig. 9.3) [13]. Differences can be explained by different phonon and electron scattering behavior for different directions. Phonon scattering increases as the ratio of atomic masses increases between constituent elements [29]. Therefore, phonon conduction will be highest for the direction with B–B and Zr–Zr bonds, which is the basal plane. In addition, the electron contribution to k is higher along the basal plane due to electrical conduction in the close-packed planes of Zr atoms [30].
The SX values reported by Kinoshita et al. provided insight into the theoretical limits for k of ZrB2 ceramics. Equations 9.2 and 9.3 have been used to estimate the arithmetic-mean (kAM, upper bounds) and harmonic-mean (kHM, lower bounds) polycrystalline thermal conductivities from SX values [31, 32]:
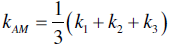
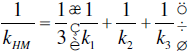
Using values from Kinoshita, the theoretical k for ZrB2 is between 117 and 131 W/m-K. These values do not account for grain boundary resistances, which are influenced by both grain size and impurities, and would likely decrease thermal conductivity. Therefore, the predicted k values should be upper limits for polycrystalline ZrB2 ceramics.
The k of one material from Figure 9.3 has a value within the SX bounds [17], while three others are within 10 W/m-K of the lower limit [16, 18] (Jason Lonergan, Missouri University of Science and Technology, personal communication). To more thoroughly compare these materials, corrections for heat capacity and density have been applied in the present analysis. The Cp values were corrected because of the uncharacteristically high values reported by Guo et al. [17] and Ikegami et al. [16], and for the low relative densities (97.2% [17], 95.6% [16], and 92.5% [18]), which were corrected using the Maxwell–Eucken relation [33, 34]. The modified Cp values decreased k considerably, while accounting for porosity in the ceramic produced by Zhang et al. [18] increased k to 125 W/m-K at 50°C. These corrections left Zhang's as the only material with a k value that fell in the theoretical range, which makes it the best representation of the intrinsic k of polycrystalline ZrB2.
The three highest k materials from the corrected values (after Cp and ρ corrections) were all reaction processed [17] (Jason Lonergan, Missouri University of Science and Technology, personal communication). All other current ZrB2 was produced from commercial ZrB2 powder. An obvious division in room-temperature k values occurs at approximately 67 W/m-K. Above this value, the reported k values decrease as temperature increases [18, 21–23] (Jason Lonergan, Missouri University of Science and Technology, personal communication). Besides the material by Loehman et al., which may be anomalous due to its low density (75%) [14], the two other materials below 67 W/m-K exhibited an increase in k with temperature [15, 20]. These ceramics contained WC impurities from milling and, in both cases the authors indicated that W from the media was a likely cause for the slope and low k values. Despite the differences in room-temperature k and the change in k with temperature [21, 22] (Jason Lonergan, Missouri University of Science and Technology, personal communication), the k values converge to a narrow range (within ~10 W/m-K) above 1300°C. This indicates that factors resulting in large changes in the k at lower temperatures may give way to a common mechanism that controls k at elevated temperatures.
Purity may be the most significant factor affecting k for current ZrB2 ceramics. Conductivities for fully dense ZrB2 [15, 21], or values for porous ceramics corrected to full density [22, 23] (Jason Lonergan, Missouri University of Science and Technology, personal communication), span a significant range of k values (more than 50 W/m-K) and appear to be independent of grain size. Grain sizes can be divided into two separate ranges, fine with average grain sizes below 10 µm [14–18, 20] (Jason Lonergan, Missouri University of Science and Technology, personal communication) or coarse with average grain sizes over 20 µm [21–23]. Fine grains can result in either high k (>107 W/m-K at 25°C) for reaction processed ZrB2 [17, 18] (Jason Lonergan, Missouri University of Science and Technology, personal communication) or low k (<57 W/m-K at 25°C) for conventionally processed ZrB2 ceramics [15, 20]. Thermal conductivities for coarse-grained materials all fall between those values [21–23]. Therefore, the difference apparent in Figure 9.3 is not significantly affected by grain size. Differences in purity, which are reported much less often, are, therefore, the most likely explanation for the observed variations. Unfortunately, none of the current studies report chemical analysis of the final ceramics, although assays of starting powders are typically provided [14, 16–18, 22, 23] (Jason Lonergan, Missouri University of Science and Technology, personal communication). As a result, analysis of the effect of purity is difficult. However, some studies have systematically evaluated the effects of solid solution (SS) additions of various species as discussed in the next section.
9.2.2 ZrB2 with Solid Solution Additions
Thermal conductivities from three studies evaluating the effects of SS additions to ZrB2 [21–23] are summarized in Table 9.2 and plotted in Figure 9.4. Values for reaction hot-pressed ZrB2 ceramics reported by Zhang et al. [18] are included for comparison. These studies were self-consistent since similar processing was used for pure, baseline ZrB2 ceramics and those with subsequent SS additions. However, if SS additions [21, 23] were compared to the corrected data for reaction-processed ZrB2 [18] instead of the baseline material produced in each study, the effects could be misleading.
Table 9.2. Summary of solid solution effects on thermal conductivity of ZrB2
| Material (vol% or otherwise stated) | Powder processing | Densification technique | Special notes | Relative density (%) | Thermal conductivity (k, W/m-K) | Ref. | |
| 25 °C | at max temp | ||||||
| ZrB2 + 2.8 mol%NbB2 | BM w/ZrB2 | HP at 2150 °C | gs = 7 µm, 0.5 wt%C sintering aid | 100 | 74 | 76 at 200 °C | [23] |
| ZrB2 + 3.1 mol%W2B5 | BM w/ZrB2 | HP at 2150 °C | gs = 18 µm, 0.5 wt%C sintering aid | 100a | 35 | 40 at 200 °C | [23] |
| ZrB2 + 10%TiB2 | BM w/ZrB2 | HP at 2100 °C | gs = 10 µm | 100a | 81 | 72 at 2000 °C | [21] |
| ZrB2 + 50%TiB2 | BM w/ZrB2 | HP at 2100 °C | gs = 7 µm | 100a | 58 | 65 at 1900 °C | [21] |
aCorrected to 100% in this work.
Figure 9.4. Thermal conductivity as a function of temperature for ZrB2 with solid solution additions. aData corrected for ρ [18, 21–23].
SS additions decrease the k values of ZrB2 ceramics from the respective baselines, especially at room temperature. The trend in k as a function of temperature depends on both the type and amount of additive. For example, Thompson et al. showed that an SS addition of 10 vol% TiB2 reduced k resulting in an almost linear trend with temperature. In contrast, the addition of 50 vol% TiB2 resulted in a decrease in k of approximately 23 W/m-K at 25°C compared to the addition of 10 vol% TiB2 [21]. Both Thompson et al. [20] and McClane et al. [23] found that smaller additions of TiB2 (data by McClane not shown in Figure 9.4) had a minimal effect on k. In contrast, other transition metal additions such as W or Nb evaluated by McClane had a much larger effect at the same concentration [23]. McClane confirmed that SS additions of tungsten in ZrB2 decreased k significantly (~53 W/m-K drop at 25°C for 3.1 mol% W). Evaluation of k for different SS additions was also shown to correlate to changes in lattice parameters [23].
9.2.3 Pure HfB2
Research on k of HfB2 is summarized in Table 9.3. Reports of k for HfB2 are more scarce than those of ZrB2, likely due to the higher cost and density (11.21 g/cm3 [38] vs. 6.12 g/cm3 [39]) of Hf, which may make it less attractive for aerospace applications. The k values of HfB2, like ZrB2, were typically calculated from D, ρ, and Cp using Equation 9.1 [10, 14, 18, 35, 37], but some direct measurements have been reported [9, 36]. Also similar to ZrB2, Cp was either evaluated experimentally [14, 35], taken from thermochemical tables (Schick [24]) [10], or an electronic database (HSC [27]) [18, 37] and these values are plotted as a function of temperature in Figure 9.5. The tabulated data by Schick and values obtained from HSC are nearly identical, but Cp values used by Loehman et al. [14] and Gosset et al. [35] were lower and may have led to lower k values compared to studies using typical values.
Table 9.3. Thermal conductivity of pure HfB2 with information on starting/final materials, processing, and density
| Powder processing | Purity (%) | Densification technique | Special notes | Relativedensity (%) | Thermal conductivity(k, W/m-K) | Ref. | |
| 25 °C | at max temp | ||||||
| — | — | HP | — | 100a | — | 144 at 2000 °C | [9] |
| — | 98.2 | HP | gs = 15 µm | 95.2 | — | 74 at 1200 °C | [10] |
| — | 99.5 | HP at 2000 °C | — | 95 | 72 | — | [35] |
| — | — | HP at 2160 °C | — | 95 | 104 | 72 at 820 °C | [36] |
| BM w/ZrO2 | 99.5 ZrB2 | HP at 2000 °C | — | 69 | — | 31 at 2000 °C | [14] |
| HM Hf + B | 99.8 Hf, 99 B | rxn SPS | gs = 4.0 µm | 95.4 | 107 | 91 at 600 °C | [37] |
| HM Hf + B | 99.8 Hf, 99 B | rxn SPS | gs = 10.7 µm | 98.1 | — | 101 at 420 °C | [18] |
| HM Hf + 1.9B | 99.8 Hf, 99 B | rxn SPS | Zr rich, gs = 10 µm | 98.1 | — | 97 at 430 °C | [18] |
| HM Hf + 2.1B | 99.8 Hf, 99 B | rxn SPS | B rich, gs = 10.9 µm | 101 | — | 110 at 420 °C | [18] |
aCorrected to 100% in this work.
Figure 9.5. Heat capacity as a function of temperature for HfB2 [24, 27, 35].
Of the studies reporting powder-processing methods, hand mixing (HM) was most common [18, 37], while one study used ZrO2 media and ball milling [14]. The two studies utilizing HM also performed reaction processing using SPS to produce HfB2 from Hf and B. All other HfB2 studies used commercial HfB2 powder and densification by hot pressing [9, 14, 35, 36] or evaluated commercially sintered material [10]. Aside from HfB2 studied by Loehman et al. [14], which had a relative density of 69%, all other reports used HfB2 that was greater than or equal to 95% relative density.
The k values presented in Table 9.3 are plotted in Figure 9.6. Similarities are apparent between trends discussed for ZrB2 and HfB2. First, both display a wide variation in k values across the temperature range. Second, k should decrease with increasing temperature, porosity, and impurity content.
Figure 9.6. Thermal conductivity as a function of temperature for historic and current HfB2. aData corrected for ρ [9, 10, 14, 18, 37, 39, 40].
The k values for HfB2 reported by Samsonov et al. [9] increase with increasing temperature from 1000 to 2000°C, as did ZrB2 reported in the same study. Again, this trend does not fit with other reports. As mentioned previously, Loehman et al. reported k for highly porous HfB2, resulting in low values (37–31 W/m-K from 250–2000°C) [14]. Branscomb and Hunter [10] reported the only other historic HfB2, which had a slightly negative slope of k with temperature (78 W/m-K at 200°C to 74 W/m-K at 1200°C), but k was lower compared to HfB2 produced by Zhang et al. [18] and Gasch et al. [37] due to lower purity (98.2%) and density (95.2%).
Like the highest k for polycrystalline ZrB2, the highest k for HfB2 was also a result of high purity starting materials (i.e., 99.8% Hf and 99% B) [18, 37]. Zhang et al. also produced nonstoichiometric compositions of HfB1.9 and HfB2.1, but only HfB2.1, was fully dense. To better evaluate these k values, and estimate a theoretical maximum k for HfB2, reported values were adjusted for ρ (hollow shapes in Fig. 9.6). The two stoichiometric compositions had similar k values of approximately 114 W/m-K at the lowest temperatures (30–50°C). The values steadily decreased to approximately 103 W/m-K at 400°C. The similarities were likely due to the nearly identical processing procedures (i.e., HM of the constituents and densification via SPS). Unless higher purity starting materials were used, the compositions by Gasch et al. and by Zhang et al. are likely the best representation of the intrinsic k for polycrystalline HfB2.
Interestingly, the change in stoichiometry studied by Zhang et al. had a significant effect on k. The k for the boron-rich composition was approximately 6% higher than the stoichiometric composition. In contrast, the boron deficient material had k values that were approximately 6% lower. No explanation was provided for the reported differences, but both the electron and phonon contributions to k were higher for HfB2.1 [18].
9.2.4 Conclusions Regarding Phase-Pure ZrB2 and HfB2
The k values for nominally pure ZrB2 and HfB2 were affected more strongly by purity than grain size or porosity. Porosity decreased k; however, as these materials are mainly intended for use as structural ceramics, densities are typically maximized. Grain size had little effect on k for ZrB2 as either higher or lower k materials were produced with fine grain sizes, with larger-grained material bridging the gap in conductivity. As these materials are all single phase, changes in purity were due to elements in SS. Reaction processing from pure elemental constituents (>99.7% metals, 99% B) has been used to produce the highest conductivity polycrystalline ZrB2 and HfB2. Comparisons with single-crystal ZrB2 values (117–131 W/m-K after averaging a- and c-axis values) revealed that the k for ZrB2 produced by reactive SPS were in good agreement with values predicted from single-crystal values, which may indicate that grain boundary resistances for ZrB2 are low.
Due to their proposed use temperatures, many studies report k values up to 2000°C. In contrast, SX ZrB2 was only evaluated to 200°C. Evaluation up to 2000°C would have been very valuable. Research on transition metal additions indicated the effect of SSs on k. Depending on the element (i.e., W has a much larger effect than Ti) and concentration, the k values of ZrB2 (and HfB2 by corollary) can change significantly. With SS additions, k drops more dramatically at room temperature compared to higher temperatures. This results in a change in slope in k versus T from negative to positive. The observed changes in k are most likely tied to changes in bonding and distortions in the lattice as they have been shown to correlate to shifts in measured lattice parameters.
9.3 ZrB2 and HfB2 Composites
9.3.1 Thermal Conductivity of ZrB2 Composites
Researchers have used additions of secondary, tertiary, and quaternary phases to improve densification and important properties (i.e., strength, thermal shock resistance, and oxidation performance) of ZrB2 ceramics. Along with these possible improvements, the transport properties also influence the thermal management performance and further contribute to thermal shock behavior. Therefore, the k of the final ceramic is important in its own right and has been studied to understand the effects of additives. Table 9.4 (ZrB2–SiC), Table 9.5 (other second-phase additions), and Table 9.6 (tertiary and quaternary phases) summarize the ZrB2 composites that have been evaluated.
Table 9.4. Thermal conductivity of ZrB2-SiC with information on starting/final materials, processing, and density
| SiC vol% | Powder processing | Purity (%) | Densification technique | Special notes(gs in µm) | ρrelative | Thermal conductivity (k, W/m-K) | Ref. | |
| 25 °C | at max temp | |||||||
| 20% | VM w/plastic | — | HP | — | 100% | — | 78 at 1000 °C | [8] |
| 20% | VM w/plastic | — | HP | — | 100% | — | 69 at 2000 °C | [8] |
| 10% | BM w/SiC | 98.0 ZrB2, 99.0 SiC | SPS at 1900 °C | gsZrB2 = 3.5, gsSiC = 8.9 | 99.4% | 130 | — | [16] |
| 20% | BM w/SiC | 98.0 ZrB2, 99.0 SiC | SPS at 1900 °C | gsZrB2 = 3.4, gsSiC = 8.9 | 99.6% | 131 | — | [16] |
| 30% | BM w/SiC | 98.0 ZrB2, 99.0 SiC | SPS at 1900 °C | gsZrB2 = 3.2, gsSiC = 8.9 | 99.6% | 138 | — | [16] |
| 5% | AM w/SiC | 99.5 ZrB2, 99.9 SiC | HP at 2000 °C | gsZrB2 = 2, gsSiC = 8 | 101% | — | 82 at 2000 °C | [14] |
| 10% | AM w/SiC | 99.5 ZrB2, 99.9 SiC | HP at 2000 °C | gsZrB2 = 1, gsSiC = 4 | 101% | — | 80 at 2000 °C | [14] |
| 20% | AM w/SiC | 99.5 ZrB2, 99.9 SiC | HP at 2000 °C | gsZrB2 = 3, gsSiC = 4 | 100% | — | 67 at 2000 °C | [14] |
| 20% | BM w/WC | >99.5 | HP at 2000 °C | — | >98% | 90 | 72 at 1200 °C | [41] |
| 20% | PBM w/Si3N4 | — | HP at 1900 °C | — | ? | 95 | 76 at 400 °C | [42] |
| 14% | Coarse mixing | 99.5 ZrB2, 99 SiC | Arc melting | Eutectic structure | 100% | 95 | 83 at 750 °C | [43] |
| 31% | Coarse mixing | 99.5 ZrB2, 99 SiC | Arc melting | Eutectic structure | 100% | 77 | 64 at 770 °C | [43] |
| 50% | Coarse mixing | 99.5 ZrB2, 99 SiC | Arc melting | Eutectic structure | 100% | 72 | 44 at 760 °C | [43] |
| 20% | BM w/SiC | — | HP at 1900 °C | — | 98.8% | 68 | 56 at 1000 °C | [40] |
| 20% | PBM w/WC | 99.5 ZrB2, 99.8 SiC | SPS | — | 99.3% | — | 79 at 420 °C | [18] |
| 10% | BM w/ZrO2 | 99 ZrB2, 99 SiCw | HP at 1800 °C | gs = 4.5, SiC whiskers | 98% | — | 61 at 1800 °C | [44] |
| 20% | BM w/ZrO2 | 99 ZrB2, 99 SiCw | HP at 1800 °C | gs = 4, SiC whiskers | 98% | — | 61 at 1800 °C | [44] |
| 30% | BM w/ZrO2 | 99 ZrB2, 99 SiCw | HP at 1800 °C | gs = 4, SiC whiskers | 96% | — | 58 at 1800 °C | [44] |
| 20% | BM w/SiC | >96 ZrB2, >99 SiC | PS at 2100 °C | gsZrB2 = 10, gsSiC = 8 | 99% | 94 | 62 at 1200 °C | [45] |
| 30% | AM w/WC | — | HP at 1900 °C | — | 100% | 62 | 51 at 1330 °C | [15] |
| 20% | BM w/Si3N4 | 98 ZrB2, 98.5 SiC | HP at 1900 °C | gsZrB2 = 2.7 | >99% | 94 | 77 at 1200 °C | [46] |
| 20% | PBM w/SiC | — | HP at 2000 °C | gsZrB2 = 2.6, gsSiC = 1.3 | 99.8% | 107 | — | [47] |
Table 9.5. Thermal conductivity of two-phase ZrB2-based composites with information on starting/final materials, processing, and density
| Material (vol% or otherwise stated) | Powder processing | Purity (%) | Densification technique | Special notes(gs in µm) | ρrelative (%) | Thermal conductivity(k, W/m-K) | Ref. | |
| 25 °C | at max temp | |||||||
| 26%C | — | — | HP | gsZrB2 = 20 | 100a | — | 75 at 900 °C | [11] |
| 50%C | VM w/plastic | — | HP | — | 100 | — | 64.0 at 1000 °C | [8] |
| 50%C | VM w/plastic | — | HP | — | 100 | — | 64.0 at 2000 °C | [8] |
| 1 wt%C | AM w/WC | — | HP at 1900 °C | gsZrB2 = 2.4 | 100 | — | 53.9 at 2000 °C | [20] |
| 3 wt%C | AM w/WC | — | HP at 1900 °C | gsZrB2 = 1.8 | 100 | — | 63.7 at 2000 °C | [8] |
| 10%MoSi2 | BM w/SiC | — | HP at 1800 °C | — | 100a | 88 | — | [48] |
| 20%MoSi2 | BM w/SiC | — | HP at 1800 °C | — | 100a | 83 | — | [48] |
| 30%MoSi2 | BM w/SiC | — | HP at 1800 °C | — | 100a | 81 | — | [48] |
| 40%MoSi2 | BM w/SiC | — | HP at 1800 °C | — | 100a | 76 | — | [48] |
| 2.3%MoSi2 | BM w/ZrO2 | — | HP at 1900 °C | gsZrB2 = 1–10 | ? | 66 | 74.5 at 1200 °C | [49] |
| 50%ZrC | — | — | HP | gsZrB2 = 10 | 100a | — | 54.3 at 905 °C | [11] |
| 5%ZrC | — | — | HP | gsZrB2 = 27 | 100a | — | 79.3 at 910 °C | [11] |
| 20%ZrC | “Vibrogrinding” | — | PS 2100 °C | gsZrB2 = 5, gsZrC = 6, 1% Ni sintering aid | 100a | — | 76.1 at 2200 °C | [12] |
| 40%ZrC | “Vibrogrinding” | — | PS 2100 °C | gsZrB2 = 3, gsZrC = 4, 1% Ni sintering aid | 100a | — | 55.5 at 2200 °C | [12] |
| 45%ZrC | “Vibrogrinding” | — | PS 2100 °C | gsZrB2 = 1, gsZrC = 3, 1% Ni sintering aid | 100a | — | 53.2 at 2150 °C | [12] |
| 10%ZrSi2 | BM w/SiC | — | PS at 1650 °C | — | 100a | 107 | — | [50] |
| 20%ZrSi2 | BM w/SiC | — | PS at 1650 °C | — | 100a | 97 | — | [50] |
| 30%ZrSi2 | BM w/SiC | — | PS at 1650 °C | — | 100a | 90 | — | [50] |
| 40%ZrSi2 | BM w/SiC | — | PS at 1650 °C | — | 100a | 74 | — | [50] |
VM, vibratory mixing.
a Corrected to 100% in this work.
Table 9.6. Thermal conductivity of three- and 4-phase ZrB2-based composites with information on starting/final materials, processing, and density
| Material (vol% orotherwise stated) | Powder processing | Purity (%) | Densification technique | Special notes (gs in µm) | ρrelative (%) | Thermal conductivity k (W/m-K) | Ref. | |
| 25 °C | at max temp | |||||||
| 5%SiC + 20%MoSi2 | BM w/SiC | — | HP at 1800 °C | — | 100a | 82 | — | [48] |
| 10%SiC + 20%MoSi2 | BM w/SiC | — | HP at 1800 °C | — | 100a | 94 | — | [48] |
| 20%SiC + 20%MoSi2 | BM w/SiC | — | HP at 1800 °C | — | 100a | 90 | — | [48] |
| 30%SiC + 20%MoSi2 | BM w/SiC | — | HP at 1800 °C | — | 100a | 98 | — | [48] |
| 5%SiC + 40%MoSi2 | BM w/SiC | — | HP at 1800 °C | — | 100a | 81 | — | [48] |
| 10%SiC + 40%MoSi2 | BM w/SiC | — | HP at 1800 °C | — | 100a | 85 | — | [48] |
| 10.7%SiC + 8.9%B4C | BM w/B4C | — | PS, HIP at 2000 °C, 1800 °C | — | 100 | 94 | 57 at 1940 °C | [48] |
| 21.9%SiC + 7.8%B4C | BM w/B4C | — | PS, HIP at 2000 °C, 1800 °C | — | 100 | 90 | 47.3 at 2000 °C | [51] |
| 48.7%SiC + 5.1%B4C | BM w/B4C | — | PS, HIP at 2000 °C, 1800 °C | — | 100 | 101 | 33.4 at 1950 °C | [51] |
| 18%SiC + 10%C | VM w/plastic | — | HP | — | 100 | — | 73.6 at 1000 °C | [8] |
| 18%SiC + 10%C | VM w/plastic | — | HP | — | 100 | — | 61.1 at 2000 °C | [8] |
| 14%SiC + 30%C | VM w/plastic | — | HP | — | 100 | — | 57.7 at 1000 °C | [8] |
| 14%SiC + 30%C | VM w/plastic | — | HP | — | 100 | — | 59.2 at 2000 °C | [8] |
| 20%SiC + 2wt%CNT | PBM w/Si3N4 | — | HP at 1900 °C | — | ? | 91 | 72.4 at 400 °C | [42] |
| 20%SiC + 15% Cg | BM w/SiC | — | HP at 1900 °C | — | 100 | 81 | 58.7 at 1000 °C | [40] |
| 30%SiC(10%SiCw) + 10% Cg | BM w/ZrO2 | 99.5 ZrB2/SiCp, 99 SiCw/Cg | HP at 1800 °C | — | 99.6 | 100 | 65.5 at 1200 °C | [52] |
| 20%SiC + 10% Cf | PBM w/SiC | — | HP at 2000 °C | gsZrB2 = 2.55, gsSiC = 1.47 | 99.6 | 95 | — | [47] |
| 20%SiC + 20% Cf | PBM w/SiC | — | HP at 2000 °C | gsZrB2 = 2.79, gsSiC = 1.65 | 99.4 | 83 | — | [47] |
| 20%SiC + 30% Cf | PBM w/SiC | — | HP at 2000 °C | gsZrB2 = 2.82, gsSiC = 1.35 | 99.5 | 68 | — | [47] |
| 2%MoSi2 + 15%SiC | BM w/ZrO2 | — | HP at 1820 °C | gsZrB2 = 1–5 | ? | 62 | 64.5 at 1200 °C | [49] |
| 20%SiC + 5%Si3N4 + 20%ZrC | BM w/WC | All powder >99.5 | HP at 2000 °C | — | >98 | 82 | 50.0 at 1200 °C | [41] |
| 20%SiC + 5%Si3N4 | BM w/WC | All powder >99.5 | HP at 2000 °C | — | >98 | 103 | 61.2 at 1200 °C | [41] |
| 15%SiC + 2%Si3N4 | BM w/SiC | — | HP at 1900 °C | — | 98.1 | 80 | 58 at 1500 °C | [53] |
| 5%SiC + 5%TaSi2 | BM w/SiC | — | SPS at 1800 °C | — | >98.2 | 42 | — | [54] |
| 10%SiC + 5%TaSi2 | BM w/SiC | — | SPS at 1800 °C | — | >98.2 | 40 | — | [54] |
| 20%SiC + 5%TaSi2 | BM w/SiC | — | SPS at 1800 °C | — | >98.2 | 43 | — | [54] |
| 30%SiC + 5%TaSi2 | BM w/SiC | — | SPS at 1800 °C | — | >98.2 | 50 | — | [54] |
| 10%SiC + 10%TaSi2 | BM w/SiC | 99 (all powders) | SPS at 1600 °C | — | ? | 43 | — | [55] |
| 20%SiC + 10%TaSi2 | BM w/SiC | 99 (all powders) | SPS at 1600 °C | — | ? | 45 | — | [55] |
| 20%SiC + 20%TaSi2 | BM w/SiC | 99 (all powders) | SPS at 1600 °C | — | ? | 45 | — | [55] |
| 30%SiC + 10%TaSi2 | BM w/SiC | 99 (all powders) | SPS at 1600 °C | — | ? | 40 | — | [55] |
| 30%SiC + 20%TaSi2 | BM w/SiC | 99 (all powders) | SPS at 1600 °C | — | ? | 46 | — | [55] |
| 10%SiC + 10%TaSi2 | BM w/SiC | 99 (all powders) | SPS at 1800 °C | — | ? | 46 | — | [55] |
| 20%SiC + 10%TaSi2 | BM w/SiC | 99 (all powders) | SPS at 1800 °C | — | ? | 47 | — | [55] |
| 20%SiC + 20%TaSi2 | BM w/SiC | 99 (all powders) | SPS at 1800 °C | — | ? | 53 | — | [55] |
| 30%SiC + 10%TaSi2 | BM w/SiC | 99 (all powders) | SPS at 1800 °C | — | ? | 47 | — | [55] |
| 30%SiC + 20%TaSi2 | BM w/SiC | 99 (all powders) | SPS at 1800 °C | — | ? | 51 | — | [55] |
| 33.3%SiC + 33.3%ZrC | BM w/SiC | — | SPS at1950°C | — | 98.7 | 73 | — | [56] |
| 15%SiC + 15%ZrC | BM w/SiC | — | SPS at1950°C | — | 98.5 | 86 | — | [56] |
| 30%SiC + 15%ZrC | BM w/SiC | — | SPS at1950°C | — | 98.7 | 89 | — | [56] |
| 15%SiC + 30%ZrC | BM w/SiC | — | SPS at1950°C | — | 98.8 | 74 | — | [56] |
| 18%SiC + 8%ZrC | BM w/ZrO2 | — | SPS at 2000 °C | — | 85.7 | 71 | — | [19] |
| 25%SiC + 12%ZrC | BM w/ZrO2 | — | SPS at 2000 °C | — | 81–90 | 71 | — | [19] |
| 33%SiC + 16%ZrC | BM w/ZrO2 | — | SPS at 2000 °C | — | 94–99 | 60 | — | [19] |
| 4%SiC + 35%ZrC | BM w/ZrO2 | — | SPS at 2000 °C | — | 97–99 | 62 | — | [19] |
PBM, planetary ball milling.
a Corrected to 100% in this work.
9.3.1.1 ZrB2-X Composites.
ZrB2–SiC ceramics have been studied by a host of researchers (Table 9.4) [8, 14–16, 18, 46–46], along with other ZrB2 based composites with additions of C [8, 11, 20], MoSi2 [48, 49], ZrC [11, 12], or ZrSi2 [50] (Table 9.5). The compositions span a large range of additive contents. However, the present review was limited to additions less than or equal to 50 vol% so the materials may be regarded as ZrB2-based. Values of k were plotted as a function of temperature for ZrB2–SiC (Fig. 9.7)2 and ZrB2–X (Fig. 9.8), where X is C, MoSi2, or ZrC. All of the studies but Clougherty et al. [8] measured D and calculated k using Equation 9.1.
Figure 9.7. Thermal conductivity as a function temperature for ZrB2 with SiC additions ranging from 5 to 50 vol%. (Note: Clougherty changed testing methods at 1000°C.) aData corrected for ρ [8, 14, 15, 18, 36, 41–45].
Figure 9.8. Thermal conductivity as a function of temperature for ZrB2 with additions of carbon, MoSi2, or ZrC. Clougherty changed testing methods at 1000°C. [8, 11, 12, 20, 21, 48].
ZrB2–SiC
As seen in Table 9.4 and Figure 9.7, SiC additions to ZrB2 range from 5 to 50 vol%. In general, k decreases as SiC content increases. Therefore, SiC appears to act as a lower k phase (with respect to ZrB2). However, whether this is an expected outcome depends on the inherent conductivity of SiC in the composite.
The room-temperature k of high-purity single-crystal SiC (ppm impurity levels) can be as high as 490 W/m-K, with a theoretical upper limit predicted to be as high as 700 W/m-K. This high k is attributed to phonon transport since SiC is not electrically conductive [57]. Despite high k values at room temperature, k of SiC drops off quickly with increasing impurity content due to phonon scattering [57–62]. When N is present as an impurity, SiC can have k as low as 60 W/m-K at room temperature [57, 63]. Further, SSs with elements like Be, B, and Al, which are introduced from common sintering aids, can result in SiC ceramics with k values in the range of 250–270 W/m-K [59, 64], 100–150 W/m-K, and 80–120 W/m-K [62], respectively. In addition, k decreases with increasing amounts of each constituent [61]. Given the effect of impurities, SiC in ZrB2–SiC composites could be below the k of ZrB2, due to starting impurities or by picking up B from the surrounding diboride.
Other explanations are possible for observed reductions in k values for ZrB2–SiC. For example, microcracks can form due to residual stresses from SiC particle or cluster sizes greater than approximately 11.5 µm [65]. Microcracking is similar to porosity, reducing k by decreasing the effective conduction path, thus disrupting phonon and electron transport. Depending on SiC distribution, size, morphology, and volume fraction, microcracks can be present in the final ceramic, but have rarely been discussed. Another explanation for a drop in k due to SiC additions is the presence of a second phase at the grain boundaries. An SiO2-based phase can form at the grain boundaries in ZrB2–SiC, but appropriate additions of B4C and C can remove it prior to densification [66].
Loehman et al. reported one of the best examples of decreasing k with increasing SiC content in diborides. As SiC content increase from 5 vol% SiC to 20 vol% SiC, k at 250°C dropped from 112 to 100 W/m-K [14]. For their ceramic containing 5 vol% SiC, k was 112 W/m-K, which is quite high and similar to the value of 110 W/m-K reported by Zhang et al. [18] for reaction-processed ZrB2. As the ZrB2 comprises the majority of this material, the high conductivity may be an indication of the diboride purity.
For SiC contents of 20 vol%, a majority of k values [8, 14, 41, 46] lie in a range (highlighted in Fig. 9.7) between 88–102 W/m-K at 200°C and 66–70 W/m-K at 2000°C. Because reported k values vary for both ZrB2 and SiC, it is difficult to define one k value for ZrB2–20% SiC. This region is likely adequate based on the convergence of multiple research efforts into a narrow set of k values. Four ceramics containing 20 vol% SiC fell below this region [18, 40, 42, 45] and deserve further discussion. Ceramics produced by both Wang et al. [40] and Zhang et al. [45] likely had microcracking. Image analysis by both researchers showed that SiC cluster sizes were greater than or equal to 11.5 µm, indicating that both materials had SiC inclusions large enough to promote microcracking. In addition, modulus values reported were lower than expected at 480 GPa (~492 GPa if corrected for porosity) for Wang and 374 GPa (~382 GPa if corrected for ~1% porosity) for Zhang, further supporting the case for microcracking.
Microcracking does not appear to be an issue with the other two lower k compositions. Hence, purity may be the cause. Zhang et al. milled the ZrB2 and SiC using WC media [18]. As discussed earlier, W decreases the k of ZrB2. Finally, the material evaluated by Tian et al. used lower purity SiC (98.5%) and Si3N4 media for milling. Nitrogen [57], and specifically Si3N4, [67] contamination have been shown to decrease the conductivity of SiC.
Arc melted ZrB2–SiC evaluated by Tu et al. may be the least practical material from a production standpoint, but it is a unique material from a scientific perspective. The material containing 50 vol% SiC had a very fine eutectic microstructure with ZrB2 and SiC features approximately 100 nm wide [43]. The fine microstructure likely led to a higher phonon scattering (compared to other traditionally processed ZrB2–SiC compositions), which may have resulted in a steeper slope in k with temperature.
ZrB2-(C, MoSi2, ZrC, and ZrSi2).
In addition to diboride–SiC composites, k has been evaluated for two-phase ZrB2-based compositions containing C [8, 11, 20], MoSi2 [48, 49], ZrC [11, 12], and ZrSi2 [50] (Table 9.5). Figure 9.8 shows k as a function of temperature for these materials. Note that the disilicides by Guo [48, 50] were only evaluated at room temperature. A broad range of k values were reported depending on the specific additive and its amount. For ZrB2 containing 20 vol% C, the material from Clougherty et al. is the only one with k values that decreased with temperature. Like other materials evaluated by Clougherty, this one had a discontinuity at 1000°C where the test method switched from a steady-state cut bar method to calculation from D, but overall k dropped from approximately 85 W/m-K at 100°C to approximately 64 W/m-K at 2000°C [8]. The form of the carbon in the material, either before or after processing, is not discussed. Given the small decease in k at room temperature between this material and the ZrB2 studied by Clougherty, the C is likely to be graphitic in nature. Amorphous carbon has a lower k than ZrB2 and would have decreased k considerably more than for graphitic carbon, which has a k value about the same as ZrB2 [68, 69].
Thompson et al. [20] and Andrievskii et al. [11] also investigated ZrB2 with carbon additions. The k values increased with increasing temperature, indicating that the diboride was the primary influence on k. For Andrievskii et al., 26 vol% carbon was added as graphite, which reduced the conductivity approximately 10 W/m-K at all temperatures [11]. Thompson et al. added carbon in the form of phenolic resin, resulting in 1 and 3 wt% amorphous carbon after pyrolysis. After hot pressing, graphitic carbon was identified at the grain boundaries. ZrB2 containing 1 wt% C had k values lower than pure ZrB2. They hypothesized that graphite was aligned, with its basal plane parallel to the grain boundaries, thus disrupting phonon transport between ZrB2 grains. However, k did not continue to decrease when C content was increased to 3 wt% C due to the segregation of W into ZrC after testing up to 2000°C. The ZrC phase, produced due to carbon additions, served as a sink for W, reducing the W content of the ZrB2 grains and boosting the overall k of the composite [20].
The addition of ZrC to ZrB2 typically reduces k. Andrievskii et al. evaluated both 5 and 50 vol% ZrC from 100 to 900°C, while Fridlender et al. added 20, 40, and 45 vol% ZrC and tested up to 2150 or 2200°C. The higher ZrC additions resulted in k values between 40 and 55 W/m-K, while the lower additions resulted in k values between 64 and 80 W/m-K, despite the different testing temperatures and compositions. The differences, and the decrease in k with increasing ZrC content, were probably due to the variability in k values for ZrC (20–45 W/m-K at room temperature and increasing to 30–50 W/m-K at 2000°C), which are well below the values for pure ZrB2 [70].
Monteverde et al. evaluated ZrB2 containing 2.3 vol% MoSi2 as a sintering aid. The k for this material was approximately 66 W/m-K at 25°C and increased to approximately 75 W/m-K at 1200°C [49]. If it were only a second phase, this small addition would not likely decrease k of the composite much, even though the k of MoSi2 is significantly lower than ZrB2 [70–72]. However, Mo also dissolves into ZrB2, which decreases k and results in k values that increase as temperature increases [23]. Therefore, even small additions of MoSi2 have a significant effect on k.
9.3.1.2 ZrB2 Ternary- and Quaternary-Phase Composites.
Several three-phase, and even a few four-phase, ZrB2-based composites have been produced and evaluated (Table 9.6). One common feature of these multiphase composites is the addition of SiC, which was present in varying amounts. Once past this common addition, the tertiary and quaternary phases were MoSi2 [48], B4C [51], Cg [8, 40, 52], CNTs [42], carbon fiber (Cf) [47], SiC whiskers (SiCw) [52], Si3N4 [41, 53], TaSi2 [55], or ZrC [41, 56, 73]. Only two studies, [8] and [73], evaluated k other than by using Equation 9.1, and all but one study ([51] performed PS) employed HP or SPS for densification. From Table 9.6, k was evaluated beyond room temperature for 14 of these materials (Fig. 9.9) [8, 40–42, 49, 51–53].3
Figure 9.9. Thermal conductivity as a function of temperature for ZrB2-SiC-based composites with additions of, B4C, C (elemental, nanotubes (CNT) and graphite (Cg)), MoSi2, Si3N4, SiCw (whiskers), or ZrC. Clougherty changed testing methods at 1000°C. aData corrected for ρ [8, 18, 36, 41, 43, 48, 60, 72].
Because of the complex effects of the addition of two, or even three, phases to ZrB2, it is difficult to understand how each species affects k. Therefore, instead of evaluating k for each composition, more generalities will be surmised with some specific examples brought out when clear. Overall, k values presented in Figure 9.9 lie between 80 and 103 W/m-K at room temperature. Further, all of k values decrease with increasing temperature, except for ZrB2 with 15 vol% SiC and 2 vol% MoSi2 [49]. This is likely due to the dissolution of Mo from the MoSi2 into ZrB2. At the highest test temperatures (1940–2000°C), the range of reported k values increased. This is due to the low k (31 W/m-K) of ZrB2 containing 48.7 vol% SiC and 5.1 vol% B4C produced by Speyer et al. [51] The k of this material was likely diminished at high temperatures compared to the other materials due to a higher SiC content and the addition of B4C, which has a k of approximately 7 W/m-K above 1700°C [74]. At lower temperatures (<1000°C), the four-phase composite containing 20 vol% SiC, 5 vol% Si3N4, and 20 vol% ZrC had the lowest k and a negative slope [41]. The presence of ZrC, which has an increase in k with temperature [75], may be the reason that this material does not have as negative a slope as Speyer's composition.
The highest k was reported for a composite containing 18 vol% SiC and 10 vol% C (presumably graphitic C because of the higher conductivity). At 100°C, k was approximately 115 W/m-K, which approached the value for the reaction-processed ZrB2 by Zhang et al. [18]. However, compared to the pure ZrB2, k of the 18% SiC–10% C composition dropped off much faster with temperature, eventually reaching 74 W/m-K at 2000°C.
9.3.2 Thermal Conductivity of HfB2 Composites
Tables 9.7 and 9.8 summarize k values reported for HfB2 composites. Like ZrB2 composites (Tables 9.4 and 9.5), HfB2 composites were primarily HfB2-SiC (Table 9.7). [8, 14, 18, 28, 37, 41, 54, 76] The other HfB2 composites are two-phase materials with additions of boron carbides (B3C or B12C) [78] or C (graphite) [8], or three-phase materials containing SiC and C [8], SiC and B4C [76], or SiC and TaSi2 [54] (Table 9.8). Densification was carried out using either HP or SPS for materials in Table 9.7 while only HP was used for those in Table 9.8. Besides the steady-state evaluation of k performed by Clougherty et al. [8] (below 1000°C), all of the other researchers evaluated D to calculate k. Plots of k as a function of temperature for HfB2–SiC composites, and the other two- and three-phase materials, are included in Figures 9.10 and 9.11.4
Table 9.7. Thermal conductivity of HfB2–SiC with information on starting/final materials, processing, and density
| SiC Vol% | Powder processing | Purity (%) | Densification Technique | Special Nnotes | ρrelative (%) | Thermal Conductivity k (W/m-K) | Ref. | |
| 25 °C | at max temp | |||||||
| 20% | VM w/plastic | — | HP | — | 100 | — | 62 at 1000 °C | [8] |
| 30% | VM w/plastic | — | HP | — | 100 | — | 58 at 1000 °C | [8] |
| 30% | VM w/plastic | — | HP | — | 100 | — | 60 at 2000 °C | [8] |
| 5% | VM w/plastic | — | HP | — | 100 | — | 59 at 1000 °C | [8] |
| 5% | VM w/plastic | — | HP | — | 100 | — | 68 at 2000 °C | [8] |
| 20% | PBM or AM w/WC | 98.8 | HP | 25 mm billet | 100 | 42 | 49 at 2000 °C | [28] |
| 20% | PBM or AM w/WC | 98.8 | HP | 50 mm billet | 100 | 45 | 51 at 2000 °C | [28] |
| 2% | BM w/ZrO2 | 99.5 ZrB2, 99 SiC | HP at 2000 °C | — | 101 | — | 77 at 2000 °C | [14] |
| 20% | BM w/ZrO2 | 99.5 ZrB2, 99.9 SiC | HP at 2000 °C | — | 103 | — | 65 at 2000 °C | [14] |
| 5% | BM w/ZrO2 | 99.5 ZrB2, 99 SiC | HP at 2000 °C | — | 101 | — | 76 at 2000 °C | [14] |
| 20% | PBM w/WC | 98.8 | HP | — | 99.7 | 79 | 76 at 600 °C | [37] |
| 20% | PBM w/WC | — | SPS | — | 99.1 | 78 | 73 at 600 °C | [37] |
| 20% | BM w/ZrO2 | 97.6 HfB2, 99.5 SiC, 98.1 B4C | HP at 2000 °C | gsHfB2 = 6 µm | 98.4 | — | 55 at 1800 °C | [76] |
| 20% | — | — | HP at 2150 °C | — | 99.1 | — | 33 at 1800 °C | [77] |
| 5% | PBM w/WC | 99.5 HfB2, 99.8 SiC | SPS | — | 99 | — | 104 at 425 °C | [18] |
| 5% | HM Hf + B + SiC | 99.8 Hf, 99 B, 99.8 SiC | rxn SPS | — | 101 | — | 110 at 425 °C | [18] |
| 20% | BM w/WC | All powder >99.5 | HP at 2000 °C | — | >96 | 141 | 86 at 1200 °C | [41] |
| 20% | — | — | — | SHARP-B2 material | 100 | 107 | 69 at 1800 °C | [28] |
Table 9.8. Thermal conductivity of HfB2-based composites with information on starting/final materials, processing, and density
| Material (vol%) | Powder processing | Purity (%) | Densification technique | Special notes (gs in µm) | ρrelative (%) | Thermal conductivity k (W/m-K) | Ref. | |
| 25 °C | at max temp | |||||||
| 20%C | VM w/plastic | — | HP | — | 100 | — | 70 at 1000 °C | [8] |
| 20%C | VM w/plastic | — | HP | — | 100 | — | 69 at 2000 °C | [8] |
| 12%B12C | BM w/ZrB2 | 99.5 HfB2, 99% B | HP at 2000 °C | — | 99.1 | 106 | 89 at 1000 °C | [78] |
| 12%B3C | BM w/ZrB2 | 99.5 HfB2, 99% B | HP at 2000 °C | — | 99.1 | 112 | 84 at 2000 °C | [78] |
| 20%SiC + 10%B4C | BM w/ZrO2 | — | HP at 1850 °C | gsZrB2 = 4 | 98.7 | — | 35 at 1800 °C | [76] |
| 18%SiC + 10%C | VM w/plastic | — | HP | — | 100 | — | 66 at 1000 °C | [8] |
| 18%SiC + 10%C | VM w/plastic | — | HP | — | 100 | — | 61 at 2000 °C | [8] |
| 20%SiC + 20%Cf | PBM w/SiC | — | HP at 2100 °C | gsHfB2 = 2.6, gsSiC = 1.3 | 99.5 | 94 | — | [79] |
| 20%SiC + 30%Cf | PBM w/SiC | — | HP at 2100 °C | gsHfB2 = 2.6, gsSiC = 1.5 | 99.3 | 74 | — | [79] |
| 30%SiC + 5%TaSi2 | BM w/SiC | — | SPS at 1800 °C | — | >98.2 | 118 | — | [54] |
| 5% SiC + 5%TaSi2 | BM w/SiC | — | SPS at 1800 °C | — | >98.2 | 78 | — | [54] |
| 10% SiC + 5%TaSi2 | BM w/SiC | — | SPS at 1800 °C | — | >98.2 | 90 | — | [54] |
| 20% SiC + 5%TaSi2 | BM w/SiC | — | SPS at 1800 °C | — | >98.2 | 87 | — | [54] |
Figure 9.10. Thermal conductivity as a function of temperature for HfB2–SiC with SiC contents ranging from 2 vol% to 30 vol%. Clougherty changed testing methods at 1000°C. aData corrected for ρ [8, 14, 18, 28, 36, 39, 78].
Figure 9.11. Thermal conductivity as a function of temperature for HfB2 with additions of BxC (x = 3 or 12), C, or SiC with C or B4C. Clougherty changed testing methods at 1000°C. aData corrected for ρ [8, 18, 54, 75].
9.3.2.1 HfB2–SiC.
Unlike ZrB2–SiC (Fig. 9.7), where increasing SiC additions decreased k, HfB2–SiC does not show the same trends (Fig. 9.10). Loehman et al. [14] and Clougherty et al. [8] evaluated SiC additions of 2, 5, and 20 vol%, and 5, 20, and 30 vol%, respectively. These systematic studies should be useful for evaluating trends. However, despite the variation in SiC content, k values did not vary considerably (≤12 W/m-K for Loehman et al. and ≤16 for Clougherty et al.). Further, no distinct trends were apparent with respect to SiC content, with both data sets exhibiting several crossover points.
Conductivities were reported for three HfB2–20 vol% SiC composites in two separate studies ([28] and [37]) by Gasch et al. The highest k material was produced for the SHARP-B2 flight experiment. At room temperature, k was approximately 107 W/m-K and testing was performed up to 1800°C, where k dropped to 69 W/m-K. The other material in this study had significantly lower k values at room temperature and showed an increase in k with temperature (45 W/m-K at 25°C and 51 W/m-K at 1800°C) [28]. From the other Gasch study, k decreased slightly from 79 to 76 W/m-K between room temperature and 600°C [37]. Little information was given about the processing conditions for the SHARP-B2 material, so it is hard to say why its k was higher. However, powders for the lower k compositions were milled with WC media, which led to marked decreases in k for other diborides, as discussed earlier.
Similar to ZrB2–SiC materials, microcracking appears to also be a consideration for HfB2–SiC. The HfB2–20 vol% SiC evaluated by Weng et al. has the lowest k of all compositions in Figure 9.10 (44–33 W/m-K from 300 to 1800°C) and the reported modulus is only 346 GPa (352 GPa, corrected for ρ), which is much lower than expected based on the composition [77]. Other researchers report modulus values of approximately 520 GPa for HfB2 [28, 80] and 437–455 GPa for SiC. Conditions for microcracking in HfB2–SiC composites have not been reported, but based on the modulus, and what appear to be cracks, microcracking is a likely contributing factor.
The three HfB2–SiC composites with the highest k values are all at least as high as the pure reaction-processed HfB2 evaluated by Zhang et al. [18] Both 5 vol% SiC compositions were characterized in the same study as the pure HfB2, and the more conductive of the two was also produced using reaction processing. The purity of the reaction-processed diboride, along with the possibility of SiC sequestering impurities, resulted in HfB2–5 vol% SiC with a k of 137 W/m-K at 50°C [18]. Overall, the HfB2–20 vol% SiC presented by Mallik et al. was similar to the high k HfB2 containing 5 vol% SiC at 25°C (141 W/m-K). However, k decreased to that of the reaction-processed HfB2 by 200°C (~110 W/m-K) [41]. Of all the HfB2–SiC materials, the material by Mallik is surprising based on what was observed for increasing SiC additions to ZrB2 (Fig. 9.7) (especially given that the material was milled with WC) but no explanation is provided for the remarkably high k of this ceramic.
9.3.2.2 Other Secondary and Tertiary Additions to HfB2.
The k values for HfB2 with other second and third phases are plotted in Figure 9.11. The k values vary from as low as approximately 35 W/m-K to as high as approximately 115 W/m-K. The highest k values were reported by Brown-Shaklee et al. [78]. A slight variation in the thermal conductivity of these HfB2–BxC composites was observed, as can be seen by the decrease in conductivity of the 12 vol% B12C material between 3 and 7 W/m-K across the temperature range. The researchers mentioned that the differences in k were less than the uncertainty of the test. It was also concluded that the purity of the materials in this study led to the high k values, nearly matching the reaction-processed material by Zhang et al. [18].
Microcracking was identified in HfB2 containing 20 vol% SiC and 10 vol% B4C by Weng et al. [76]. Therefore, k of this composite should be higher without such flaws. The final two compositions characterized by Clougherty et al. (HfB2–20 vol% C (presumably graphite) and HfB2–18 vol% SiC–10 vol% C) had similar k values at 100°C (84–85 W/m-K). Their k values deviated more at 2000°C (~10 W/m-K), but based on the trend for HfB2–20% C, and the apparent discontinuity in values from switching testing methods at 1000°C, this difference was probably not significant. These materials were HfB2 analogues to ZrB2-based materials evaluated within the same study [8]. A comparison with the ZrB2 compositions (Figs. 9.7 and 9.8) shows little difference between the 20% SiC compositions. At 2000°C the 18% SiC–10% C composites were identical (~61 W/m-K) but at 100°C the k values differed by 32 W/m-K with the HfB2 composition having the lower k. This is unexpected since ZrB2 and HfB2 have similar behavior and was likely due to composition (purity) and microstructure, which could be evaluated to elucidate the cause for unexpected changes.
9.3.3 Conclusions Regarding Composites
Second-phase additions decrease k for diborides. The same decrease in k with temperature, as expected for the pure diborides, is observed, but the addition of second and third phases with lower k reduced k for the composites. One exception was the addition of MoSi2, which changed the slope of k as a function of temperature, as observed for dissolution of other transition metals in diborides.
While the addition of SiC could increase the k of composites due to its high intrinsic k, all reported SiC additions lower conductivity, likely due to the purity of SiC used in the diboride systems. Additions of SiC can also be detrimental to k due to microcracking. The threshold for SiC particle or cluster size in ZrB2 is approximately 11.5 µm. Larger sizes lead to microcracking in ZrB2–SiC, but no research has been examined microcracking in HfB2. Overall, the conductivities of the composites are still primarily controlled by the diboride. Whereas k may decrease with the addition of other phases, densification behavior, strength, thermal shock resistance, or oxidation resistance are often improved by these additions. Hence, understanding the factors that control k may enable design of compositions to balance the trade-offs for specific applications.
9.4 Electron and Phonon Contributions to Thermal Conductivity
The total thermal conductivity of the diborides of zirconium and hafnium, (kt, i.e., the experimental values discussed to this point) can be separated into the electron (ke) and phonon (kp) contributions. Several researchers have used Equations 9.4 and 9.5 to evaluate kt ZrB2 [15, 18, 20, 21, 81], ZrB2–SiC [15, 18, 46, 81], HfB2 [18], and HfB2–SiC [18, 81].


Equation 9.5, the Wiedemann-Franz law, was used to estimate ke from measured electrical resistivity (ρ) at temperature (T) using the theoretical Lorenz number (Lo = 2.45e−8 W/Ω-K−2), which was derived for metals.
9.4.1 ZrB2 and HfB2
Values of kt, ke, and kp for several ZrB2 and HfB2 ceramics are plotted as a function of temperature in Figure 9.12. Comparing kt and ke, the positive or negative trends with temperature for ke are identical to those of the kt, except for data from Tye and Clougherty5 [81]. On the other hand, kp, in general, shows little variation with temperature.
Figure 9.12. Total, electron, and phonon thermal conductivities as a function of temperature for ZrB2 and HfB2. aData corrected forρ [15–17, 20, 79].
The relatively small differences between ke and kt (excluding Tye and Clougherty and Zimmermann et al. [15]) indicate that electrons are the dominant thermal carrier for diborides. No indication is given as to why kp is so much higher and has a positive trend (and conversely ke so much lower) for the material studied by Tye and Clougherty. When compared with other reports, this does not seem to be characteristic of ZrB2. Zimmermann et al. found kp values as high as approximately 24 W/m-K below 200°C. However, most other research [18, 21], and the ZrB2 produced by Thompson et al. [20], indicated that kp was less than approximately 12 W/m-K for either ZrB2 or HfB2.
Because ke and kp are estimated using Equations 9.4 and 9.5, this method may be prone to error. One assumption that permeates the studies to date is that the theoretical Lorenz number is appropriate for diborides. Calculation of negative kp values for materials produced by Zhang et al. in Figure 9.12, indicate that a lower value for the Lorenz number may be more representative of the behavior of diborides. However, research still indicates that ke is the dominant thermal conduction mechanism for ZrB2 and HfB2.
9.4.2 ZrB2 and HfB2 Composites with SiC
Figure 9.13 highlights the contributions of ke and kp to kt for ZrB2–SiC and HfB2–SiC. Overall, some of the differences observed for materials with SiC additions are not explained and some trends appear to contradict prevailing theories. For example, ke increases with increasing temperature for ZrB2 + 20% SiC reported by Zhang et al. despite electrical resistivity values that increase with temperature for metallic conductors. Likewise, Tye and Clougherty reported significantly higher kp values than other researchers and their kp values increased with increasing temperature. The most important observation from Figure 9.13 is the decreasing contribution of ke with increasing SiC content. This is expected due to the higher electrical resistivity of SiC (>1000 μΩ-cm) [82] compared to ZrB2 (<25 μΩ-cm at 25°C) [15]. Based on this difference, electron conduction, which dominated kt for diboride–SiC composites, is likely entirely supported by ZrB2, with SiC acting as an electrically insulating phase.
Figure 9.13. Thermal conductivities as a function of temperature for ZrB2–SiC and HfB2–SiC, including separation of the electron and phonon contributions to total conductivity.aData corrected for ρ [16, 20, 50, 84].
In general, kp increases as SiC content increases since phonon conduction is the primary thermal transport pathway for SiC. One clear exception is ZrB2–30 vol% SiC, which should have a higher kp due to its higher SiC content. However, as mentioned earlier, factors other than SiC content likely control this behavior since that composition contained WC contamination from milling. Hence, a direct comparison to other ZrB2–SiC compositions is not possible without considering purity. Like some pure diboride material, such as those evaluated by Zhang et al. [18], the kp of HfB2–5 vol% SiC dropped below zero, which is unrealistic. This is another indication that the theoretical Lorenz number is not appropriate for diborides.
9.4.3 Conclusions Regarding ke and kp Research
The total k of diborides is dominated by electron transport. Therefore, to understand and control thermal conductivity of the diborides, factors that influence ke are most important. The electron portion of kt is clearly altered by transition metal impurities as indicated by decreased ke values for materials containing W. SiC, which is electrically insulating, reduces ke and increases kp. The key to evaluating ke and its contribution to kt is the Wiedemann–Franz law. In some cases, the Wiedemann–Franz law predicts ke values that are higher than kt, resulting in negative kp. Not all specimens exhibit this behavior, but it is an indication that the theoretical Lorenz number may not be valid for the diborides.
9.5 Concluding Remarks
The thermal conductivity of ZrB2- and HfB2-based ceramics is affected by a number of factors, perhaps none more important than processing. In particular, contaminants from milling, impurities inherent to starting powders, or intentional additives almost always decrease k for ZrB2 and HfB2. The final microstructure, relative density, and phase distribution and content are critical and cannot be neglected in the evaluation of k. Additional phases or SSs that form during densification also strongly affect k. In particular, SSs appear to have the largest impact. Careful reporting of initial powder purity, contaminants from processing, and additives along with the resulting microstructure and phase distribution is necessary for direct comparison of k values among different materials. Further, future research on k of diborides would benefit from systematic studies designed to isolate specific compositional or processing effects rather than drawing conclusions solely based on comparison with reported values. In addition to performing more systematic research, separating electron and phonon contributions to kt will be critical for gaining insight into what controls conductivity. The field would also benefit from experimental or computational investigation of Lorenz numbers to improve the accuracy of ke and kp. The electron contribution to kt is dominant in ZrB2 and HfB2. Therefore, more detailed studies of factors that affect ke would also be beneficial.
Research to date on additions of alloying elements or second phases has shown that kt is maximized for phase pure diborides. SiC additions, despite their high kt in single crystal form, do not increase k for either ZrB2 or HfB2, especially at higher temperatures. Combined with research suggesting that ZrB2–SiC has poor oxidation resistance above approximately 1600°C [28, 83], SiC additions (as well as other silica formers) will not result in improved performance of UHTCs under the conditions they are being proposed to operate (i.e., hypersonic flight). Most other second-phase additions also decrease kt of the diborides, so their use requires consideration of trade-offs such as improved strength or oxidation resistance for lower kt. More research may also be useful in the area of decreasing kt to produce ultra-high temperature insulators. SS additions such as W have been shown to impact kp, especially at low temperatures. However, ke dominates kt and has the largest potential to be diminished, but is the least understood.
References
- 1. Squire TH, Marschall J. Material property requirements for analysis and design of UHTC components in hypersonic applications. J Eur Ceram Soc 2010;30 (11):2239–2251.
- 2. Wuchina E, Opila E, Opeka M, Fahrenholtz W, Talmy I. UHTCs: ultra-high temperature ceramic materials for extreme environment applications. Electrochem Soc Interface 2007;16 (4):30.
- 3. Van Wie DM, Drewry DG, King DE, Hudson CM. The hypersonic environment: required operating conditions and design challenges. J Mater Sci 2004;39 (19):5915–5924.
- 4. Walker SP, Sullivan BJ. Sharp refractory composite leading edges on hypersonic vehicles. AIAA Paper, 6915; 2003.
- 5. Malone JE. Materials may allow spacecraft design change. Aerosp Technol Innov 2000;8 (6):1.
- 6. Sindeband SJ, Schwarzkopf P. The metallic nature of metal diborides. Powder Metall Bull 1950;5 (3):42–43.
- 7. Neel DS, Pears CD, Oglesby S, Jr. The thermal properties of thirteen solid materials to 5000°F for thier destruction temperatures. WADD TR 60-924. Southern Research Institute; February 1962.
- 8. Clougherty EV, Wilkes KE, Tye RP. Research and development of refractory oxidation-resistant diborides, part II, volume V: thermal, physical, electrical, and optical properties, Technical report AFML-TR-68-190. Wright-Patterson Air Force Base (OH): Air Force Materials Laboratory, Air Force Systems Command; 1969.
- 9. Samsonov GV, Kovenskaya BA, Serebryakova TI, Tel'nikov EY. Thermal conductivity of diborides of group IV-VI transition metals. High Temp 1972;10 (6):1193–1195.
- 10. Branscomb TM, Hunter JO. Improved thermal diffusivity method applied to TiB2, ZrB2, and HfB2 from 200° to 1300°C. J Appl Phys 1971;42 (6):2309–2315.
- 11. Andrievskii RA, Korolev LA, Klimenko VV, Lanin AG, Spivak II, Taubin IL. Effect of zirconium carbide and carbon additions on some physicomechanical properties of zirconium diboride. Powder Metall Metal Ceram 1980;19 (2):93–94.
- 12. Fridlender BA, Neshpor VS, Ordan'yan SS, Unrod VI. Thermal conductivity and diffusivity of binary alloys of the ZrC-ZrB2 system at high temperatures. High Temp 1980;17 (6):1001–1005.
- 13. Kinoshita H, Otani S, Kamiyama S, Amano H, Akasaki I, Suda J, Matsunami H. Zirconium diboride (0001) as an electrically conductive lattice-matched substrate for gallium nitride. Jpn J Appl Phys Part 2 Lett 2001;40 (12 A):L1280–L1282.
- 14. Loehman R, Corral E, Dumm HP, Kotula P, Tandon R. Ultra high temperature ceramics for hypersonic vehicle applications. Sandia Report SAND 206-2925. Albuquerquie, New Mexico, and Livermore, California: Sandia National Laboratories; 2006.
- 15. Zimmermann JW, Hilmas GE, Fahrenholtz WG, Dinwiddie RB, Porter WD, Wang H. Thermophysical properties of ZrB2 and ZrB2–SiC ceramics. J Am Ceram Soc 2008;91 (5):1405–1411.
- 16. Ikegami M, Matsumura K, Guo SQ, Kagawa Y, Yang JM. Effect of SiC particle dispersion on thermal properties of SiC particle-dispersed ZrB2 matrix composites. J Mater Sci 2010;45 (19):5420–5423.
- 17. Guo S, Nishimura T, Kagawa Y. Preparation of zirconium diboride ceramics by reactive spark plasma sintering of zirconium hydride-boron powders. Scr Mater 2011;65 (11):1018–1021.
- 18. Zhang L, Pejaković DA, Marschall J, Gasch M. Thermal and electrical transport properties of spark plasma-sintered HfB2 and ZrB2 ceramics. J Am Ceram Soc 2011;94 (8):2562–2570.
- 19. Snyder A, Bo Z, Hodson S, Fisher T, Stanciu L. The effect of heating rate and composition on the properties of spark plasma sintered zirconium diboride based composites. Mater Sci Eng A 2012;538 (0):98–102.
- 20. Thompson MJ, Fahrenholtz WG, Hilmas GE. Elevated temperature thermal properties of ZrB2 with carbon additions. J Am Ceram Soc 2012;95 (3):1077–1085.
- 21. Thompson MJ. Densification and thermal properties of zirconium diboride based ceramics [Ph.D. thesis]. Rolla (MO) : Missouri University of Science and Technology; 2012.
- 22. Harrington GJK, Hilmas GE, Fahrenholtz WG. Effect of carbon on the thermal and electrical transport properties of zirconium diboride, Submitted to J Eur Ceram Soc 2014.
- 23. McClane D, Fahrenholtz WG, Hilmas GE. Thermal properties of zirconium diboride with transition metal diboride additions. J Am Ceram Soc 2013;97 (5):1552–1558.
- 24. Schick HL, Avco Corporation Research and Advanced Development Division, Air Force Materials Laboratory. Materials Physics Division. Thermodynamics of Certain Refractory Compounds. New York: Academic Press; 1966.
- 25. Bolgar AS, Guseva EA, Turchanin AG, Fesenko VV. Thermodynamic properties of zirconium diboride. In: Thermophysical Propeties of Solid Substances [in Russian]. Moscow: Nauka; 1976. p 130–132.
- 26. Chase MW. NIST-JANAF Thermochemical Tables. 4th ed. Woodbury (NY): American Chemical Society and the American Institute of Physics; 1998.
- 27. Roine A. HSC chemistry for Window, Version 5.11 [Computer Program]. Pori: Outokumpu Research, Oy; 2006.
- 28. Gasch M, Ellerby D, Irby E, Beckman S, Gusman M, Johnson S. Processing, Properties and Arc Jet Oxidation of Hafnium Diboride/Silicon Carbide Ultra High Temperature Ceramics. Volume 39, Heidelberg: Springer; 2004. p 55–60.
- 29. Kingery WD, Mcquarrie MC. Thermal conductivity: I, concepts of measurement and factors affecting thermal conductivity of ceramic materials. J Am Ceram Soc 1954;37 (2):67–72.
- 30. Vajeeston P, Ravindran P, Ravi C, Asokamani R. Electronic structure, bonding, and ground-state properties of AlB2-type transition-metal diborides. Phys Rev B 2001;63 (4):045115.
- 31. Voigt W. Lehrbuch der kristallphysik. Volume 34, Leipzig: BG Teubner; 1910.
- 32. Nichols JL. Orientation and temperature effects on the electrical resistivity of high-purity magnesium. J Appl Phys 1955;26 (4):470–472.
- 33. Maxwell JC. A Treatise on Electricity and Magnetism. Volume 1, Oxford: Clarendon Press; 1873. p 361–73.
- 34. Eucken A. Wärmeleitfähigkeit keramischer feuerfester Stoffe (Thermal conductivity of ceramic refractory materials). Forschung auf dem Gebiete des Ingenieurwesens 1932; Ausgabe B3 (353):6–21.
- 35. Gosset D, Decroix G-M, Kryger B. Improvement of thermo-mechanical properties of boron-rich compounds. Japanese Journal of Applied Physics, Proceedings of the 11th International Symposium on Boron, Borides, and Related Compounds; Tsukuba, Japan; 1993. p 216–219.
- 36. Opeka MM, Talmy IG, Wuchina EJ, Zaykoski JA, Causey SJ. Mechanical, thermal, and oxidation properties of refractory hafnium and zirconium compounds. J Eur Ceram Soc 1999;19 (13–14):2405–2414.
- 37. Gasch M, Johnson S, Marschall J. Thermal conductivity characterization of hafnium diboride-based ultra-high-temperature ceramics. J Am Ceram Soc 2008;91 (5):1423–1432.
- 38. Card Number 89-3651, Powder Diffraction File for HfB2, International Centre for Diffraction Data.
- 39. Card Number 75-1050, Powder Diffraction File for ZrB2, International Centre for Diffraction Data.
- 40. Wang Z, Hong C, Zhang X, Sun X, Han J. Microstructure and thermal shock behavior of ZrB2–SiC–graphite composite. Mater Chem Phys 2009;113 (1):338–341.
- 41. Mallik M, Kailath AJ, Ray KK, Mitra R. Electrical and thermophysical properties of ZrB2 and HfB2 based composites. J Eur Ceram Soc 2012;32 (10):2545–2555.
- 42. Tian W-B, Kan Y-M, Zhang G-J, Wang P-L. Effect of carbon nanotubes on the properties of ZrB2–SiC ceramics. Mater Sci Eng A 2008;487 (1–2):568–573.
- 43. Tu R, Hirayama H, Goto T. Preparation of ZrB2-SiC composites by arc melting and their properties. J Ceram Soc Jpn 2008;116 (1351):431–435.
- 44. Zhang X, Xu L, Han W, Weng L, Han J, Du S. Microstructure and properties of silicon carbide whisker reinforced zirconium diboride ultra-high temperature ceramics. Solid State Sci 2009;11 (1):156–161.
- 45. Zhang H, Yan Y, Huang Z, Liu X, Jiang D. Properties of ZrB2–SiC ceramics by pressureless sintering. J Am Ceram Soc 2009;92 (7):1599–1602.
- 46. Zou J, Zhang G-J, Zhang H, Huang Z-R, Vleugels J, Van Der Biest O. Improving high temperature properties of hot pressed ZrB2–20vol% SiC ceramic using high purity powders. Ceram Int 2013;39 (1):871–876.
- 47. Guo S. Thermal and electrical properties of hot-pressed short pitch-based carbon fiber-reinforced ZrB2–SiC matrix composites. Ceram Int 2013;39 (5):5733–5740.
- 48. Guo S, Kagawa Y, Nishimura T, Tanaka H. Thermal and electric properties in hot-pressed ZrB2–MoSi2–SiC composites. J Am Ceram Soc 2007;90 (7):2255–2258.
- 49. Monteverde F. The addition of SiC particles into a MoSi2-doped ZrB2 matrix: effects on densification, microstructure and thermo-physical properties. Mater Chem Phys 2009;113 (2–3):626–633.
- 50. Guo S-Q, Kagawa Y, Nishimura T, Tanaka H. Pressureless sintering and physical properties of ZrB2-based composites with ZrSi2 additive. Scr Mater 2008;58 (7):579–582.
- 51. Speyer RF. Oxidation resistance, electrical and thermal conductivity, and spectral emittance of fully dense HfB2 and ZrB2 with SiC, TaSi2, and LaB6 additives. Air Force Office of Scientific Research Report. Arlington, VA: Air Force Office of Scientific Research;2012.
- 52. Zhang XH, Wang Z, Hu P, Han WB, Hong CQ. Mechanical properties and thermal shock resistance of ZrB2–SiC ceramic toughened with graphite flake and SiC whiskers. Scr Mater 2009;61 (8):809–812.
- 53. Monteverde F, Savino R. ZrB2–SiC sharp leading edges in high enthalpy supersonic flows. J Am Ceram Soc 2012;95 (7):2282–2289.
- 54. Hu C, Sakka Y, Jang B, Tanaka H, Nishimura T, Guo S, Grasso S. Microstructure and properties of ZrB2-SiC and HfB2-SiC composites fabricated by spark plasma sintering (SPS) using TaSi2 as sintering aid. J Ceram Soc Jpn 2010;118 (1383):997–1001.
- 55. Hu C, Sakka Y, Tanaka H, Nishimura T, Guo S, Grasso S. Microstructure and properties of ZrB2–SiC composites prepared by spark plasma sintering using TaSi2 as sintering additive. J Eur Ceram Soc 2010;30 (12):2625–2631.
- 56. Guo S-Q, Kagawa Y, Nishimura T, Chung D, Yang J-M. Mechanical and physical behavior of spark plasma sintered ZrC–ZrB2–SiC composites. J Eur Ceram Soc 2008;28 (6):1279–1285.
- 57. Slack GA. Thermal conductivity of pure and impure silicon, silicon carbide, and diamond. J Appl Phys 1964;35 (12):3460–3466.
- 58. Slack GA. Nonmetallic crystals with high thermal conductivity. J Phys Chem Solids 1973;34 (2):321–335.
- 59. Watari K, Nakano H, Sato K, Urabe K, Ishizaki K, Cao S, Mori K. Effect of grain boundaries on thermal conductivity of silicon carbide ceramic at 5 to 1300 K. J Am Ceram Soc 2003;86 (10):1812–1814.
- 60. Burgemeister EA, Von Muench W, Pettenpaul E. Thermal conductivity and electrical properties of 6H silicon carbide. J Appl Phys 1979;50 (9):5790–5794.
- 61. Nakamura K, Maeda K. Hot-pressed SiC ceramics. In: Shigeyuki Somiya and Yoshizo Inomata, editors. Silicon Carbide Ceramics: Gas Phase Reactions, Fibers and Whisker, Joining. Volume 2, New York: Elsevier Applied Science; 1991. p 139–162.
- 62. Sigl LS. Thermal conductivity of liquid phase sintered silicon carbide. J Eur Ceram Soc 2003;23 (7):1115–1122.
- 63. Vasilos T, Kingery WD. Thermal conductivity: XI, conductivity of some refractory carbides and nitrides. J Am Ceram Soc 1954;37 (9):409–414.
- 64. Takeda Y. Development of high-thermal-conductive SiC ceramics. Ceram Bull 1988;67:1961–1963.
- 65. Watts J, Hilmas G, Fahrenholtz WG. Mechanical characterization of ZrB2–SiC composites with varying SiC particle sizes. J Am Ceram Soc 2011;94 (12):4410–4418.
- 66. Zhang SC, Hilmas GE, Fahrenholtz WG. Pressureless sintering of ZrB2–SiC ceramics. J Am Ceram Soc 2008;91 (1):26–32.
- 67. Ogihara S, Maeda K, Takeda Y, Nakamura K. Effect of impurity and carrier concentrations on electrical resistivity and thermal conductivity of sic ceramics containing BeO. J Am Ceram Soc 1985;68 (1):C-16–C-18.
- 68. Silva SRP. Properties of Amorphous Carbon. London: INSPEC; 2003. p 158–162.
- 69. Lide D. CRC Handbook of Chemistry and Physics. 88th ed. Boca Raton (FL): CRC; 2007.
- 70. Dasgupta T, Umarji AM. Thermal properties of MoSi2 with minor aluminum substitutions. Intermetallics 2007;15 (2):128–132.
- 71. Bai G, Jiang W, Chen L. Effect of interfacial thermal resistance on effective thermal conductivity of MoSi2/SiC composites. Mater Trans 2006;47 (4):1247–1249.
- 72. Neshpor VS. The thermal conductivity of the silicides of transition metals. J Eng Phys 1968;15 (2):750–752.
- 73. Snyder A, Quach D, Groza JR, Fisher T, Hodson S, Stanciu LA. Spark plasma sintering of ZrB2–SiC–ZrC ultra-high temperature ceramics at 1800°C. Mater Sci Eng A 2011;528 (18):6079–6082.
- 74. Wood C, Emin D, Gray PE. Thermal conductivity behavior of boron carbides. Phys Rev B 1985;31 (10):6811–6814.
- 75. Jackson HF, Lee WE. 2.13—properties and characteristics of ZrC. In: Konings JM, editor. Comprehensive Nuclear Materials. Oxford: Elsevier; 2012. p 339–372.
- 76. Weng L, Zhang X, Han J, Han W, Hong C. The effect of B4C on the microstructure and thermo-mechanical properties of HfB2-based ceramics. J Alloys Compd 2009;473 (1–2):314–318.
- 77. Weng L, Han W, Li X, Hong C. High temperature thermo-physical properties and thermal shock behavior of metal-diborides-based composites. Int J Refract Metals Hard Mater 2010;28 (3):459–465.
- 78. Brown-Shaklee HJ, Fahrenholtz WG, Hilmas GE. Densification behavior and microstructure evolution of hot-pressed HfB2. J Am Ceram Soc 2011;94 (1):49–58.
- 79. Guo S, Naito K, Kagawa Y. Mechanical and physical behaviors of short pitch-based carbon fiber-reinforced HfB2-SiC matrix composites. Ceram Int 2013;39 (2):1567–1574.
- 80. Monteverde F. Progress in the fabrication of ultra-high-temperature ceramics: “in situ” synthesis, microstructure and properties of a reactive hot-pressed HfB2–SiC composite. Compos Sci Technol 2005;65 (11–12):1869–1879.
- 81. Tye RP, Clougherty EV. The thermal and electical conductivities of some electrically conducting compounds. Proceedings of the Fifth Symposium on Thermophysical Properties; September 30–October 32, 1970; New York. Boston (MA): American Society of Mechanical Engineers; 1970. p 396–401.
- 82. Schneider SJ Jr, Committee AH. Enginered Materials Handbook, Volume 4, Ceramics and Glasses. Volume 4, Materials Park (OH): ASM International; 1991.
- 83. Zhang SC, Fahrenholtz WG, Hilmas GE. Oxidation of ZrB2 and ZrB2-SiC ceramics with tungsten additions. ECS Trans 2009;16 (44):137–145.