Professional investment advisers often draw on countless technical and fundamental analyses to justify their expertise in identifying value investments. Although there are many nuances to being able to invest like a professional, there are four primary pillars that any investor must be able to master and apply as you navigate to your eventual destination:
1. Understanding Yourself
2. Fundamental Analysis
3. Technical Analysis
4. Market Sentiments
When properly aligned, these four pillars will complement each other and help you to manoeuvre around and overcome obstacles that would otherwise impede your financial objectives. Do not discount the importance of any of these four factors, even though other experts may have personal preferences when applying their strategies. Although there is the age-old debate between technical analysts and fundamental analysts as to which group can better predict market movements, today’s technological advances mean that the man in the street has access to real-time information via smart phones or tablets. It is no longer a question of which camp can better predict price movements, but how best can we use the available information to execute trades.
This has already been covered at length in earlier chapters, but its importance must not be downplayed. You are the ‘driver’ of your portfolio and without you at the helm to make the key decisions, you will never reach your destination. Even if your investments are managed by professionals, you still call the shots. Understanding yourself is a key component in the equation and you need to find a proper balance to enhance your success.
We are constantly bombarded with daily news and events, and these bits and pieces of information can have a critical impact on the way our investments are executed. Fundamental analysis involves the interpretation of available information, be it past, present or forecast, and applying the results to your investments.
The challenge is to be able to filter the useful and meaningful information from the noise. Fundamentals cover a wide range of information from macroeconomic to geopolitical events and they can easily overwhelm anyone who does not know where and what to look for. The fundamentals that are applicable today may not be so in the future, hence our objective here is to build a foundation that you will be able to refine as you hone your investing and trading skills over time. To simplify the process, it is worthwhile to group fundamentals into the following categories:
• Economic indicators and data
• Interest rates
• Politics
• Central bank policies
• Commodities and international trade
• Industry and corporate performance
This group of information will significantly influence how an investor or trader strategises their next trade. As such, do not just look at the data but spend time to digest and understand its ramifications on the market and trades. Of the multitude of economic data that is regularly released by government statistics bureaus, independent statistics agencies and financial economists, the following indicators and data are frequently relied on:
This measures the overall value of goods and services produced by a given country’s economy within a period of time. GDP is reported on a quarterly basis and reflects the economic health of the country. Financial markets will often react when GDP data is released, especially when it is in line with forecast data. For example, a positive number in line with the existing forecast and an increase in the indicator over the previous quarter would suggest a growing economy, which is good for corporations and thus there could be a possible strengthening of the currency as the demand for the currency may increase.
The CPI is the benchmark indicator for inflation. All economies and governments seek to keep inflation at bay as it can have adverse effects on its currency. Runaway inflation has caused many third world and emerging nations to devalue their currencies as goods and services become increasingly expensive, such as in Brazil and Indonesia. In an economy that is dependent on imports, the government will try to strengthen its currency to reduce the cost of imports. As such, don’t look at the CPI as an overall number that is published on a monthly basis, but try to look into the detailed segments such as housing, durable goods, food and transport, as this will provide you with valuable insight as to how the government will react when applying its monetary policy at a consumer level. Many governments actively use interest rates to combat inflation, which will have direct consequences on foreign exchange or our investments, as we will discuss later.
On the flip side, inflation is not necessarily a bad thing as all healthy economies require a steady and manageable inflation level. For example, Japan’s ailing economy had been in a deflationary trajectory for almost two decades and it was damaging the overall financial and economic stability of the country. To counter a stagnant economy, Japan’s elected Prime Minister, Shinzō Abe, introduced a three-pronged strategic economic policy in December 2012. Now referred to as ‘Abenomics’, the policy targeted fiscal stimulus, monetary easing and structural reforms to stimulate inflation to a 2% annual rate. The markets suddenly took notice and in 2013, the Japanese stock market index rose by 54% and the currency weakened by 25% against the US Dollar, boosting the competitiveness of Japanese corporations.
The PPI is a collection of price changes from the perspective of the producers and how their cost is transferred to the consumer. With the PPI, we are looking at wholesale prices and it is a good indicator of where the CPI will be heading. The inter-relationship between the PPI and CPI will have a direct impact on the interest rates, inflation, monetary polices and how the economy will be steered as a result.
In the US, investors and traders often look at statistics such as new jobless claims reports, non farm payrolls and employment rate reports to assess the economic health of the country. When a country has a high unemployment level, the currency will likely be weak as spending will be weak, imports will reduce and overall productivity will fall. As cases in point, close to or over a quarter of the working population in Spain and Greece are unemployed and these struggling economies are weakening the Euro against other currencies.
The US Federal Reserve used inflation and employment level as a benchmark for its quantitative easing (QE) programme in 2012. In this instance, the US Dollar was intentionally weakened as the Federal Reserve pumped liquidity into the market to help the ailing economy.
Similarly, as unemployment in economies increase (as in the European nations since 2008), there will always be averse effects on the overall investment climate. The average investors will bear the brunt of the fallout if they do not adopt the right strategies.
Reported on a monthly basis, the PMI shows how strong the manufacturing sector of a given country is performing and gives an overall sense of the health of the country’s economy, i.e. it gives an indication of new orders, inventory levels, employment and deliveries. A PMI above 50 indicates an expanding economy while a PMI below 50 indicates a contracting economy. This is an important indicator for countries that have a strong export base such as the US, China, Japan and Germany. If the PMI strengthens, the local currency will also likely strengthen and corporate confidence will increase.
Until recently, economists did not care much about China’s PMI data. However, as China’s economy rapidly grew over the past decade to become the world’s second largest economy, its monthly data became a critical piece of data that affected the world’s financial markets.
Be it data on the number of new homes that have been built or housing applications or even the sale of existing homes, this big-ticket item shows the state of the economy and consumer confidence. When the housing market picks up, the durable and white goods (e.g. furniture and appliances) market follows suit. Consumer confidence rises and this ultimately affects interest rates, mortgages and financial loans. All these add up to guide the investor as to where the economy may be heading, as well as which sectors and/or corporations will be affected.
This data refers primarily to domestic goods that last for at least three years, such as cars, industrial machinery, household appliance, fixed assets and office equipment. When demand for durable goods increase, we know that the manufacturing economy is also on the uptrend. This indicates the health and confidence of the economy, and thus any significant movement or deviation will affect how the markets behave.
This is based on trade between countries and we tend to look at trade account surplus and deficit. Take for example the huge trade imbalances between the US and China over the last decade, where China gained trillions of dollars at the expense of the US because of the cheap goods imported into the US and weak currency exchange of the Chinese Yuan. This has led to the US blaming China for keeping the Yuan below its fair market value. As an investor, you need to pay close attention to trade payments and imbalances as governments who are dependent on exports have a tendency to keep their currency weaker than that of their trading partners.
Interest rates are typically the primary mover of the forex and stock markets, especially when all other factors remain constant—an increase in interest rate will generally bring about an appreciation of the currency and vice versa. As the increased spending brought about by the increased interest rates tapers off and there is generally less liquidity (supply of currency) in the market, traders will tend to bid up the value of the currency. On the other hand, central banks and government authorities often use interest rates as a tool to curb currency speculation or cool down an overheated economy or combat runaway inflation. In such instances, currency traders and investors need to take a step back as there may be a further deterioration of the currency or its effects on the economy as the country is awash with too much liquidity, which will offset the benefits of higher interest rate hikes.
Although there is some direct correlation of interest rate change to the appreciation or depreciation of a given currency, what is more important is that the direction of change in the interest rate signifies the future and expected monetary policy of the central bank. Knowing the intention of the interest rate change will dictate how investors anticipate the market direction and apply the appropriate strategies. For example, if the central bank indicates a continued rise in interest rates to ensure that the economy does not overheat and steadily acts on a 0.25% increase in each quarter, there is a high probability that the currency will appreciate. Subsequently, increasing interest rates may aversely hamper the financial borrowings of corporations and increase their financial costs while boosting the interest income of banks.
Sometimes, the mere mention of a possible fall in interest rates or even no action by the central bank when the market is expecting a cut in interest rates may spook the currency market into taking action to appreciate or depreciate the currency or affect market sentiments. So do bear in mind that traders’ expectations and perceptions of where interest rates are heading will ultimately dictate the overall performance of any investment.
An important aspect of investing is knowing what the key trigger points for each respective class of investment are. For example, currency trading is affected primarily by macro events such as the performance of a country’s economic indicators, while shares take a more micro view where their value is affected by the company’s performance.
Politics plays an important role in our daily lives and when the correct leadership is at the helm, everything seems to be smooth sailing and our overall wealth tends to increase. When politics becomes messy and confrontational, the negative effects usually flow downstream and affect all segments of our lives, including our nest eggs. In 2012 alone, politicians across the world in Europe, the US and Asia influenced overall economic growth simply by being indecisive. In Europe, we witnessed the changing of presidents in Italy, Greece and France as a result of the Euro crisis, as well as the failure of European governments to bail out depressed European economies that caused the Euro to be in a downward spiral. In Japan, the news of a pending change in the government and subsequent election of the Liberal Democratic Party into power finally allowed the Japanese Yen to weaken against the US Dollar after persistently being trapped in a high trading range throughout the year. We have also witnessed the two US political parties, the Democrats and the Republicans, biding their time to see who will give in to avoid bringing the country over the ‘fiscal cliff’.
We know that politics and monetary policy decision makers are not the best partners and are usually a toxic combination as each tends to have their own specific agenda. So learn to digest the information churned out by politicians if you want to benefit from it. Keep your antenna tuned to the politics of the country you are investing in as the minute there is a hint of any political uncertainty or change in policy, and if it is not aligned with market sentiments, the markets will rally.
Except for the Federal Reserves in the US, we tend to overlook the importance of the central banks in influencing the monetary policies and stability of the currency in their respective country. We see central banks as an extension of the ruling government and any decision tends to be biased and heavily influenced. However, the central banks’ role is not only to govern financial institutions but to ensure that its monetary policies are in the best interests of the country as it affects individuals, and more importantly, the strength and stability of the currency.
The policies of the US Federal Reserves have far reaching impact across the world. When it introduced its quantitative easing packages following the 2008 financial crisis to boost the US economy and market confidence, its policy of pumping more liquidity or simply printing more US Dollars considerably weakened the dollar against most currencies. This essentially made US exports cheaper compared to other exporting nations. Even though there is an European Central Bank in Europe, its powers and influence has been diminished as each member nation has its own central bank that governs its respective domestic monetary policies. However, the European Union forged ahead with a single central bank in late 2012, which has had a significant impact on currency traders. Only when you truly understand the influence of central banks in relation to the currency pairs you are trading in, can you better forecast the next step to take.
It is common for investors to ditch currencies and equities and switch to gold or other precious metals during times of uncertainty or economic turmoil. Subsequently, if a country’s trade balance is widely skewed against its ability to meet payments—i.e. where its imports are relatively higher than exports, so much so that the government is running a huge deficit—the consequences can be disastrous, as in the case of the economic crisis experienced by many European economies.
We should never underestimate how issues that may not seem directly related to your investment portfolio can affect your decisions. Have you noticed how commodities such as oil, gold, coal, gas etc. are all quoted in US Dollars? Most contracts or letters of credit for international trades will state the amounts in US Dollars. Since the US Dollar is used as a base currency, spikes in commodity prices such as oil can affect a country’s currency exchange value or even at a micro level where a company’s survival depends on being able to market its products at competitive prices. So is your investment denominated in a local currency or are you holding shares in a company that is directly correlated with international trade?
The financial crisis in 2008 caused a fall in worldwide production, which meant a decrease in demand for oil and other fuel products, and thus a weaker US Dollar. Exports from Asia to the West also decreased as a result of the ripple effects, even though Asian economies were relatively stable.
Australia, which is rich in mineral resources, saw its currency appreciate during the financial crisis as there was a high demand for commodities (such as iron ore, thermal coal, gold and alumina) from emerging markets like China and India. When there is a rise in demand for a country’s goods and services, we see a correlating appreciation in the currency.
Depending on the composition of your investment portfolio, it might also be prudent to pay attention to events on a micro level, such as what is happening in a related business sector or even the performance of the company itself. If you are investing in real estate or equities, you would definitely want to know the overall performance of the company in terms of management, financial health, quarterly earnings such as its earnings per share or return on equity, quality of products and even expected new property or product launches.
We often look at the big picture and neglect the finer details, which could mean missing out on a valuable gem amid the chaos, or failing to spot the potential dangers of an investment. Investing in real estate is extremely costly as it requires a large initial financial downpayment. Even a purchase in a prime location does not guarantee a profitable return as buyers will also consider other factors such as the developer or the current condition of the property sector. Property with a developer that is known for substandard quality will often command a much lower rental or resale value.
Fully understanding and anticipating what is happening or brewing in a particular sector or company can make a big difference to your investment. For example, although the mobile phone industry has generally been a growing sector over the last two decades, the top individual companies have been constantly replaced. The likes of Motorola or Ericsson in the early 1990s were replaced by Nokia and Blackberry by early 2000, and now Apple and Samsung have taken the lion’s share of the markets, leaving all other companies struggling to break even. When a particular niche or dominance is achieved by a company despite the overall macro economic scene showing weakness, there are still opportunities to maximise your investments.
Quick visual images will help to capture an investor’s attention. This can be in the form of technical analysis such as trend lines, price chart movements and moving averages. Each form of market analysis has its own merit, be it in chart or written form, so use what is available to your advantage. The prices of any investment do not move in a straight line, otherwise it would become predictable and no one would benefit. The cyclical movements and its peaks and troughs give insight to the market behaviour, so it is important to learn how to analyse and interpret them in order to anticipate the future movements of the investment.
Presenters on business news programmes often conduct interviews with expert technical analysts on their views as to where a particular type of investment is heading, where the resistance levels are or even correlating the current price ranges to historical events. As markets often trade in a logical manner and our trading styles and preferences tend to be habitual, there is a tendency for our investment strategies to follow a similar trading pattern.
No matter which chart you use, be it a bar, line or candlestick chart, the basic questions most traders ask include the following:
Knowing what is happening in the financial market allows us to apply the correct strategies to our investments.
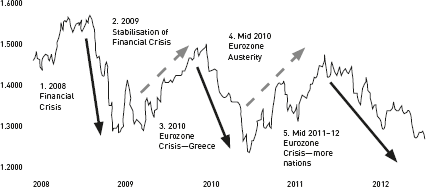
Let’s look at a five-year EUR/USD chart as a case in point. Since the 2008 financial crisis, the Euro has been weakening as it has been hit by one crisis after the next. Obvious signs of a bear run can be seen in the chart below (points 1, 3 & 5), each lasting longer than the previous. With this in mind, your strategy might be to take a mid-term view of holding a short position on the Euro or buying the Euro on short rebound and exiting quickly as the markets usually make a fast turnaround. Similarly, as the economy goes through a volatile cycle, the composition of your investment portfolio will change to maximise its earning potential or minimise its losses; for example buying real estate when the property market dips considerably or allocating a greater percentage to gold during a currency turmoil.
Whether we are in a bull or bear cycle, a key point to take note of is which stage of the cycle we are in. If we are at the start of the bull cycle, the probability of the bullish players getting the upper hand is higher (steeper upward curve). When mid-cycle, we may see more sideways movement in the charts where the bull and bear players jostle for position. As we move closer to the end of the bull run, the trading pips—or price differentials—between buying and selling narrows and you will notice more resistance in the market as it tries to push for new highs, and intraday movements will reflect prices pushing for lower levels, even if they are only slightly lower.
In addition to cycles, look out for the formation of trends that allow you to predict where the investment will be heading and to capitalise on it. Using the Eurozone crisis as an example, given that there is no clear-cut solution and more European nations are enforcing stringent austerity programmes, there is a much higher probability of the Euro weakening further or an exodus from the market to safer assets beyond the region.
Traders will always try to buy low and sell high, and one way to identify high and low points is to look at resistance and support levels in the charts. Regardless of the type of chart, the general characteristics are similar for all investment types.
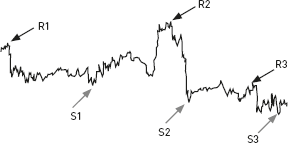
The resistance level is the point at which traders deem the current price to be expensive or feel that the majority of traders will not buy at such a price; hence there is a resistance for the price to rise further (e.g. points R1, R2 and R3 of the currency chart below). Generally, the resistance level is the highest point before the price begins to drop.
The support level is the point at which traders feel that the current price is cheap and it gets the attention of buyers to support the buying at the low price level as they feel the price will not fall further (e.g. points S1, S2 and S3). The support level is generally the lowest point before the price begins to rise.
When the resistance or support level is not breached with substantial market conviction, a u-turn normally takes place, so be very cautious when alarm bells are sounded at these levels.
Using resistance and support levels as a baseline, traders will try to enter and exit at these preset levels. However, it is not always possible to hit the highest selling price or the lowest buying point, so it is normal to buy or sell several pips or price levels above or below the support or resistance levels.
If the market rallies above the resistance level or falls further than the support level, you will need to realign your strategy. When the market pushes through the support level and you have entered into a position, the worrisome part is deciding the point at which you get out to close the position. This is when you need to study the charts thoroughly to determine if there was ever a lower level or if you are going into unchartered territory. As a rule, don’t take unnecessary risks, so close the position if it exceeds your risk tolerance level.
When we are looking for a trend, it is best to keep it simple and moving averages provides such an option. It is a definitive measurement as we can mathematically compute the way the asset performs within a defined period. The following are some commonly used moving averages:
A Simple Moving Average (SMA) is the most common form of moving averages and it is calculated by taking the sum of the currency’s closing prices for the most recent N time periods and then dividing this number by N. For example, if you want to view a 20-period average, simply take the sum of the 20 most recent closing prices and divide them by 20.
Although a SMA is considered as a lagging indicator and not a predictive chart since the measurement is based on closing prices, it is an important analysis as it smoothens out the wide volatility swings and makes it easier to identify the points of entry and exit in each currency pair cycle.
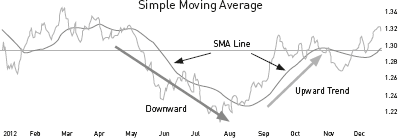
In the EUR/USD SMA chart on the following page, the SMA line shows a trend during the chaotic period from May to August 2012. The Eurozone nations were in a disarray over the managing of the Greek bailout fund, and when Spanish and Italian bonds were being refinanced at extremely high yield, there is a noticeable downward trend from 1.33 to as low as the 1.20 level. The Euro only gained strength in mid August, after there was firm commitment from the European Central Bank and European nations to support the ailing nations.
Using the SMA, it is clear where the resistance levels are in a downward trend and where support levels will be in an upward trend. When price levels tend to hover at SMA levels, you may want to take a step back until a clear trend line is formed.
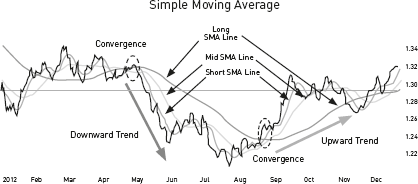
Traders will sometimes use three SMA lines to get a clearer trend analysis, i.e. a short SMA of 7 periods, a mid SMA of 20 periods and a long SMA of 60 periods. When the three lines converge and subsequently start to fan out and move in the same direction, it is clear that a trend is forming. This can be seen in the chart on the next page where there is a convergence of the three SMA lines in May 2012, followed by a downward fan out that indicates the distinctive start of a downward trend. Subsequently, the three lines converged again in September and fanned out upwards, indicating a distinctive upward trend.
As in the chart, the ideal case in an upward trend is for the short SMA to be above the mid SMA, and the mid SMA to be above the long SMA. The downward trend will be the opposite of this. When the lines deviate from this ideal scenario, it best to pause and gather more information before committing to the trade. SMAs are primarily used to detect trends and have limited use in accurately predicting when to trigger a trade, but at least they will help to minimise the risks.
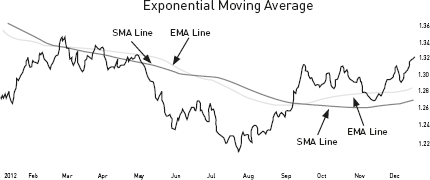
An Exponential Moving Average (EMA) differs slightly from a SMA as it tends to give extra weightage to more recent price data, thus eliminating the time lag in a SMA. This allows traders to use present price levels to track and respond more quickly to recent price trends. You will notice in the chart below that the EMA line tends to be a closer reflection of the price levels that are traded.
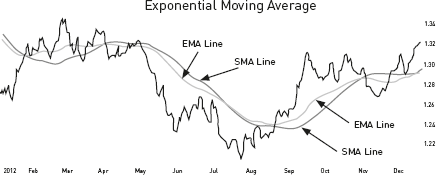
Although an EMA is more responsive to current price movements, it can sometimes distort the overall picture by underweighting past data that may have significant importance on predicting future market price movements. This means that we may unknowingly skew the outcome. As the periods increase (from say 20 to 200) when using SMA and EMA, the disparity between the two technical analyses will grow wider as there will be more variables and volatility may have to be discounted (see chart below). This is why technical analysts may add more filters to personalise their EMA charts so as to be able to better predict the markets.
Note that while SMA and EMA provide you with the general direction of the trend, daily prices will fluctuate and they will never be a straight upward or downward line. Most traders will use ‘pullbacks’ to enter or exit the market. For example, if the Euro is seen to be weakening and a clear downward trend is formed in the chart, the trader will probably wait for the Euro to strengthen slightly as a signal to get ready to enter the market and go short on Euros when the next price fall begins.
Bollinger bands are used to measure market volatility and standard deviations, and are based on simple moving averages. When the bands are close together, the market is said to be quiet or to have low volatility. When the bands move wider apart, the market is said to be active and market volatility is high. It is usually set at a default spread above and below a 20-day simple moving average by two standard deviations.
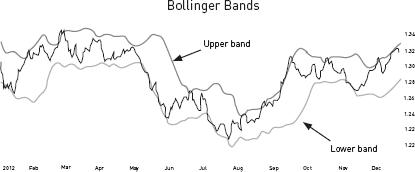
One point to note is that the bands technically act as resistance and support levels—when the price touches the upper or lower bands, it has a general tendency to be pushed back towards its middle price level. It is a good tool to use in a range bound setting to identify possible trend setting.
If prices stay close to the boundary limits of the higher band, chances are that we will see an upward trend forming and vice versa when the lower band is being tested. When the price hovers at the mid range, it would be advisable not to take any action and to observe the market (see chart on the following page). When used with other indicators, the bollinger bands help to identify entry and exit points in a trade.
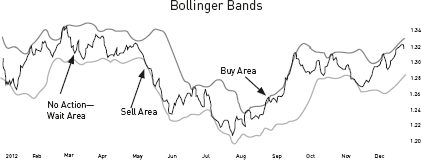
When the price is testing the upper boundary of the band, do be cautious and ensure that it can be supported and allow for a slight retraction before buying. However, I recommend that you be ready for a quick exit when the price starts moving downwards past the mid-point of the band. It is always better to lock in the profits early even though it may be small, instead of being stuck in a range bound situation and having the funds tied down, or even worse, being caught in a loss-making position.
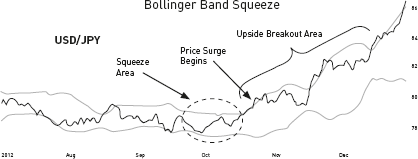
A commonly used basic strategy is the Bollinger Band Squeeze. It occurs when the bands narrows and volatility falls to low levels. Even though the narrowing of the bands will not indicate the direction of the price movement, it usually signifies the ‘calm before the storm’ and, in this case, a possible rise or fall in the forex rates.
In the example above, the USD/JPY prior to mid October 2012 was range bound for a period of time and as news of the Japanese election started to filter in, there was a sudden strengthening of the USD against the JPY.
In summary, pay attention to:
• A contraction of the bands.
• A decline in volatility level.
• A break in the band that indicates a new move, i.e. a break above the upper band means an advance in price and a break below the lower band means a decline.
• Use other sources to validate the market sentiment and the breakout from the ‘squeeze’.
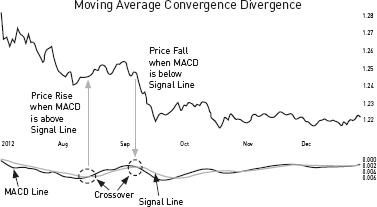
The commonly used MACD chart is an effective trend and momentum indicator that is simple to use and analyse. It uses two trend indicators, a 12-period EMA minus the 26-period EMA to create the MACD line, and a 9-period EMA is plotted against the MACD line to act as a signal line to identify the crossover points. The values of 12, 26 and 9 are the default settings used with the MACD, however other values can be used to suit your trading style and analysis.
As the MACD fluctuates, traders can identify possible trends, although it is not useful for identifying overbought and oversold levels. When the MACD line is above its signal line, it indicates a positive or rising trend and vice versa.
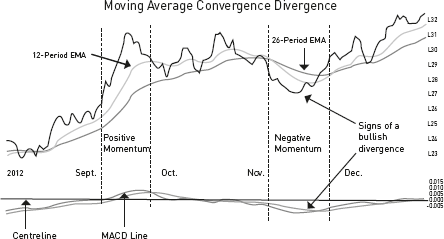
The MACD line oscillates above and below the centre line. If the 12-period EMA crosses above the 26-period EMA, it reflects a positive MACD and if the divergence between the two EMA increases, this means an upside momentum is forming and vice versa should the 12-period EMA be below the 26-period EMA.
The MACD indicator is easy to use and effective because it brings together momentum and trend in one indicator. Here are several points to note when using the MACD chart:
• The MACD line is calculated using the actual difference between two exponential moving averages, which means that there is still a lag factor to consider.
• A bullish divergence forms when a price dips to a lower low and the MACD forms a higher low. The lower low in the price affirms the current downtrend, and when the low in the MACD (as long as the MACD remains below the centreline) starts to show less downside momentum, the chances of a trend reversal or an upside rally is high. The reverse is true for a bearish divergence.
• The value of the underlying currency pair will determine the range of the MACD value. For example, an exchange rate of 1.5 may reflect the MACD value of +0.05 to -0.05, while an exchange rate of 7 may reflect the MACD value of +1.00 to -1.00. As such, do not compare MACD values when the exchange rates differ.
• Do remember to validate the current market sentiment before committing to the trade.
This is the invisible force behind many of our investment decisions and even though it is not rocket science, many of us simply prefer to go with the flow without a second thought.
For the rookie investor, adopting a strategy based purely on general market sentiments can be a dangerous minefield since the reliance is on a majority consensus instead of using concrete information to one’s advantage. Key market players can easily influence the general opinion of the majority, especially when there is no clear direction or the markets are uncertain how events are going to play out.
We have often seen how financial markets are pushed to unrealistically high levels on pure optimism or take a dive as they are rattled by unsubstantiated pessimism. For example, we saw how the world’s emerging stock markets suddenly took a dive after the casual comment from the US Federal Reserves chairman regarding the possible ‘tapering’ of its Quantitative Easing programme in May 2013. The news media had a field day with it, as did the ‘experts’ who painted a relatively negative scenario, and the markets simply allowed the pessimism to snowball. ‘Tapering’ was suddenly the buzzword used to explain or to be associated with a downturn in the markets. When the actual announcement to begin QE tapering was made seven months later, there was relative calm in the markets. So do you move with the general consensus or enhance your portfolio with quality assets that have been oversold?
Market sentiment is generally associated with the current mood or gut feeling or the perceived attitudes of the investors and traders within the respective markets. When breaking news is reported in the media, market sentiment will often undergo the following three behavioural phases:
1. Matching Expectations
2. Market Digestion
3. Market Consensus
This is the initial reaction to the news release. The closer the information is to the forecast expectations of the experts, the less volatility will be reflected in the asset prices since it is already factored in and market sentiments remain predictable. However, if the data deviates from expectations, market makers will dictate the price direction while smaller investors will follow as a knee-jerk reaction. This causes a noticeable spike, either as a sign of panic, or as investors capitalise on immediate gains until phase 2 kicks in.
When market players have had sufficient time to analyse and digest the possible implications of the information on the markets, there will either be a market correction or the shift will continue on its intended trajectory. However, the markets can still be in a relatively fragile or fluid state at this stage as any additional information can flip the overall sentiment. Remember that it takes just one comment or contradicting statement to change market sentiment, as was seen during the Euro crisis—the financial markets would try to rally on the slightest positive news, only to reverse its position when market sentiment was not convinced given the political gridlock.
In times of uncertainty when every ‘expert’ seems to have a differing opinion as they interpret the information, gamblers will try to exploit the situation to their advantage. For most retail investors, this is not the time to adopt a herd mentality and to enter into a position without definitive information. Take the time to read the situation and when in doubt, step away and watch how it plays out.
It is human nature to feel more secure in numbers and investors often prefer to gravitate towards a majority consensus rather than taking a minority stance. Where firmer market consensus is formed over a longer period of time, the value of the investment will often move in direct correlation. Unfortunately, any seasoned investor knows that a popular sentiment can be a double-edged sword. For example, the Facebook IPO launch in 2012 was one of the most anticipated events in the technology industry and market sentiment was so hyped up that most investors thought that there was a big profit to be made within the first month. However, we saw its share price tumble to as low as 50% before recovering a year later.
Successful billionaires such as Warren Buffett and Donald Trump have often quoted the dangers of investing on the back of a positive charged bull market rally and retreating in fear on hearing negative news. These highly successful billionaires apply this basic principle to their advantage by staying on the sidelines when market sentiments get heated up and entering when sentiments cool down in order to pick up bargains. One reason for the mediocre performance of average investors is that we allow market sentiments to dictate and influence our ability to make objective decisions. By following the pack, we tend to lose out on the best ‘early bird’ deals, where purchase prices are off their lows and sales are off their highs.
This does not mean that investors should always take a contrarian approach, especially when the market signs point to a undeniable trend, such as when the Japanese stock market had a fantastic year in 2013 with a 54% rally following the nomination of Shinzo Abe and the introduction of ‘Abenomics’, or when gold prices were predicted to fall by early 2012. Market sentiment is a powerful indicator when put into proper perspective in terms of gauging the current risks and rewards.
There will always be three parties or opinions to every investment—the optimists, the neutrals and the pessimists. Market sentiments provide a baseline from which to assess current market conditions and to challenge or make sense of the available information. Once you have carefully deliberated your options, your confidence should guide your decision instead of fear or complacency.