■ Definition: The long-run marginal cost (LMC) curve shows the marginal cost of producing each additional unit of output when the firm is free to vary the inputs of all factors of production. As you should by now expect, the LMC lies below the LAC when the latter is falling, and it lies above the LAC when the latter is rising. In fact, LAC falls precisely because the LMC lies below it, pulling down the average cost. Similarly, LAC rises precisely because the marginal units cost more than the average to produce.
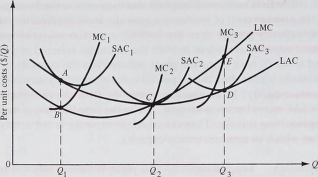
In Figure 6-10 we show the LMC associated with a particular LAC curve and three short-run cost situations. Notice that at output level Q,, the short-run average cost is equal to the long-run average cost at point A. It follows that short-run marginal cost must equal LMC at this output level, since the two averages have converged upon each other precisely because the two marginals were converging on the same value (at point B). Similarly, at output level Q 2 we have SAC 2 = LAC = LMC = MC 2 . We know that the LMC must pass through the minimum point of the LAC curve and that the short-run MC must pass through the minimum SAC point. Since SAC = LAC at
234 Production and Cost Analysis
FIGURE 6-10. Long-Run Marginal Costs and Their Relationship to Other Cost Curves
the minimum points of both, we have the above four-way equality. Finally, at output level £) 3 , average short-run and long-run costs are equal at point D, because marginal short-run and long-run costs are equal at point E.