It has been observed in particular production processes that the average costs per unit tend to decline over time as the factors of production learn the production process and become more efficient. K. J. Arrow called this relationship “learning by doing,” and empirical studies have shown that costs per unit in many manufacturing processes do exhibit a downward trend (in real terms) over time. 10
■ Definition: The learning curve , also known as the experience curve, is a curve relating the cost per unit of output to the cumulative volume of output since that production process first started. Empirical studies indicate that unit costs tend to decline by a relatively stable percentage each time the cumulative output is doubled."
I0 K. J. Arrow, “The Economic Implications of Learning by Doing,” Review of Economic Studies , 29, No. 3 (1962). See also J. R. McGuigan and R. C. Moyer, Managerial Economics, 2nd ed. (St. Paul, Minn.: West Publishing Co., 1979), pp. 273-77; and “Selling Business a Theory of Economics," Business Week , September 8, 1973, pp. 86-88.
"See Perspectives on Experience (Boston: Boston Consulting Group, 1970).
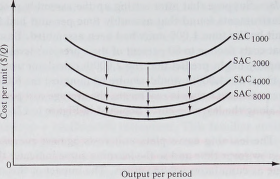
Example: Suppose that after setting up the assembly process for a new calculator, Texas Instruments found that assembly time per unit had fallen to 100 minutes for each unit by the time 1,000 units had been assembled. Based on its previous experience that costs decline to 80 percent of their previous level each time output doubles, the company might predict that the 2,000th calculator would require 80 minutes assembly time; the 4,000th would require 64 minutes; the 8,000th 51.2 minutes; and so on. Given constant wages in real terms, the average cost per unit would be expected to decline along the learning curve depicted in Figure 6-12.
Note: The learning curve plots unit costs against cumulative output. Cumulative output grows over time and so the learning curve indicates that unit costs will decline over time as cumulative volume grows. The impact of this on the firm’s SAC curves, which indicate costs per unit for different rates of output per period of time, will be to cause the SAC curve to sink downward as cumulative volume grows (and time passes). In Figure 6-13 we show the firm’s SAC curves sinking downward as cumulative volume (indicated by the subscript to SAC) increases.
In terms of production and cost theory, the learning curve (and its manifestation as a sinking of the short-run cost curves over time) can be explained as a continuing improvement in the productivity of the variable inputs, given constant input prices. From one month to the next, the marginal product curve for the variable inputs shifts up, causing the marginal cost curve to shift down, bringing with it the AVC and SAC curves. Note that the learning effect is greatest when a production process first starts, and it diminishes as time passes. Mature production process will find very little learning effect, and subsequently the downward drift of the short-run cost curves from one month to the next will be negligible. Conversely, for new production processes (such as for the production of a new product, or a new way to produce an existing product), we
FIGURE 6-12. The Learning Curve: Declining Average Costs as a Function of Cumulative Output
FIGURE 6-13. Impact of the Learning Curve on the Firm’s SAC Curve
should expect the learning effect to cause a significant downward movement in the short-run cost curves from one month to the next, until cumulative production grows to the level where the learning curve becomes relatively flat.