■ Definition: The internal rate of return (IRR) is the rate of discount that reduces the present value of the income stream to equality with the initial cost. It can be shown symbolically as
C ° t =1 (1 + i)> (15-2)
where the only symbol different from equation (15-1) is i, which represents the internal rate of return.
Note that the internal rate of return will be that rate of discount which reduces the net present value of the income stream to zero. In the previous example we know that the internal rate of return exceeds 10 percent, since the net present value is positive at 10 percent. It will take a larger rate of discount to reduce the net present value to zero. We can calculate the internal rate of return for a given project by a process of trial and error. (This method beats attempting to solve a polynomial function of degree n.)
Example: In Table 15-3 we show the process of iteratively calculating the net present value at various discount rates, zeroing in on the rate of discount that reduces the net present value to zero. We start by testing for the value of net present value at the discount rate of 20 percent. This procedure leaves a net present value of $437.64, indicating that it requires a larger discount rate to reduce net present value to zero. We
Table captionTABLE 15-3. Calculation of the Internal Rate of Return
Year | CFAT | NPV @20% | NPV @25% | NPV @23% | NPV @23.2% |
0 | $-10,000 | $-10,000.00 | $-10,000.00 | $-10,000.00 | $-10,000.00 |
1 | 6,440 | 5,364.52 | 5,152.00 | 5,235.72 | 5,227.27 |
2 | 4,440 | 3,081.36 | 2,841.60 | 2,934.84 | 2,925.24 |
3 | 3,440 | 1,991.76 | 1,761.28 | 1,847.28 | 1,839.61 |
$ 437.64 | $ -245.12 | $ 17.84 | $ -7.88 |
'See R. E. Hall and D. W. Jorgenson, “Tax Policy and Investment Behavior,” American Economic Review, 57 (June 1967), pp. 391-414.
then try a discount rate of 25 percent and find that the net present value at that discount rate is negative. Thus the internal rate of return lies between 20 and 25 percent. We try 23 percent and find that the net present value is $17.84. Clearly, a slightly larger internal rate of return is indicated, and we try 23.2 percent in the last column of the table to find a net present value of a mere —$7.88. Further iterations would show the internal rate of return to be precisely 23.1415873 percent. 2
Rule: The IRR decision rule is that projects with an internal rate of return greater than the opportunity rate of interest should be accepted and implemented by the firm. Given the availability of investment funds, investment in various projects should be taken to the point where the internal rate of return on the last project accepted just exceeds the cost of capital (the opportunity rate of interest for that project). Note that this decision rule is equivalent to the NPV rule that says to accept any project for which the NPV (when discounted at the opportunity rate) is above zero.
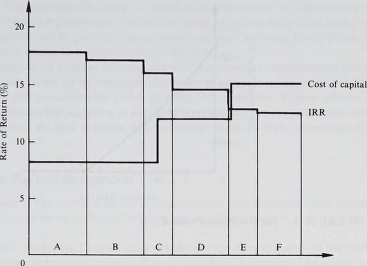
Example: In Figure 15-1 we show a series of investment projects as the blocks A, B, C, D, E, and F. These investment projects are ranked in order of their internal rate of return, which represents the height of each block, and the width of each block represents the amount of capital required for the implementation of each project. The top of these blocks, shown as the heavy stepped line, is the curve relating the IRR to the level of investment expenditure.
The cost of capital to the firm is also likely to be a step function. Initially the firm will be able to utilize internal funds (undistributed profits), and the cost of these funds is their opportunity cost. That is, these could be invested elsewhere at a level of risk similar to that involved in holding the funds as undistributed profits, and the firm would wish to receive at least that rate by utilizing these funds in the proposed investment projects. After a point, however, the internal funds will be exhausted and the firm will need to borrow on the financial markets. We must expect the rate for such borrowing to exceed the opportunity cost of using internal funds, since the market will view the firm as involving at least some degree of risk. In Figure 15-1 we indicate that the firm’s opportunity rate on internal funds is about 8 percent and that the firm can then borrow from the market (up to a point) at around 12 percent.
As the firm continues its borrowing in the financial market, however, the market will recognize the change in the financial structure of the firm and will at some point wish to impose a higher interest rate on loans to the firm. The greater debt-equity ratio (leverage) of the company as it continues to borrow in the market causes the firm to be a more risky proposition in the eyes of lenders. There is now a greater risk of default on the loans, and hence subsequent borrowing by the firm will take place only at a higher rate of interest. In Figure 15-1 we show the higher rate of interest demanded by bor-
2,n case y° u are wondering how many iterations it took to find that answer, I must confess that my calculator is preprogrammed for the IRR calculation. Such calculators are becoming increasingly available at moderate cost and are, I think, an essential part of the business student’s tool kit.
Level of Investment Expenditure
FIGURE 15-1. Determining the Level of Investment Expenditure
rowers to be in the vicinity of 15 percent. The top line of the blocks, which represents the availability of funds, may thus be regarded as the cost-of-capital line. It can be seen that projects A, B, C, and D promise an internal rate of return greater than the cost of capital, while projects E and F promise lower rates of return which do not compensate for the cost of capital. Thus the firm in this particular situation would be advised to undertake projects A to D only.