CHAPTER 15
INCOME DISPARITY
“The Walton family of Walmart fame is wealthier than the bottom third of the US population.”1
BEN FUNNELL,
Financial Times, June 30, 2009
“Conservatives need to recognize that the most pernicious sort of redistribution isn’t from the successful to the poor. It’s from savers to speculators, from outsiders to insiders, and from the industrious middle class to the reckless, unproductive rich.”2
ROSS DOUTHAT,
New York Times, July 11, 2010
“… none of the changes seem transitory. The middle of America’s labour market are likely to become ever more squeezed.”3
Economist,
June 17, 2006
“US labor compensation is now at a 50-year low relative to both company sales and US GDP.”4
MICHAEL CEMBALEST,
Chief Investment Officer, JP Morgan Chase Eye on the Market, July 11, 2011
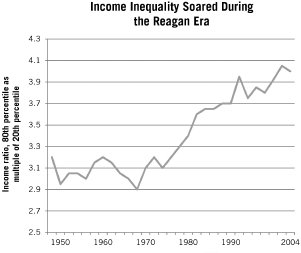
The skewed allocation of the gains from growth in recent decades in America has reasserted the traditional extractive pattern common prior to the Industrial Revolution as outlined by economists Doran Acemoglu and James Robinson. It caused American income disparities to widen noticeably. Some of the most extensive contemporary research on US income inequality is by Larry Bartels of Vanderbilt University. Chart 15.1 is reproduced from his 2008 book, Unequal Democracy. During the golden age, income inequality remained relatively stable, with incomes at the 80th percentile of the income spectrum about three times greater than at the 20th percentile.

Chart 15.1.
Source: Larry M. Bartels, Unequal Democracy, fig. 2.2.
This stable pattern began to deteriorate in the late-1970s due to inflation, a cyclical event. But once the Reagan era began, that change was dramatically exaggerated because of structural factors such as wage compression. The outcome is an American income distribution resembling that of a developing nation.
American Income Disparity Is the Worst Among Rich Democracies
One of the first scholars to detect the impact of Reaganomics on income disparities was economic historian Paul Kennedy; as early as the mid-1980s, he wrote, “The ‘earnings gap’ between rich and poor in the United States is significantly larger than in any other advanced industrial society.”5 Another was economic historian Kevin Phillips, who concluded in 2002, “Among the major Western industrial nations, it was the United States—its revolution 225 years distant—that now has the highest level of inequality.”6 Kennedy and Phillips have proven prescient: income disparities have widened by about 25 percent since 1980.7
There’s great irony in that change. America was settled by Europeans fleeing the limited-income opportunity exemplified by the early industrial revolution’s Dickensian income pattern, where legacy capital owners, landowners, and emergent entrepreneurial tycoons dominated income flows and wealth. Those early immigrants to America would be dismayed to learn our generation has voted repeatedly to allow a reincarnation of that system two centuries on.
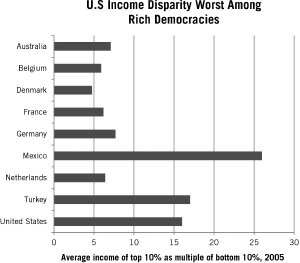
How much of an international outlier is the US income distribution? The answer is presented in Chart 15.2, reproduced from statistics compiled by the OECD. For each dollar of income received by the poorest 10 percent of Americans in 2005, the richest 10 percent received $16 dollars. That disparity is comparable to the income distribution in Turkey and nations (not shown) such as Bulgaria, Cameroon, Ivory Coast, Jamaica, Uganda, and perhaps Rome after the fall of the Republic in 49 BCE—economies dominated by thin layers of the traditional historic extractive elite. The American multiple is twice as severe as any other rich democracy. As the Economist magazine noted in June 2006, the exaggerated American income distribution is nearly halfway to the range typical of nations such as Brazil, “notorious for the concentration of income and wealth.”8 And, the Gini Coefficient measure of inequality shows that the American income distribution is even more skewed than a number of other middle-income nations like Egypt and India.9

Chart 15.2
Source: “Are We Growing Unequal?” OECD, table 1, October 2008.
Income disparities in some other rich democracies such as Germany have grown slightly more exaggerated in this period, but the extreme scale and the pace of the American income disparity in recent decades sets the United States apart. Even those Anglo-Saxon nations most resembling the United States in culture and ethnic background, such as Australia or Canada, have income distributions resembling Austria, Germany, or France rather than Turkey or the United States. There are millions of wealthy individuals in the family capitalism countries, but their advantage over their countrymen is markedly less than in the United States. In the mid-2000s, for example, the share of pretax national income received by the top 1 percent of earners was 5.6 percent in the Netherlands, 6.3 percent in Denmark and Sweden, 9.8 percent in Australia (2007)—but 17.4 percent in America.10
This American exceptionalism is a consequence of wage stagnation, in contrast to widely broadcast prosperity up and down the population distribution in these other nations. The average income of the bottom 90 percent of Australian households rose 30 percent in real terms from 1980–2007, for example, while it rose a bare 2 percent for the bottom 90 percent of American families.11 That is, the bottom 90 percent of Australian households received as much income gain every two years as that identical cohort of Americans received over the entire 27 years of the Reagan era. The statistics from Canada are similar. In 1970, the distribution of family incomes in Canada was only slightly more even than in the United States. But by 2000, historian James W. Loewen, professor emeritus at the University of Vermont, noted that American income inequality had deteriorated sharply, and “was much greater than Canada’s; the United States was becoming more like Mexico, a very stratified society.”12
There is nothing innate about the American economic structure, geography, globalization, its peoples or other physical, ethnic, or cultural attributes that account for widening income disparities in recent decades. It is solely the consequence of Reaganomics.
The Gilded Age Reincarnated
To find analogous periods of such wide income disparity in the United States, we must search the early Belle Époque or the ensuing Gilded Age. Then, as now, America was characterized by regulatory capture and economic sovereignty resting with firms. Here is how historian James MacGregor Burns described the Roaring Twenties:
“Collaboration among capitalists, politicians, and justices was a defining feature of the Gilded Age…. A president’s use of his appointing power on behalf of powerful economic interests … [was] not an exception in the Gilded Age but the rule.”13
Members of Congress who pandered to elite earners were as common in those earlier periods as in today’s Reagan era. Supreme Court justices enthralled with economic power were commonplace in both periods as well. In language describing the dollar-friendly Fuller and Waite Courts of the latter nineteenth century, Burns could just as well have been writing about the economic Darwinism perspective of most court appointees by Ronald Reagan and the two Bush presidents:
“Americans might have mused that corporation heads packed the court as much as presidents. Exerting their overpowering influence on the White House and Congress, an astonishing number of railroads and other industries put their people on the Supreme Court. All of Grant’s appointees … were railroad attorneys.”14
Middle-Class Societies
The rising American income disparity of recent decades has made Australia and Northern Europe much more middle-class societies than the United States. When a nation’s productivity and economic growth are enjoyed broadly as in those nations, the middle class expands and the economy itself performs more efficiently, as Joseph Stiglitz has argued.15 That’s what happened in America and other rich democracies after World War II, and it has continued to occur in the family capitalism countries since 1980, even as the United States took another path.
The OECD defines the middle class as those earning between .5 and 1.5 times a nation’s median income. While slightly more than one-half of the US workforce earned an income in 2007 within that range, about two-thirds of working-age men and women elsewhere received incomes in that range. That is even true in Germany, where employees in the former GDR enjoy rising, but still relatively low wages.
Moreover, the relatively small middle class in America is shrinking. US Census Bureau statistics showed the share of national income in 2011 received by the three middle quintiles (60 percent) of households declined to 46.4 percent, from nearly 55 percent in 1980. That may explain why one-third of Americans now describe themselves as lower or lower-middle class, compared to 25 percent who did so as recently as 2008.16 As Washington Post columnist Harold Meyerson explains, “What emerges is a picture of a nation in decline. The first nation in human history to create a middle-class majority looks increasingly to be losing it.”17
The Income Share of Top Earners
The share of income received by elite earners is much lower in other rich democracies than in the United States. In 1960, the share of national income going to the top one-tenth of 1 percent of earners was 2 percent in France and America; that share remained the same 2 percent during the ensuing twenty years of the golden age in both nations. But the share began rising in the United States after 1980, and by 2001, the share of national income accruing to that top slice of Americans had nearly quadrupled, to almost 8 percent. In contrast, that share has remained at 2 percent in France.18
The picture is the same in Germany. Back in 1970, the top 1 percent of German households garnered 11 percent of all income; that was higher than the 9 percent received by the top 1 percent of Americans at the time. Through 2010, that figure remained stable at 11 percent in Germany, while the share of income received by the top 1 percent of Americans more than doubled to 22 percent by 2005.19
Beyond issues of fairness, does the deteriorating US income disparity matter? Not all economists agree, but some economists, including Joseph Stiglitz and Thomas I. Palley, argue persuasively that it slows economic growth. Additionally, economist Robert H. Frank and others have argued that standards beyond just income should be used to measure the plight of American families during the Reagan era. I’ve adopted one such alternative standard in this book, using families in other rich democracies as a control group.
Frank suggests educational access as another standard. Since the 1980s, for example, concerns about school quality have grown as families seek solutions to stagnant incomes through better education. For their children, families covet quality school districts, yet prices in those neighborhoods have remained stubbornly high even in recent years, while sagging wages have made homes there less affordable, dimming that element of the American Dream for many. Frank’s statistics are compelling. Near the peak of wages in 1970, for example, he determined it took 41.5 hours of work a month for an employee earning the median wage to afford housing in the top half of school districts. But by 2000, the required work effort to live in such districts had increased sharply to 67.4 hours; wage compression requires that Americans work 60 percent more than before Reaganomics to afford housing in desirable school districts.20
This darkening of the American Dream has become generalized across the nation, with economic mobility dwindling during the Reagan era. As we will see in detail in the next chapter, that era has had an even more corrosive impact on opportunity, reversing what had been an American strength in the golden age.