CHAPTER 12
Logs with Open-Source Tools
This chapter aims to introduce you to the EFK stack, showing how you can retrieve the application logs, send them to a centralized server, and visualize in a dashboard.
Structure
In this chapter, we will discuss the following topics:
- EFK stack
- Setup the EFK stack
- Shipping and centralizing logs with Fluentd and Elasticsearch
- Visualizing logs with Kibana
Objectives
After studying this unit, you should be able to:
- Know about EFK stack
- Send logs to an elasticsearch using Fluentd
- Search for the logs using Kibana
- Create alerts
EFK
Elasticsearch, Fluentd, and Kibana; this stack is famous around the Kubernetes environments. Often, we can see a DaemonSet of FluentD running on all the nodes retrieving the logs and sending them to an Elasticsearch Server which will index the logs and parse them, thus, making it easy to search the specific events based on your criteria. Kibana is the web interface that can be connected to an elasticsearch in order to visualize the data. Otherwise, we would have to make requests to the elasticsearch API. Kibana also gives us many features, like creating graphics based on logs. Thus, we can create visualizations of how many errors the application raised in the last two hours. Or, in another example, we could count the HTTP status codes and order them based on the number of requests. 40 requests returned status 400, 500 requests return status 200, 10 requests returned status 500, etc.
Setup the EFK Stack
We will have the following scenario; we are going to set up the elastichsearch and Kibana in a virtual machine using Vagrant and the Fluentd will run within our minikube cluster to ship the logs from the running applications to the remote server, and we will visualize it in a centralized way.
The Vagrant file is as follows:
# -*- mode: ruby -*-
# vi: set ft=ruby :
# All Vagrant configuration is done below. The "2" in Vagrant.configure
# configures the configuration version (we support older styles for
# backwards compatibility). Please don't change it unless you know what
# you're doing.
Vagrant.configure("2") do |config|
config.vm.box = "ubuntu/bionic64"
config.vm.define "efk" do |efk|
efk.vm.network "private_network", ip: "192.168.99.50"
efk.vm.hostname = "efk"
config.vm.provider "virtualbox" do |v|
v.memory = 4096
end
efk.vm.provision "shell", inline: <<-SHELL
apt clean
wget -qO - https://artifacts.elastic.co/GPG-KEY-Elasticsearch | apt-key add -
apt-get install apt-transport-https -y
echo "deb https://artifacts.elastic.co/packages/7.x/apt stable main" | tee -a /etc/apt/sources.list.d/elastic-7.x.list
apt-get update
apt-get install Elasticsearch kibana -y
#sed -i "s/#network.host: 192.168.0.1/network.host: 0.0.0.0/g" /etc/Elasticsearch/Elasticsearch.yml
#sed -i "s/#discovery.seed_hosts: \[\"host1\", \"host2\"\]/discovery.seed_hosts: \[\]/g" /etc/Elasticsearch/Elasticsearch.yml
#sed -i "s/#server.host: \"localhost\"/server.host: \"0.0.0.0\"/g" /etc/kibana/kibana.yml
#/etc/init.d/kibana restart
#/etc/init.d/Elasticsearch start
SHELL
end
end
Provision your VM using the following command:
vagrant up --provision
When the server is ready, we have to change some configurations. First, enable the elasticsearch to listen to all the addresses by the following command:
sed -i "s/#network.host: 192.168.0.1/network.host: 0.0.0.0/g" /etc/Elasticsearch/Elasticsearch.yml
Second, change the seed hosts by the following command:
sed -i "s/#discovery.seed_hosts: \[\"host1\", \"host2\"\]/discovery.seed_hosts: \[\]/g" /etc/Elasticsearch/Elasticsearch.yml
Third, you must define that it is a single node cluster by the following command:
echo "discovery.type: single-node">> /etc/Elasticsearch/Elasticsearch.yml
Fourth, change the Kibana configuration to listen to all the addresses as well by the following command:
sed -i "s/#server.host: \"localhost\"/server.host: \"0.0.0.0\"/g" /etc/kibana/kibana.yml
Then, you can restart the services by running the following command:
root@efk:~# /etc/init.d/kibanarestart
d/Elasticsearch start
kibana started
root@efk:~# /etc/init.d/Elasticsearchstart
[….] Starting Elasticsearch (via systemctl): Elasticsearch.service
If you did all the steps correctly, you can check the service ports using the command ss –ntpl:

Figure 12.1
The Kibana is running on port 5601. Now, you can use the following address to check the interface.
http://192.168.99.50:5601
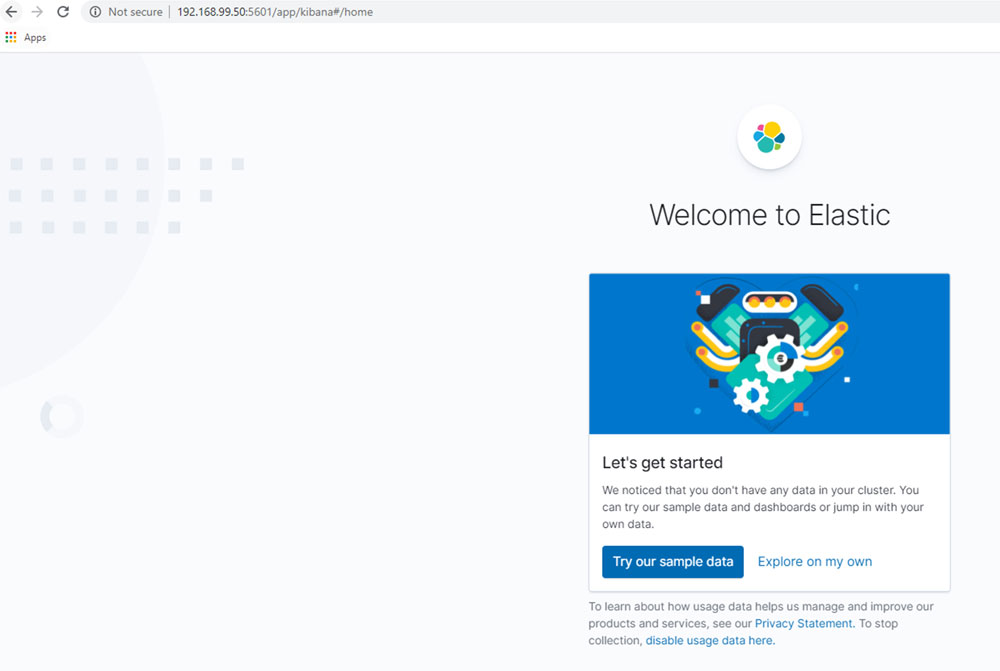
Figure 12.2
The server takes a while to start. If it takes about 10 minutes, do not worry.
At this moment, we do not have to do anything else in this server, so, let's go to the minikube and run the FluentD to ship the logs. After that, we will come back to the Kibana server and see the logs.
Running Fluentd
First of all, let's setup the minikube environment with the following command:
PS C:\Users\1511 MXTI\Documents\Blog\EKF> minikube delete
* Deleting "minikube" in virtualbox …
* Removed all traces of the "minikube" cluster.
PS C:\Users\1511 MXTI\Documents\Blog\EKF> minikube.exestart
* minikube v1.11.0 on Microsoft Windows 10 Pro 10.0.19041 Build 19041
* Automatically selected the virtualbox driver
* Starting control plane node minikube in cluster minikube
* Creating virtualbox VM (CPUs=2, Memory=6000MB, Disk=20000MB) …
* Preparing Kubernetes v1.18.3 on Docker 19.03.8 …
* Verifying Kubernetes components…
* Enabled addons: default-storageclass, storage-provisioner
* Done! kubectl is now configured to use "minikube"
I deleted my existing environment and started a fresh environment to make sure that we have exactly the same environment. With the Kubernetes environment running, we will set up the DaemonSet using the following file:
apiVersion: apps/v1
kind: DaemonSet
metadata:
name: fluentd
namespace: kube-system
labels:
k8s-app: fluentd-logging
version: v1
spec:
selector:
matchLabels:
name: fluentd
template:
labels:
name: fluentd
k8s-app: fluentd-logging
version: v1
kubernetes.io/cluster-service: "true"
spec:
containers:
- name: fluentd
image: fluent/fluentd-kubernetes-daemonset:v1-debian-Elasticsearch
env:
- name: FLUENT_ELASTICSEARCH_HOST
value: "192.168.99.50"
- name: FLUENT_ELASTICSEARCH_SSL_VERIFY
value: "false"
- name: FLUENT_ELASTICSEARCH_PORT
value: "9200"
- name: FLUENT_ELASTICSEARCH_SCHEME
value: "http"
- name: FLUENT_UID
value: "0"
- name: FLUENT_LOGSTASH_FORMAT
value: "true"
- name: FLUENT_LOGSTASH_PREFIX
value: "fluentd"
- name: FLUENTD_SYSTEMD_CONF
value: "disable"
resources:
limits:
memory: 200Mi
requests:
cpu: 100m
memory: 200Mi
volumeMounts:
- name: varlog
mountPath: /var/log
- name: varlibdockercontainers
mountPath: /var/lib/docker/containers
readOnly: true
terminationGracePeriodSeconds: 30
- name: varlog
hostPath:
path: /var/log
- name: varlibdockercontainers
hostPath:
path: /var/lib/docker/containers
DaemonSet: It is a Kubernetes object which is responsible to run the same pod on every node of the cluster. The difference between a normal pod and a DaemonSet is that a pod is mandatory on every node, if you are deploying an application, not necessary you have to run the application on all nodes:
kubectl apply -f .\fluentd.yaml
daemonset.apps/fluentd configured
The preceding command will run the DaemonSet in your cluster. To check if it is running, you can run the following command:
PS C:\Users\1511 MXTI\DataLake> kubectl get daemonset -n kube-system
NAME DESIRED CURRENT READY UP-TO-DATE AVAILABLE NODE SELECTOR AGE
fluentd 1 1 1 1 1 <none> 7m26s
kube-proxy 1 1 1 1 1 kubernetes.io/os=linux 13h
It is important to check the logs, because starting from now, the logs must be sent to the elasticsearch server:
PS C:\Users\1511 MXTI\DataLake> kubectl logs daemonset/fluentd -n kube-system
Visualizing the Logs
Now, we can go back to the Kibana dashboard, because the logs must have already been shipped to the server. The next goal is to visualize them. In the initial page, click on the option Explore on my own. Then, click on the top left and discover the logs:

Figure 12.3
Now, we can create an index that matches with all the logs stored. We can do that once that cluster is used only for this Kubernetes environment. If you will use the same elasticsearch for all the logs of the company, it would be better to create different indexes for each case:
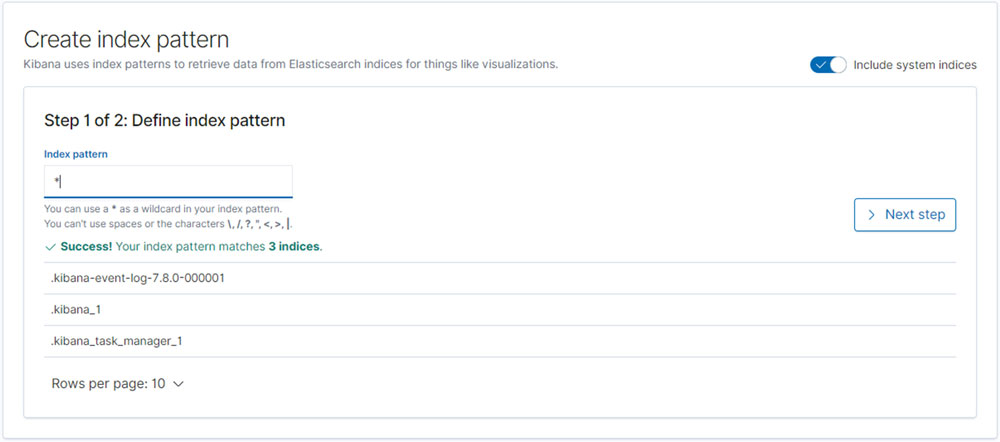
Figure 12.4
We must define the Index Pattern as *, which will get all the logs:
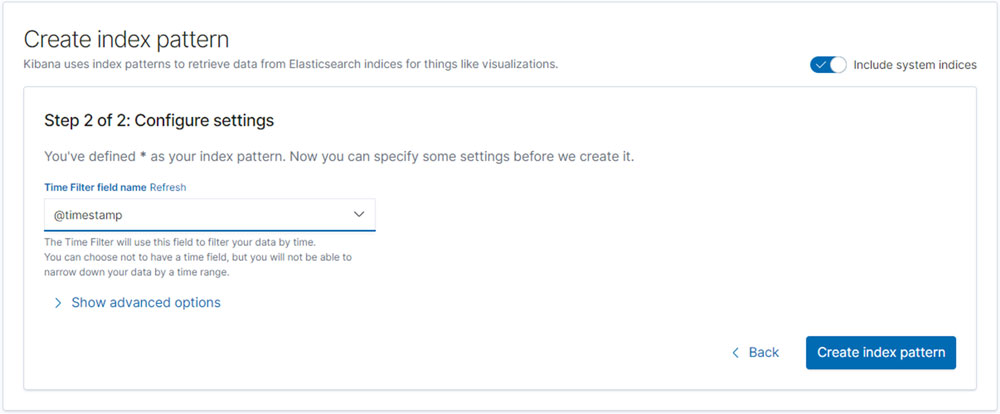
Figure 12.5
You can select the time filter as a timestamp. If we go again to the discovery part and select logs from 3 months ago, we will be able to see that the logs are already in the Elasticsearch. Of course, we do not need to put 3 months ago, but I just wanted to make sure that we will see all the present logs:
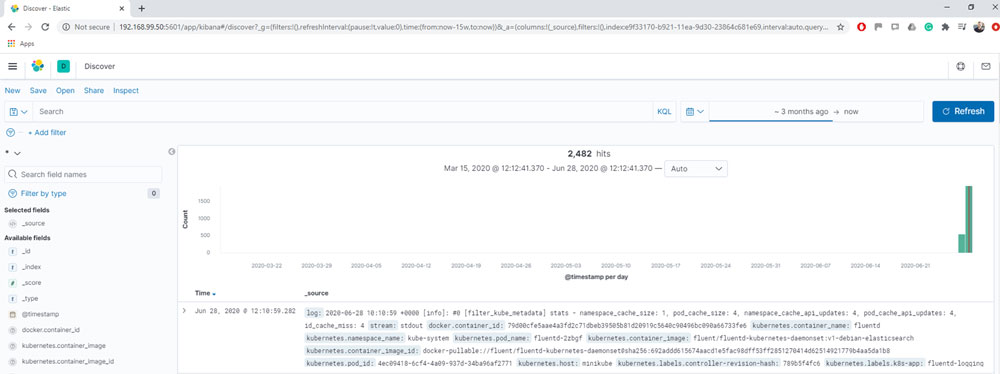
Figure 12.6
If you look on the left side, you can find some Kubernetes elements. You can play around that because, now, we do not need to access the Kubernetes cluster to access the logs.
Let's deploy an application and see how we can check the logs:
Kubectl create ns chapter11
Create a namespace, called Chapter11: Deploying and Scaling your Application using Kubernetes, because we will use the same application used in the last chapter. The yaml file for the application is as follows:
apiVersion: apps/v1
kind: Deployment
metadata:
name: python
namespace: chapter11
labels:
app: python
spec:
replicas: 1
selector:
matchLabels:
app: python
template:
metadata:
labels:
app: python
spec:
containers:
- name: python
image: alissonmenezes/python:latest
ports:
- containerPort: 8080
---
apiVersion: v1
kind: Service
metadata:
labels:
app: python
name: python
namespace: chapter11
spec:
ports:
- name: http
port: 80
protocol: TCP
targetPort: 8080
selector:
app: python
---
apiVersion: extensions/v1beta1
kind: Ingress
metadata:
name: python
labels:
app: python
namespace: chapter11
annotations:
nginx.ingress.kubernetes.io/rewrite-target: /
spec:
backend:
serviceName: python
servicePort: 80 Run the following command now:
PS C:\Users\1511 MXTI\Documents\Blog\EKF> minikube.exe ip
192.168.99.102
The Kubernetes IP is 192.168.99.102. We will use it to access the application. Make sure that you have enabled the ingress with the following command:
PS C:\Users\1511 MXTI\DataLake> minikube.exe addons enable ingress
* The 'ingress' addon is enabled
If we access the application on the browser, we will see the following page:

Figure 12.7
If we go to the applications logs on Kubernetes, we can see the following:
PS C:\Users\1511 MXTI\DataLake> kubectl logs deploy/python -n chapter11
* Running on http://0.0.0.0:8080/ (Press CTRL+C to quit)
* Restarting with stat
* Debugger is active!
* Debugger PIN: 954-738-244
172.17.0.6 - - [28/Jun/2020 10:22:16] "GET / HTTP/1.1" 200 -
172.17.0.6 - - [28/Jun/2020 10:22:17] "GET /favicon.ico HTTP/1.1" 404 -
172.17.0.6 - - [28/Jun/2020 10:22:18] "GET / HTTP/1.1" 200 -
172.17.0.6 - - [28/Jun/2020 10:22:18] "GET / HTTP/1.1" 200 -
It means that we generated some logs, and then we can see those on the Kibana. Let's give a look. First, we need the pod name:
PS C:\Users\1511 MXTI\DataLake> kubectl get pods -n chapter11
NAME READY STATUS RESTARTS AGE
python-779879dbb6-wrw2g 1/1 Running 0 44m
And the query on Kibana will be like this:
kubernetes.pod_name:python-779879dbb6-wrw2g
The syntax is: key : value. Then, the first parameter is the respective element that you want to filter. The colon, : , represents the equal and in the end, you have the value used as a criteria.
The Kibana page you will see will be like the following screenshot:
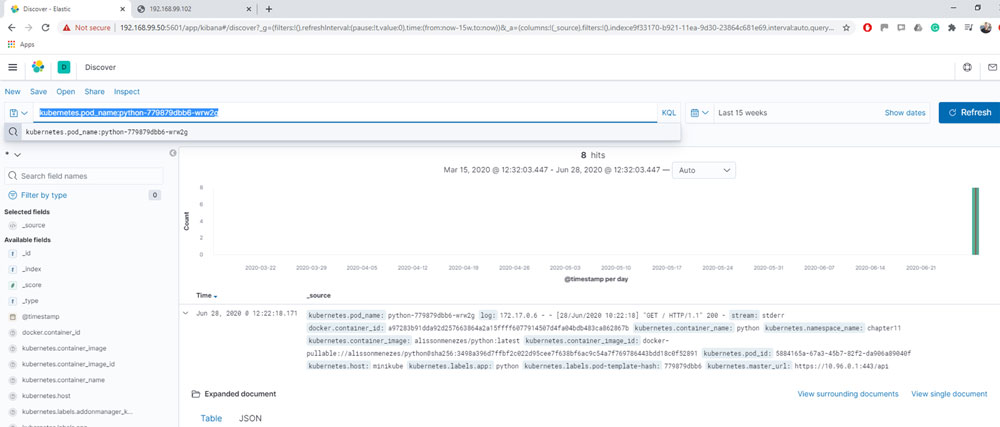
Figure 12.8
Let's analyze the log because we have an important information to check:

Figure 12.9
Pay attention, the pod_name matches with the criteria, and the log has the logline that we saw on the Kubernetes. Now, we are sure that the logs were sent to elasticsearch. We can visualize them on Kibana and now, we can create a specific visualization to simplify the log analysis.
Creating alerts
With the logs within the elasticsearch and we know how to find them, let's create some alerts which will notify us when an event happens. The event can be defined by you, can return a status 404, status 500, or for example, part of an error message.
In our case, every time that someone tries to access a non-existing page, it will return the 404 status and it will send a notification. In order to do that, we will use a tool called ElastAlert. It is a tool in Python which will connect to our elasticsearch, will read the logs, and send the notifications.
Within the EFK stack, let's install it.
root@efk:~# apt install python3-pip -y
root@efk:~# python3 -m pip install elastalert
Sometimes, we may face an issue because of the other modules version. The most important module for the ElastAlert is the PyYAML. So, let's upgrade it to make sure that we are using the latest version:
root@efk:~# python3 -m pip install PyYAML --upgrade
Once ElastAlert is installed, we need to connect it with elasticsearch. To do it, run the following command:
root@efk:~# elastalert-create-index
Enter Elasticsearch host: 127.0.0.1
Enter Elasticsearch port: 9200
Use SSL? t/f: f
Enter optional basic-auth username (or leave blank):
Enter optional basic-auth password (or leave blank):
Enter optional Elasticsearch URL prefix (prepends a string to the URL of every request):
New index name? (Default elastalert_status)
New alias name? (Default elastalert_alerts)
Name of existing index to copy? (Default None)
Elastic Version: 7.8.0
Reading Elastic 6 index mappings:
Reading index mapping 'es_mappings/6/silence.json'
Reading index mapping 'es_mappings/6/elastalert_status.json'
Reading index mapping 'es_mappings/6/elastalert.json'
Reading index mapping 'es_mappings/6/past_elastalert.json'
Reading index mapping 'es_mappings/6/elastalert_error.json'
New index elastalert_status created
Done!
So, the next step is to create the config.yaml, which is the file where the elasticsearch server is configured:
root@efk:~# cat config.yaml
rules_folder: rules
run_every:
minutes: 1
buffer_time:
minutes: 15
es_host: 127.0.0.1
es_port: 9200
writeback_index: elastalert_status
writeback_alias: elastalert_alerts
alert_time_limit:
days: 2
Now, we need to create a rule. The ElastAlert will run the query every minute checking if we have the logs which match the criteria. Create a folder, called rules with the following command:
root@efk:~# ls
config.yaml rules
root@efk:~# pwd
/root
Within the rules folder, create a file, called alert_404.yml with the following content:
es_host: 192.168.99.50
es_port: 9200
name: Alerting 404
type: frequency
index: "*"
num_events: 1
timeframe:
hours: 24
filter:
- query:
wildcard:
log: "404"
alert:
- slack:
slack_webhook_url: "https://hooks.slack.com/services/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"
I created a workspace on Slack, where I created a web hook. If you want to know more about that, you can check the documentation later on. But, for now, the most important thing is to see if it is working. So, let's run the ElastAlert with the following command:
root@efk:~# elastalert --rule rules/alert_404.yml --verbose
1 rules loaded
INFO:elastalert:Starting up
INFO:elastalert:Disabled rules are: []
INFO:elastalert:Sleeping for 9.999665 seconds
Now, you can try to access a non-existing page, like the following screenshot:

Figure 12.10
This access should generate a log with the 404 status. You probably saw a log like this on ElastAlert:
INFO:elastalert:Queried rule Alerting 404 from 2020-06-30 18:54 UTC to 2020-06-30 18:57 UTC: 2 / 2 hits
INFO:elastalert:Ran Alerting 404 from 2020-06-30 18:54 UTC to 2020-06-30 18:57 UTC: 2 query hits (2 already seen), 0 matches, 0 alerts sent
INFO:elastalert:Background configuration change check run at 2020-06-30 18:57 UTC
INFO:elastalert:Background alerts thread 0 pending alerts sent at 2020-06-30 18:57 UTC
It means that our alert is working and I should have received a notification on Slack:
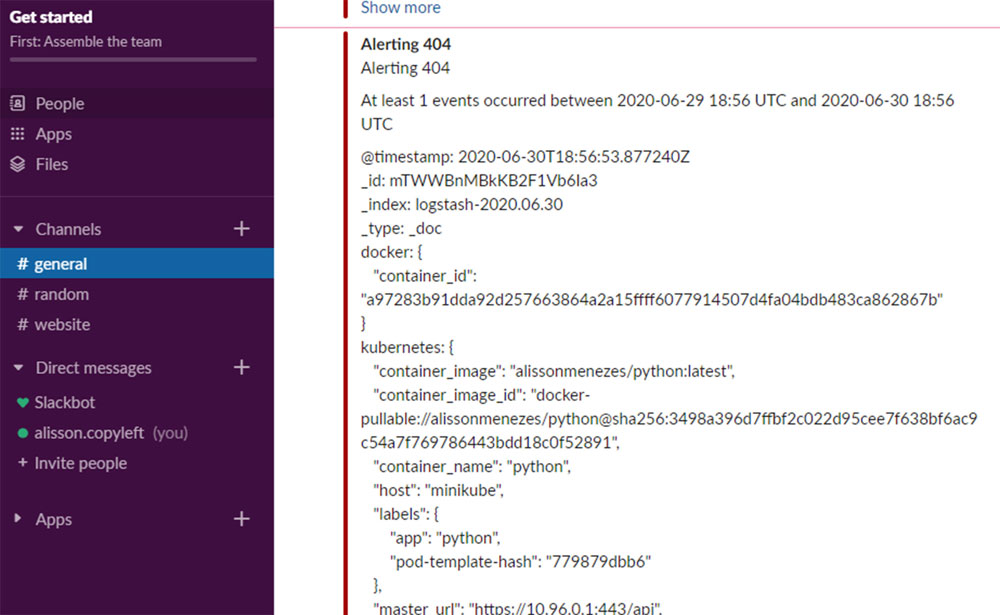
Figure 12.11
As you saw in the preceding image, I received the notification on Slack with the logs where I can see the error and check what is happening with the application.
Of course, you can explore more ElastAlert and configure different types of alerts, using email, for example. However, many companies now are changing from email to Slack or similar tools. That is why, I used it as an example.
Conclusion
This chapter was a short explanation of how we can set up an environment using the EFK stack and Kubernetes. The same steps work on Cloud or on-premises environments. This whole chapter aimed to show you a short explanation about everything that is possible to do using the DevOps technologies. For each chapter, we could have written a whole book. However, in my view, it is very important to have a general overview about different topics, because, you will be able to think what is possible to do and what the people are using for different cases. And after that, you can go deep in each one of the solutions represented here or find their alternatives.