To understand typical imaging characteristics of intracranial hemorrhage in CT and MR imaging
To know the most likely differential diagnosis of pathologies responsible for the hemorrhage with reference to anatomical location and patient characteristics
To know how to triage patients suffering from an intracranial hemorrhage for further imaging and therapy
5.1 Introduction
Stroke is a major global health problem with different expressions among the globe but with a significant impact in the countries. The global prevalence of stroke varies from 339 to 1184 per 100,000, being higher among the more developed countries that face the problem of aging of the population. The prevalence of hemorrhagic strokes also varies among countries from 32–270 per 100,000 [1].
Spontaneous intracranial hemorrhage (IH) accounts for up to 10–15% of all strokes and is an important cause of neurological morbidity and mortality. The intracranial hemorrhage incidence is estimated in 10–30/100,000, increasing with age (doubles each decade after 35 years of age) [2].
The 1-year survival is only about 30%, ranging the 30-day mortality between 35 and 52%, with approximately half of the deaths occurring during the first 2 days after presentation [2]. The prognosis of IH mainly depends on the severity of intracranial hypertension and associated complications such as brain herniation, the development of hydrocephalus, and for subarachnoid hemorrhage on the development of arterial vasospasm.
Spontaneous intracranial hemorrhage may be parenchymal, intraventricular, subarachnoid, subdural, and epidural, the former being the most common location and the latter two being uncommon and usually associated with trauma.
Computed tomography (CT) remains the standard method to detect intracranial hemorrhage although radiologists need also to be familiar with the appearance of hematomas using magnetic resonance imaging (MRI). In this paper the authors suggest a structured imaging diagnostic approach for spontaneous intracranial hemorrhage and review the imaging findings of the most common causes.
5.2 Hemorrhage Imaging
In the presence of a stroke with acute neurological deficit an emergent imaging study is warranted to evaluate the presence of ischemic or hemorrhagic stroke. Generally, CT is the initial imaging method used, due to its wider availability, rapid acquisition, lack of contraindications, and high accuracy to depict intracranial hemorrhage.
Most common etiologies of nontraumatic intracranial hemorrhage by age group and anatomic location
Adult | Pediatric | |||
|---|---|---|---|---|
Elderly | Young/middle aged | Adolescent/child/infant | Newborn | |
Parenchymal | • Hypertensive hemorrhage • Cerebral amyloid angiopathy (CAA) • Hemorrhagic transformation of acute ischemic infarction • Dural AVF • Venous thrombosis • Coagulopathies • Neoplasms | • Brain AVM • Cavernomas • Venous thrombosis • Hypertensive encephalopathies/PRES • RVCS • Drug abuse • Neoplasms | • Brain AVM • Cavernomas • Venous thrombosis • Tumors • Coagulopathies (congenital/acquired) | • Hypoxic-ischemic injury |
Subarachnoid | • Aneurysm • Cerebral amyloid angiopathy (CAA) • Perimesencephalic hemorrhage • Bleeding diathesis (e.g., excessive anticoagulation) | • Aneurysm • Arterial dissection • Brain AVM | • Aneurysm • Sickle cell disease (in children) • Coagulopathies (congenital/acquired) | |
Epidural/subdural | • Dural AVF • Aneurysm • Moyamoya syndrome • Dural metastases • Bleeding diathesis/hematological disorders | |||
CT and MR characteristics of intracranial hemorrhage
Time | NECT | CECT | T1-weighted | T2-weighted | T2∗w |
|---|---|---|---|---|---|
Hyperacute (<6 h) | Hyperdense | Iso | Hyper | Hypo | |
Acute (6 h–3 days) | Hyper | Iso | Hypo | Hypo | |
Early subacute (3–7 days) | Hyper/iso | Iso (center) | Hypo | Hypo | |
Hyper (rim) | |||||
Late subacute (1–4 weeks) | Iso/hypo | Rim enhancement | Hyper | Hyper | Hypo |
Chronic (months–years) | Hypo | Hypo | Hypo | Hypo |
To understand the appearance of blood clots on CT and MRI, some knowledge on clot formation is helpful.

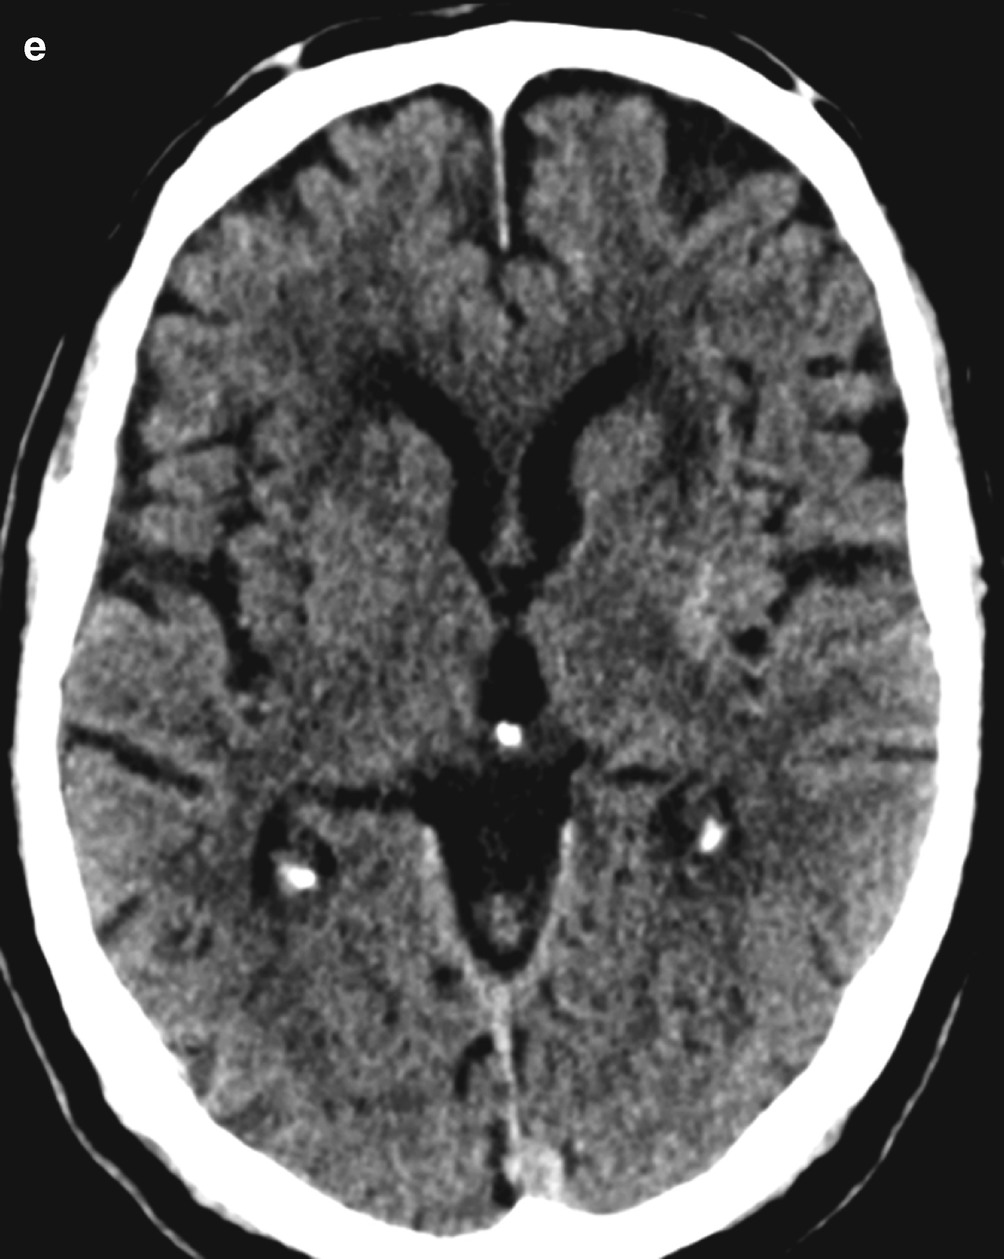
Hypertensive hematoma. Axial (a) and reformatted coronal (b), and sagittal (c) CT images showing an acute hypertensive hematoma at the basal ganglia (putamen) dissecting into the corona radiata. The 10 day follow up CT images (d) shows the expected peripheral hyperattenuation decrease and the presence of edema. The late follow up (1 year) CT image (e) shows the hematoma scar as a small area of calcification with peripheral hypoattenuation
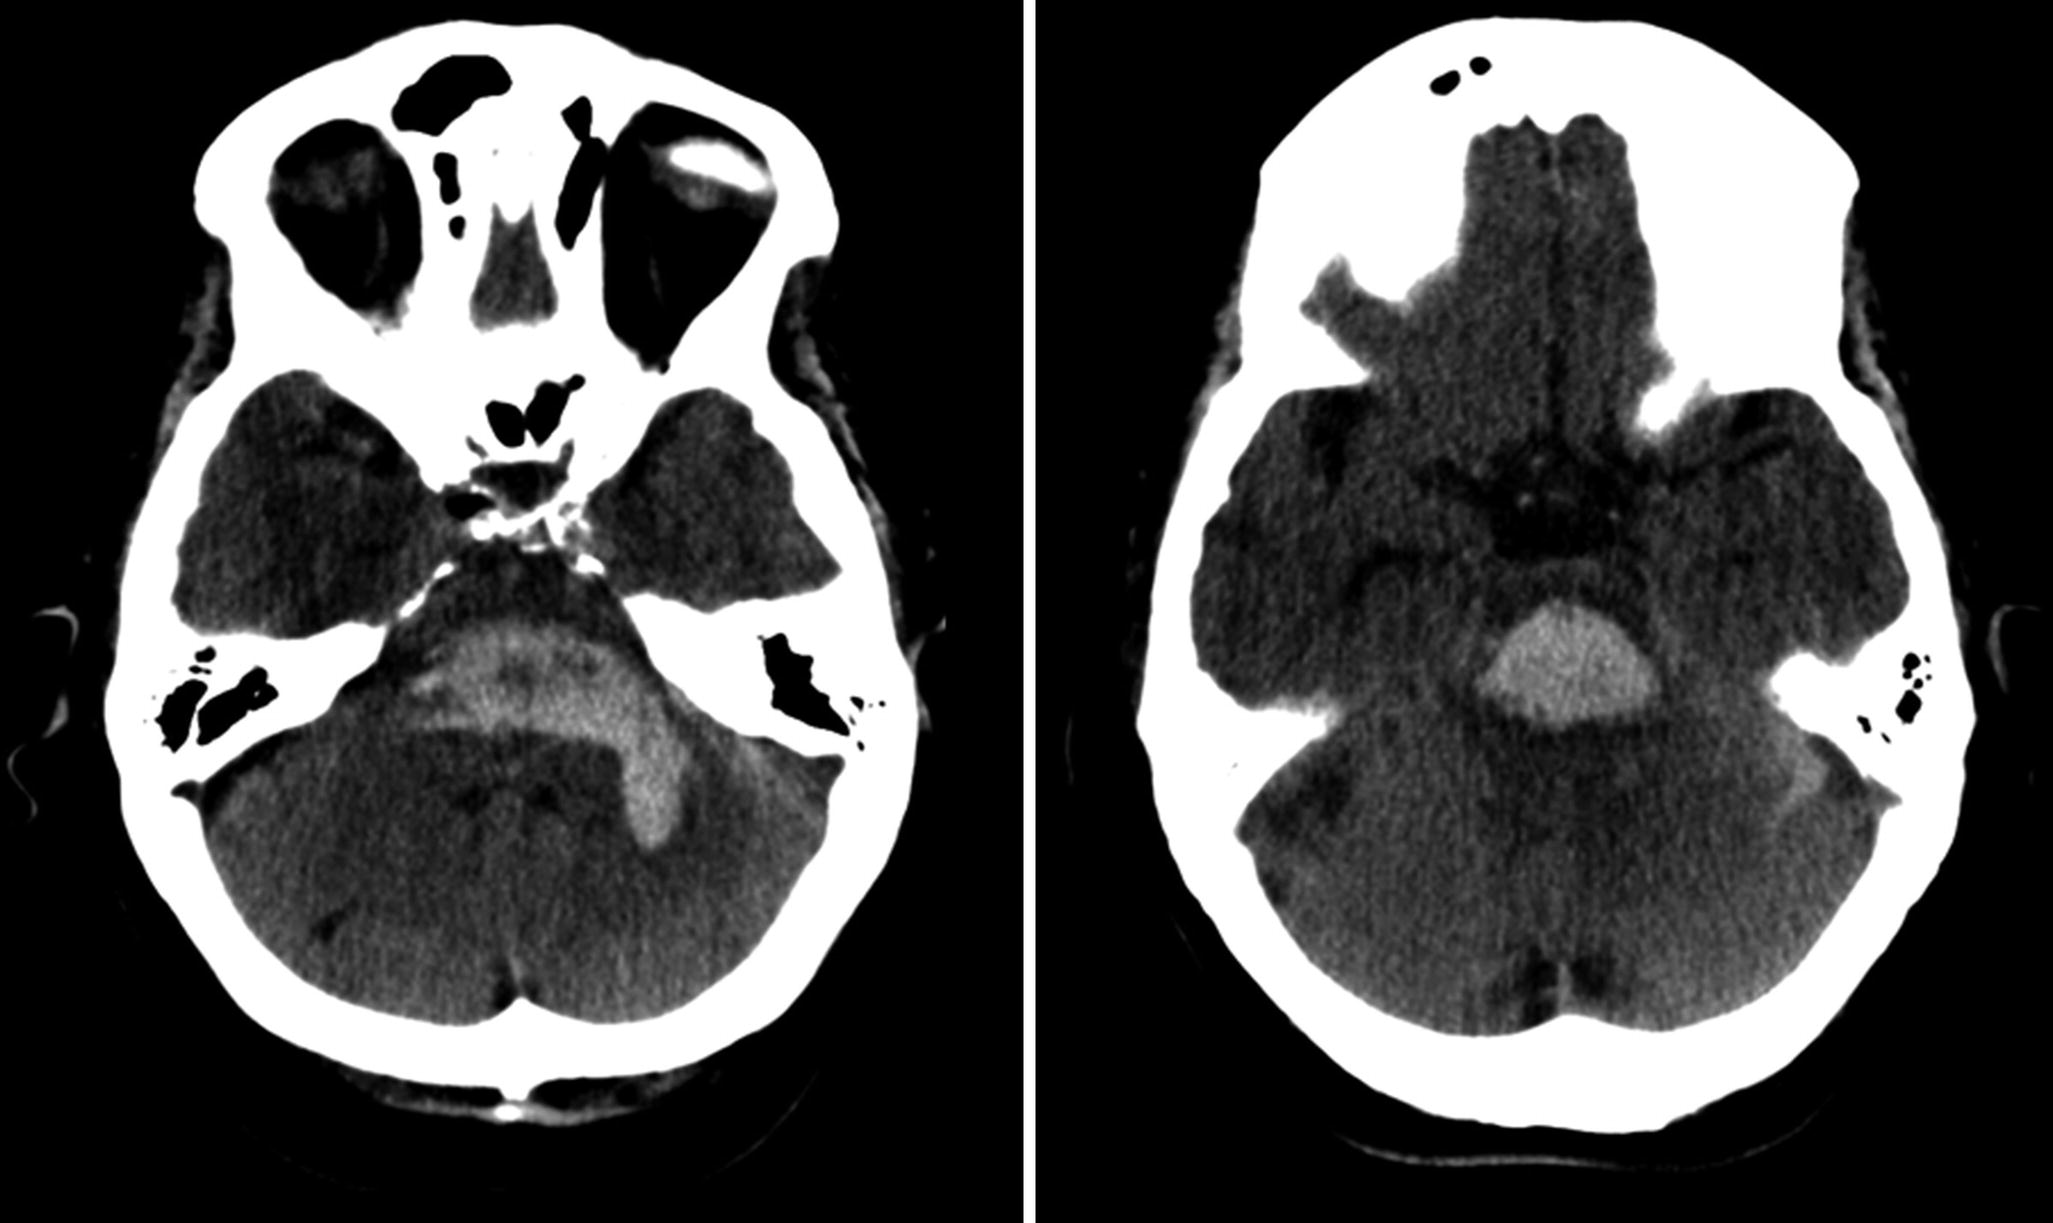
Hypertensive hematoma. Axial CT images showing an acute (hyperattenuating) pontine hypertensive hematoma dissecting into the middle cerebellar peduncle and left medulary center
For MRI it is also important to understand the type of hemoglobin present at each stage of the hematoma. This allows the estimation of the age of the hematoma. Initially, an intracerebral hematoma consists of intact red blood cells (RBCs) containing mainly oxygen-saturated hemoglobin (oxyhemoglobin, OxyHb). The hemoglobin is then gradually deoxygenated. At 48 h after hemorrhage the clot consists almost entirely of deoxyhemoglobin (DeoxyHb). At this stage, the hematoma is surrounded by edema. In the early subacute phase (3–7 days) DeoxyHb is gradually converted to methemoglobin (MetHb). These changes begin at the periphery of the clot and then progress towards the center. In the late subacute phase (2–4 weeks) the RBCs lyse and MetHb is released from the intracellular into the extracellular space. In this stage the edema gradually dissolves. Later on, in the chronic phase (>4 weeks) the hematoma shrinks to finally form a small cavity, which is often slit-like. The cavity often contains ferritin- and hemosiderin-laden macrophages as long-standing markers of bleeding. Again, the signal intensity changes occur from the periphery to the center in a homogeneously layered fashion and the evolution over time will depend on the location of the bleeding [3].
Over the following hours and days it is expected that there is an increase of the surrounding brain edema and mass effect. The surrounding edema increases during the first 2 weeks, especially during the first 48–72 h, and is associated with activation of inflammatory pathways initiated by the hematoma products [4, 5].
On post contrast imaging, either by CT or MRI, a thin and regular ring-like enhancement at the periphery of the hematoma is seen during the subacute phase, resulting from local disruption of the blood–brain barrier and associated inflammatory reaction.
Over time, the hematoma density will gradually decrease, resulting from clot lysis and liquefaction, with a centripetal course, from the periphery to the center, at an estimated rate of 0.7–1.5 HU per day [3]. The edema and mass effect tend to start to fade at late subacute phases, generally after the third week.
In the late and chronic phases, the edema and mass effect will subside and a hemosiderin scar (slit-like) will prevail as a hypoattenuation on CT and low T1 and T2 WI signal lesion without edema and mass effect (Fig. 5.1). Chronic lesions are associated with brain atrophy with sulcal and/or ventricular enlargement, and may exhibit focal calcification and peripheral gliosis.
Microhemorrhages are chronic small punctate brain hemorrhages only depicted by MRI using T2∗W susceptibility imaging. They are depicted as small (<5 mm) rounded low T2∗ lesions which result from presumed ruptures of tiny vessels with diameters smaller than 200 μm. They are commonly associated with sporadic small vessel disease (systemic hypertension) and CAA, but can also be found in patients with nonsporadic small vessel disease, such as CADASIL and vasculitis, among others. They are also seen in ageing with increasing prevalence with older age and hypertension. The differential diagnosis of microbleeds includes non-hemorrhagic subcortical mineralization areas; pneumocephalus and hemorrhagic lesions such as cavernomas, hemorrhagic diffuse axonal injury, and microhemorrhagic brain metastasis.
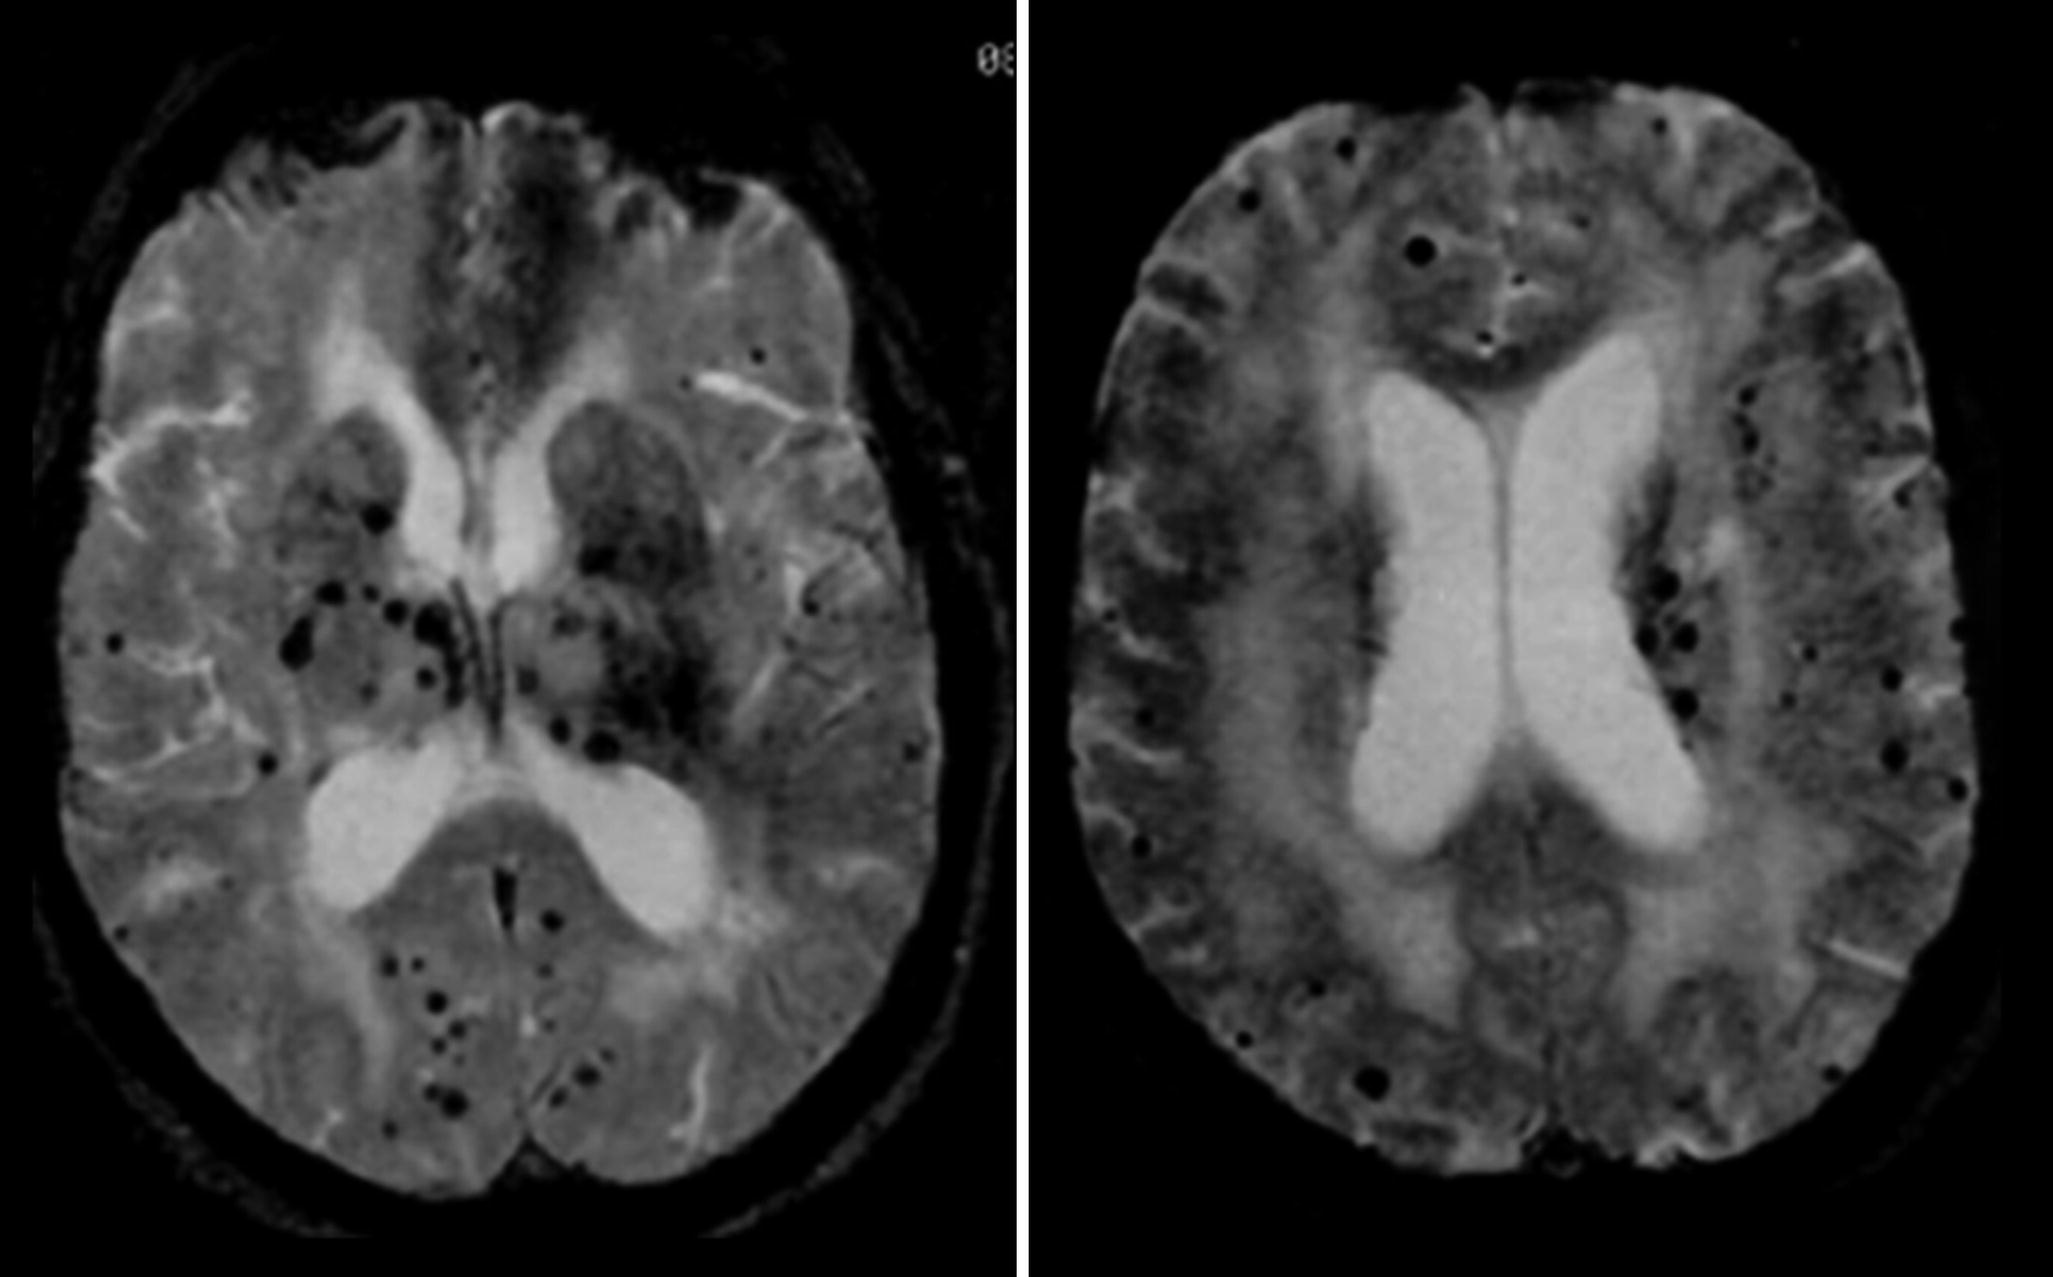
Hypertensive microhemorrhages. Axial T2*-weighted MR images demonstrating the central pattern of microbleeds (small punctuate low intensity signal lesions) distribution, with thalamic, lenticular, caudade, capsular and corona radiata locations, in association with a peripheral distribution at the lobar cortical-subcortical junction
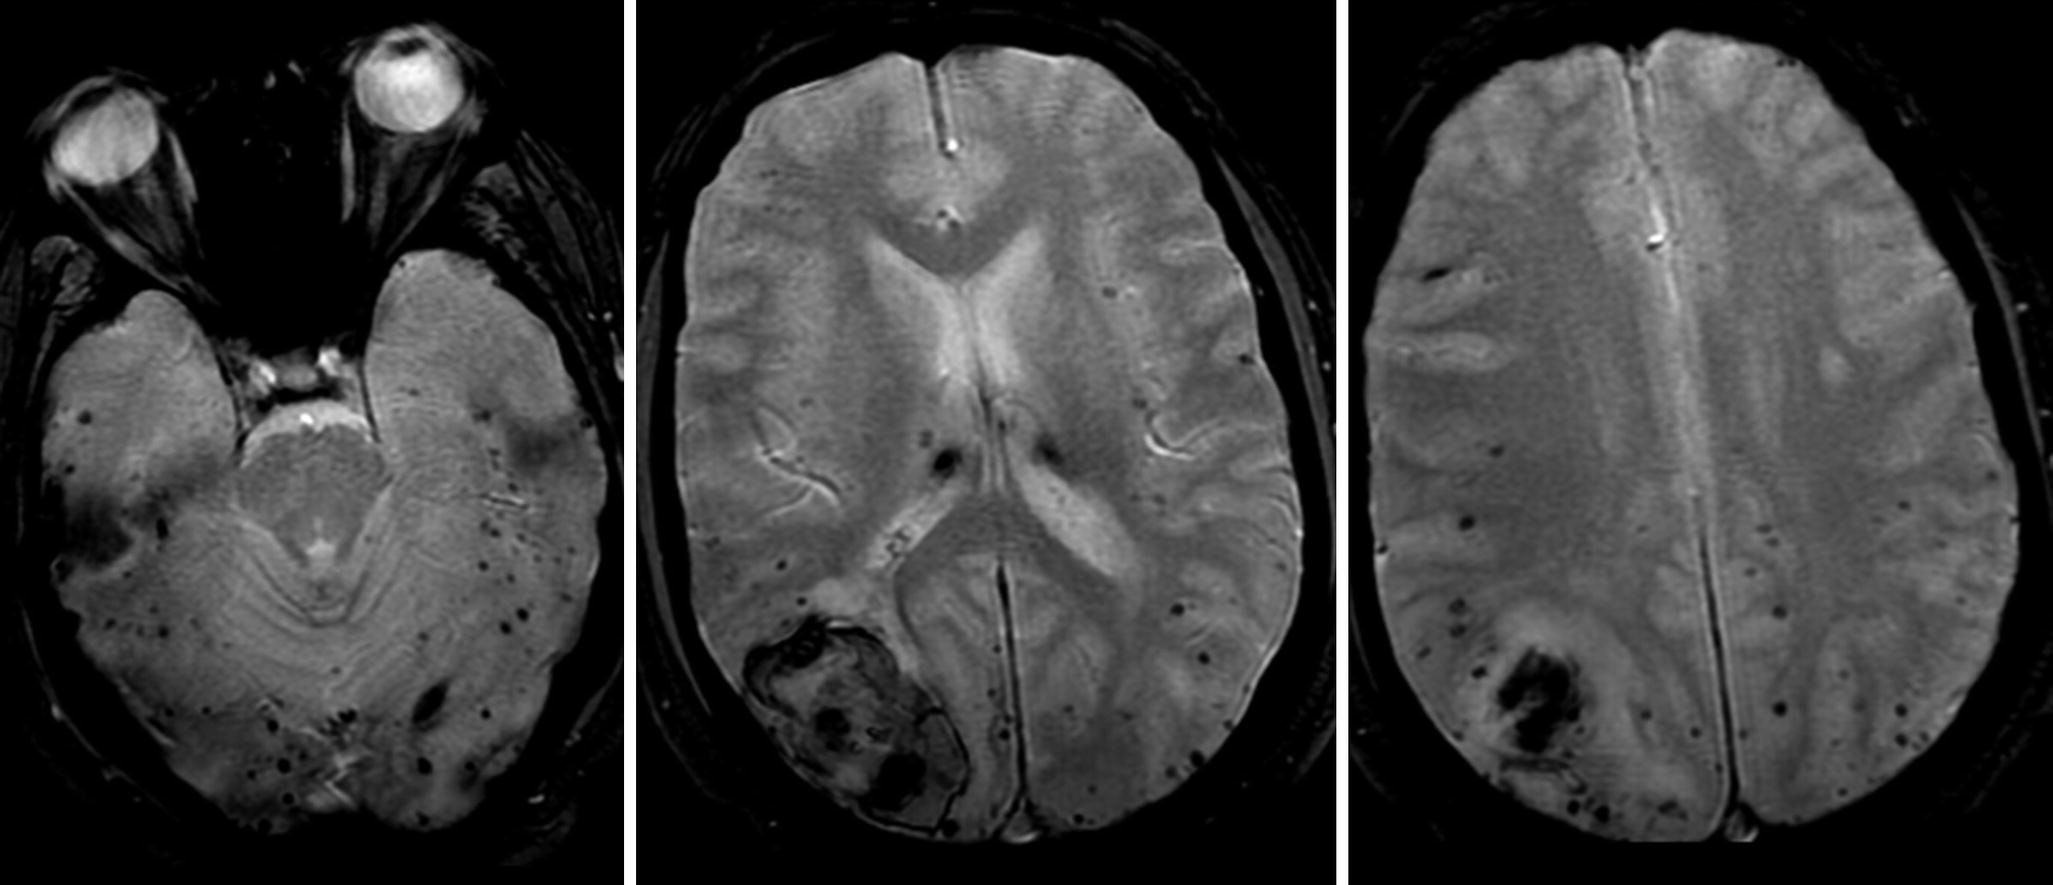
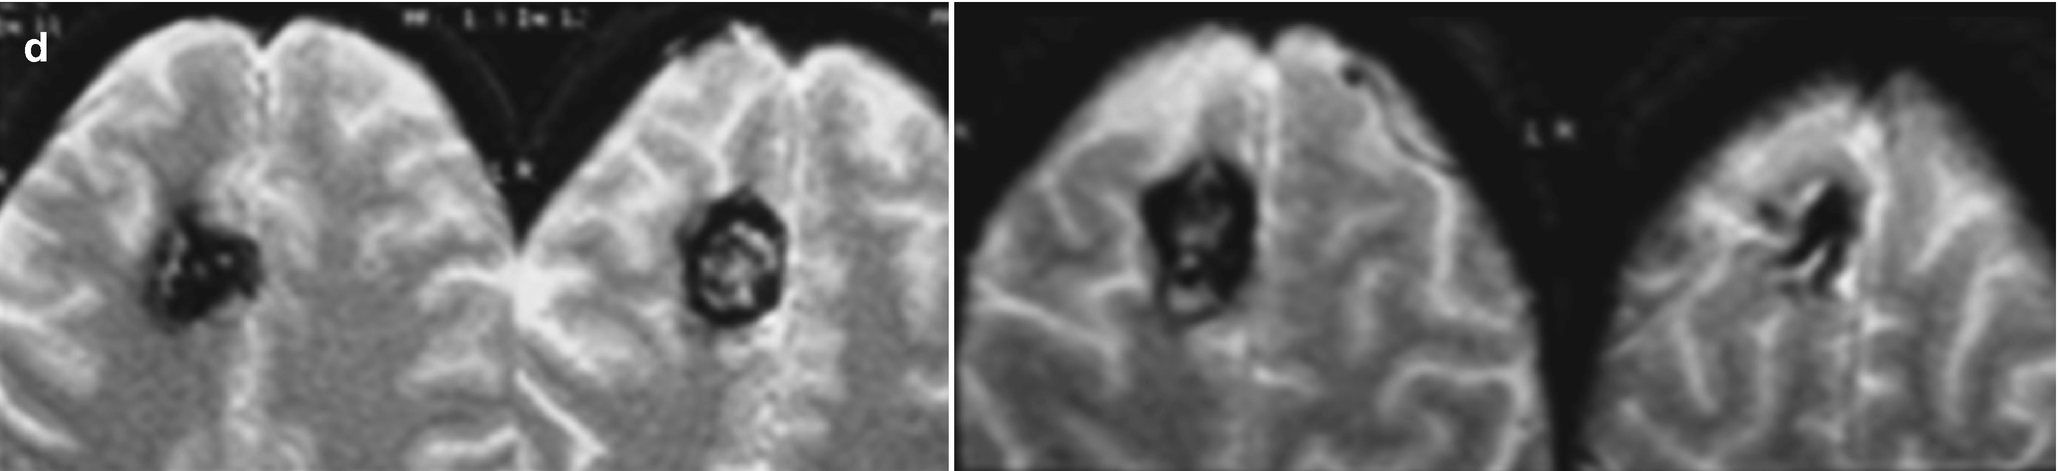
Cerebral amyloid angiopathy (CAA) microhemorrhages. Axial T2-weighted MR images demonstrating the isolated peripheral pattern of microbleeds (small punctuate low intensity signal lesions) distribution with distribution at the lobar cortical-subcortical junction with posterior cerebral predominance, in association to a right occipital lobar hematoma
Subarachnoid and intraventricular hemorrhage manifest with hemorrhage into the CSF spaces presenting with increased attenuation on CT images (blood). The hemorrhage attenuation and MRI signal intensity follow the above-mentioned evolution.
CT is the method of choice to detect acute intracranial hemorrhage
CT and CTA allow the detection of active intracranial bleeding
In the subacute stage MRI is superior to CT in the detection of subarachnoid hemorrhage
CT is the gold standard imaging method to depict acute SAH [6, 7]. The sensitivity of CT to depict SAH during the first 6–12 h is 98–100% [6, 7]. The same diagnostic accuracy may be assumed for intraventricular hemorrhage. Over days, especially after the fifth day, the accuracy of CT decreases, and in the subacute phase a lumbar puncture may be needed to make the diagnosis [6].
Recently, it has been shown that MRI has a very high accuracy, similar to CT, to depict SAH in the acute phase, using FLAIR/DF sequences, and a higher accuracy than CT in the subacute and chronic phases (using FLAIR/DF and susceptibility weighted sequences) [8, 9]. MRI is especially sensitive to chronic SAH, depicting the presence of superficial cortical hemosiderosis. This is an important diagnostic sign since its presence can help to suspect prior subarachnoid hemorrhage, or to substantiate the differential diagnosis of amyloid angiopathy.
Modified Fisher grade
Grade 1 | Minimal or diffuse thin SAH without IVH | Low risk for symptomatic vasospasm |
Grade 2 | Minimal or thin SAH with IVH | Intermediate risk for symptomatic vasospasm |
Grade 3 | Thick cisternal clot without IVH | |
Grade 4 | Cisternal clot with IVH | High risk for symptomatic vasospasm |
5.3 Intracranial Hemorrhage Etiology
There are multiple potential causes of hemorrhagic stroke, which can be primarily categorized according to the hemorrhage location and patient age, facilitating the imaging differential diagnosis approach, as summarized in Table 5.1.
Additional imaging to evaluate an intracranial hemorrhage includes CT angiography to look for underlying vascular lesions and MRI to rule out other etiologies of ICH.
Vascular imaging is indicated whenever a vascular lesion is suspected, such as arterial aneurysms, pial arteriovenous malformations and dural arteriovenous fistula, or vasculitis. CT or MR venograms are very helpful to depict the presence of cerebral venous thrombosis, especially dural sinus thrombosis. CTA and MRA are the initial imaging methods. DSA is reserved for inconclusive cases, and for the treatment of some of the vascular lesions. The spot sign on CTA, reflecting contrast extravasation, depicted as an enhancing focus within the acute hematoma, deserves special attention since is associated with a higher risk of growth of the hematoma [10–14].

Cerebral amyloid angiopathy (CAA). Axial T1-weighted MR image (a) depicting a frontal lobar hematoma in the subacute stage (extracellular methemoglobin). Axial T2-weight (b) and T2*-weighted (c) images demonstrate additional cortical (superficial) subarachnoid hemorrhage at the right brain convexity and a chronic occipital lobar hematoma
Hypertensive hemorrhage is the leading cause of cerebral hematomas in the adult population, being secondary to a long-standing hypertensive vasculopathy characterized by lipohyalinosis of small-to-medium penetrating arteries. Hematomas result from the rupture of small arterioles and have a rebleeding rate of up to 2% per year [16]. Typical locations for hypertensive hemorrhage (Figs. 5.1 and 5.2) include basal ganglia (in 62–65% of cases), thalamus (in 20–26% of cases), pons (in 5–10% of cases), cerebellum (in approximately 6% of cases), and subcortical—cerebral lobar (in 1–2%) of cases [17, 18]. The association of leucoaraiosis, lacunar infarcts, and microbleeds with a central distribution pattern supports the diagnosis.
The modified Boston criteria for cerebral amyloid angiopathy (CAA)
Definite CAA | Full post-mortem examination | • Lobar, cortical, or cortical/subcortical hemorrhage • Pathological evidence of severe cerebral amyloid angiopathy • Absence of other diagnostic lesion |
Probable CAA with supporting pathology | Clinical data and pathological tissue (evacuated hematoma or cortical biopsy specimen) | • Lobar, cortical, or corticosubcortical hemorrhage • Some degree of CAA in specimen • Absence of other diagnostic lesion |
Probable CAA | Clinical data | • Patient 55 years or older • Absence of other diagnostic lesion • Absence of other cause of hemorrhage or superficial siderosis |
MRI or CT demonstrating | • Multiple hemorrhages restricted to lobar, cortical, or corticosubcortical regions (cerebellar hemorrhages allowed) of varying sizes/agesOr • Single lobar, cortical, or corticosubcortical hemorrhage and focal (three or less sulci) or disseminated (more than three sulci) cortical superficial siderosis | |
Possible CAA | Clinical data | • Patient 55 years or older • Absence of other cause of hemorrhage or superficial siderosis |
MRI or CT demonstrating | • Single lobar, cortical, or corticosubcortical hemorrhageOr • Focal or disseminated superficial siderosis |
CAA shows a different lesion pattern than hypertensive hemorrhage pattern and can be recognized by the presence of superficial siderosis
In intracerebral hematomas early hematoma expansion, intracranial hypertension, brain herniation, and the presence of hydrocephalus need to be recognized early to allow for specific treatment
For brain hematomas, there are some red-flag imaging findings that should prompt our special attention. These cases may require early surgical treatment. It is essential to depict early hematoma expansion, intracranial hypertension and/or signs of mass effect, such as brain herniation, and the presence of hydrocephalus.
Predictors for worst outcome include hemorrhage volume, infratentorial location (brain stem and/or cerebellum), presence of intraventricular hemorrhage, and/or hydrocephalus [15, 20].
Hematoma volume can be measured from multiplanar reconstruction as the ratio ABC/2, being ABC the three orthogonal diameters (the diameters are multiplied—length × width × height—and divided by 2). It is also essential to depict intraventricular extension, since it represents a higher risk for hydrocephalus, especially if the clot is inside the aqueduct and/or IV ventricle. Brain herniation is associated with a dismal outcome, and may necessitate surgical decompression.
Other unfavorable factors of brain hematomas include advanced age, and high scores on the Glasgow Coma Score (GCS) and National Institutes of Health Stroke Scale (NHIHSS) at admission.
ICH score
ICH Score | Points | |
|---|---|---|
GCS score | 3–4 | 2 |
5–12 | 1 | |
13–15 | 0 | |
ICH volume (cm3) | ≥30 | 1 |
<30 | 0 | |
Intraventricular hemorrhage | Yes | 1 |
No | 0 | |
Infratentorial origin | Yes | 1 |
No | 0 | |
Age | ≥80 | 1 |
<80 | 0 | |
Total | 0–6 | |
It is also worthwhile to stress that up to 30% of brain hematomas will increase in size during the first 24 h, especially during the first 3 h after presentation, which may be associated with neurological decline [22]. Repeat CT scans at 24 h or whenever there is a neurological decline is recommended [22].
Intracranial venous thrombosis (IVT) is an important cause of intracranial hemorrhage, especially in young patients and children. There is also a higher incidence during pregnancy and puerperium and in females under oral contraception. IVT results from the formation and propagation of a venous clot leading to the occlusion of the intracranial venous system components. Venous thrombosis features a wide spectrum of clinical and imaging presentation. Headache is the most common symptom. The diagnosis of IVT includes the demonstration of the thrombus/venous occlusion (direct signs), depicted by CT (which depicts only one third of cases as hyperdense thrombus inside the dural sinus—dense triangle sign—or cortical vein—cord sign—) or by MRI by the loss of the normal venous flow void by a clot that follows the same signal intensity progression previously described for parenchymal hematomas. MRV or CTV is also helpful to establish the diagnosis. It is also important to depict the presence of intracranial lesions (indirect signs), such as brain swelling, brain edema, venous infarction, intracranial hemorrhage, which are better defined by MRI [23].
Vascular malformations are the leading cause of spontaneous intracranial hemorrhage in children and young patients, including cavernomas and brain arteriovenous malformations (AVMs).
Brain AVMs are composed by abnormal arteriovenous shunts, occurring in a central nidus, which is the central area towards multiple feeding arteries converge and from which (early and enlarged) draining veins start. Most of the cases are sporadic, but they may be associated with HHT/ROW and RASA 1 mutation or being a part of metameric syndromes. Brain AVMs appear as a tangled cluster of abnormal vessels, dilated arteries and veins, which can be sulcal, parenchymal, and/or intraventricular. Brain AVMs are constituted by feeding arteries, with the nidus corresponding to the shunting area and veins that drain the malformation. The vessels present slightly hyperdense on CT and with flow voids on MRI. Small AVMs may only be depicted by DSA which is the gold standard imaging method. They may be associated with surrounding brain changes such as edema, gliosis, previous hemorrhage, and/or mass effect. The most common brain AVM classification used is the Martin-Spetzler classification evaluating the size, location, and venous drainage of the brain AVM predicting the surgical risk for treatment. The hemorrhagic risk is higher for those AVM that have previously bled and for those with infratentorial, deep location, and deep venous drainage.

Cavernoma. Axial CT images (a) showing a slight hyperattenuating superior frontal gyrus lesion with central calcifications. The coronal T1-weighted (b) and T2-weighted (c) MR images demonstrate the “popcorn-like” appearance with intralesional hyper- and hypointense components in both sequences corresponding to blood in different stages. The axial T2*-weighted images (d) confirms the hemorrhagic nature of the lesion demonstrating the predominance of low signal with blooming effect
Dural arteriovenous fistulae (AVF) tend to present in older patients. They are acquired vascular malformations in which there are abnormal connections between arteries that normally feed the meninges, bone, or muscles, but not the brain, and the dural sinuses or small venules within the dura mater. They are difficult to depict since there is no evident nidus and the feeding arteries are not as dilated as in brain AVM. The dilatation of meningeal arteries, presence of small arteries at the dura sinus and/or arterialized dural sinus, diffuse venous congestion and/or dilated veins should raise the suspicion of dural AVF. The hemorrhage risk of dural AVF is higher when a cortical venous reflux is present. The most common classifications, the Cognard and the Borden classifications, address the type of venous drainage and predict the future risk for hemorrhage.
Brain tumors are responsible for approximately 10% of intracranial bleedings. Early diagnosis allows for specific treatment. The most common causes of hemorrhage associated with brain tumors are intratumoral and/or extratumoral hemorrhage from the tumoral mass, generally in hypervascularized tumors. Other causes of hemorrhagic stroke may exist in neoplastic patients, such as malignancy induced coagulopathy, side effects from chemotherapy and/or radiotherapy, hemorrhagic infarcts resulting from thrombotic coagulopathy, arterial tumoral emboli (in association with heart myxoma), or from venous thrombosis in thrombotic coagulopathy or in association with venous compression/invasion/thrombosis.
The tumors more commonly associated with brain hemorrhage are metastases, especially from breast and lung (bronchogenic) carcinoma, melanoma, choriocarcinoma, renal cell carcinoma, thyroid carcinoma, and primary highly vascularized tumors, such as high-grade gliomas.

Hemorrhagic tumor. Axial CT image (a) shows an acute hemorrhagic lesion (hyperattenuating) with intraventricular location (left frontal horn). The coronal T1-weighted (b) and axial T2-weighted (c) MR images demonstrate the heterogeneity of the signal intensities within the lesion not following the expected layered pattern of a primary hemorrhage. The coronal T1-weighted (d) and coronal T1-weighted (e) post contrast images of follow up MRI performed after 3 weeks demonstrate the absorption of the hemorrhage and demonstrate the underlying intraventricular contrast-enhancing lesion corresponding to a high grade glioma
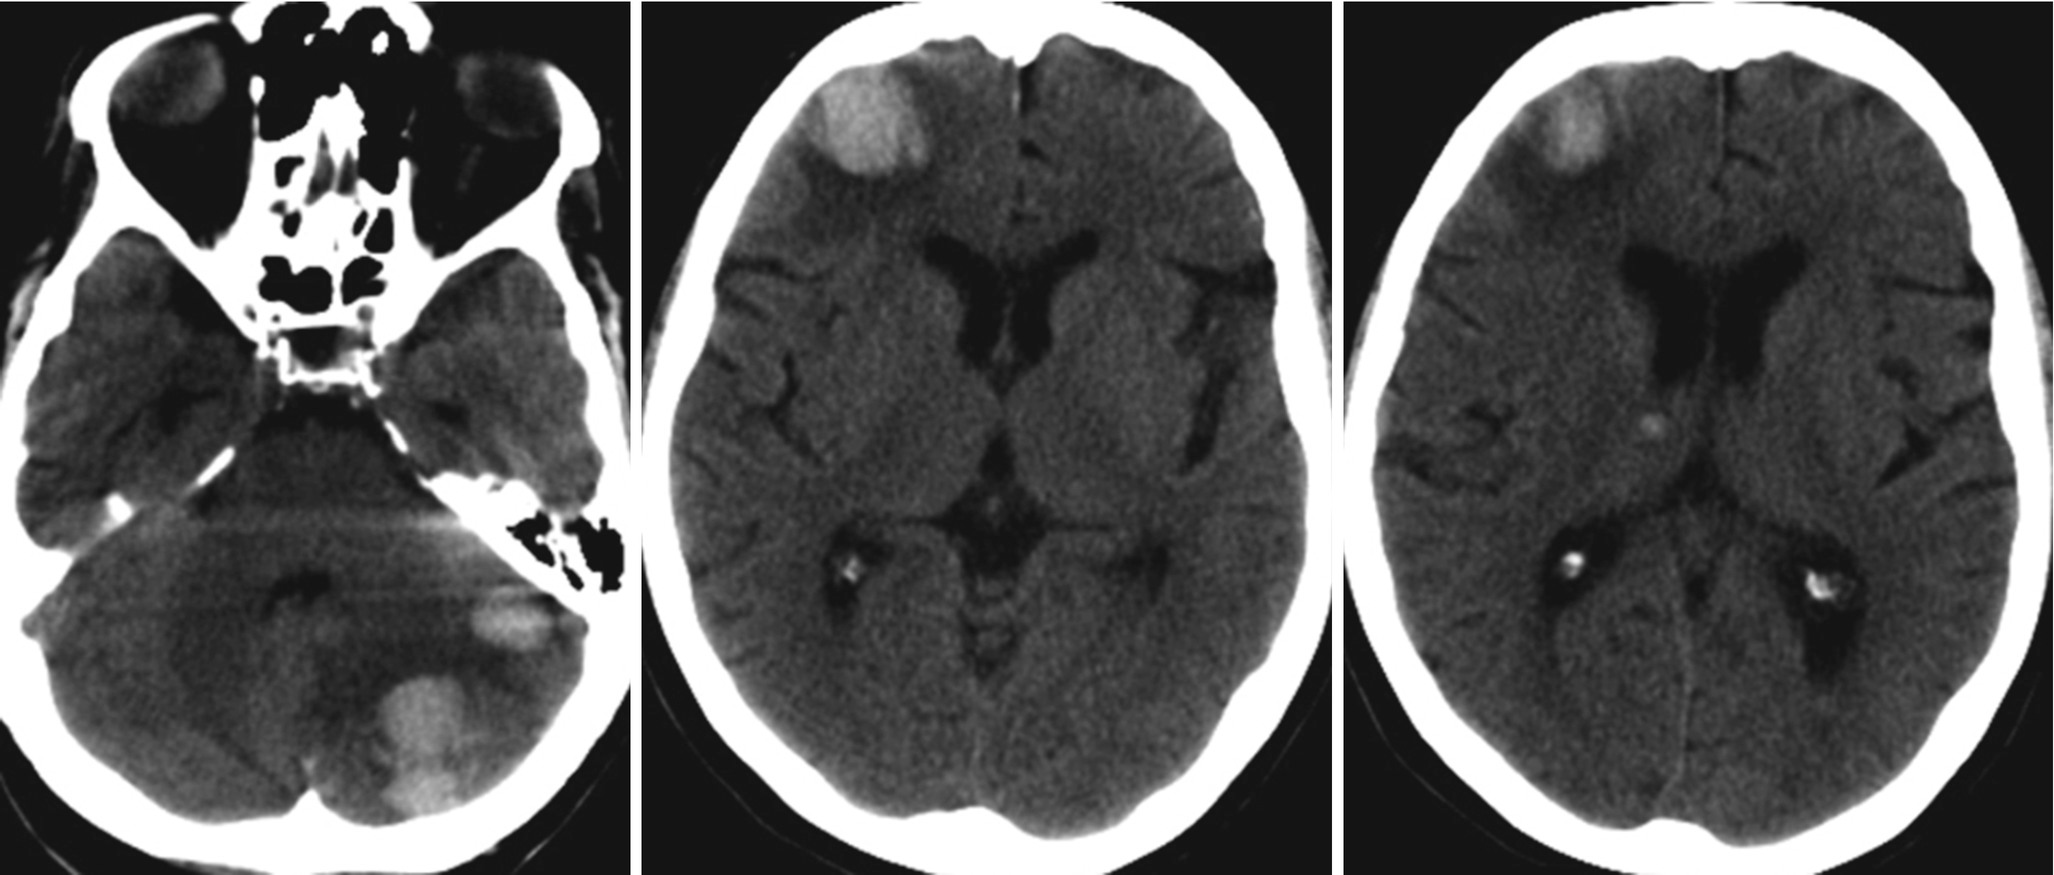
Acquired coagulopathy associated brain hemorrhages. Axial CT images demonstrating multiple (left cerebellar, right inferior frontal and thalamic) acute hemorrhages with associated intraventricular hemorrhage (blood level at the left atrium) in a patient with aplastic anemia and low platelets count (12,000/mcL)
It is not common to have brain hemorrhages associated with intracranial infections. Some of the typical examples include hemorrhagic encephalitis, such as herpes encephalitis, dengue fever, Crimean hemorrhagic fever-Congo virus, Epstein-Barr virus, and chikungunya virus, among others. Hemorrhage may also be a presentation of infectious vasculitis, such as varicella-zoster vasculitis. Fungal infection with vessel wall invasion may cause hemorrhage, e.g. in cases of aspergillosis and mucormycosis. Actinomycosis, paragonimiasis, cerebral malaria (due to hemorrhagic infarcts) may also present with devastating hemorrhagic lesions. Other causes of hemorrhage include infective endocarditis with septic emboli, hemorrhage associated with sepsis-induced coagulopathy and with infection treatment as in toxoplasmosis. In cases of meningitis, cerebral venous thrombosis and hemorrhagic transformation of ischemic infarcts may also lead to brain hemorrhage.
5.4 Subarachnoid Hemorrhage and Intraventricular Hemorrhage
The overall incidence of SAH is in between 9 and 20 per 100,000 person-years, accounting for up to 5% of all stroke cases [24–26]. The most common cause of spontaneous subarachnoid hemorrhage (SAH) is the rupture of an intracranial aneurysm, accounting for up to 80–85% of cases [24–26]. Ruptured saccular aneurysms commonly present with SAH located in the basal cisterns.
Additional causes of SAH include intracranial dissections, and for the cases with superficial/cortical subarachnoid hemorrhage, CAA, cortical venous thrombosis, vasculitis, reversible vasoconstriction syndrome (RVCS), distal arterial aneurysms, and dural arteriovenous fistulae (dAVF) should be considered.
Benign perimesencephalic SAH is a subgroup of SAH with an excellent prognosis. It accounts for up to 10% of cases and is believed to result from rupture of veins. Typically, the blood is collected at the perimesencephalic and prepontine cisterns and CTA and DSA are negative for the presence of aneurysm/vascular malformation.
DSA is the method of choice to screen for multiple aneurysms in all cases of SAH
In cases of typical perimesencephalic SAH follow-up DSA studies are not required
Isolated intraventricular hemorrhage is an uncommon location for spontaneous hemorrhage. It generally results from the direct expansion of a parenchymal hematoma or the recirculation of blood in a SAH case.
5.5 Epidural/Subdural Hemorrhage
Epidural and subdural hematomas are generally associated with head trauma. Exceptionally they may occur spontaneously in patients under anticoagulation or antiplatelet therapy. Isolated spontaneous EDH and SDH have been described most commonly in association with coagulopathies, dural and osteodural arteriovenous fistula, intracranial hypotension, and dural/bone tumors, especially metastases.
5.6 Conclusions
Imaging is essential for the management of intracranial hemorrhage. It allows for the depiction of the bleeding, the classification of the hemorrhage according to its size and location, to detect and/or exclude an underlying disorder, such as a vascular malformation, tumor, infection, among others. It also establishes the prognosis and guides the treatment.
The imaging characteristics of intracranial hemorrhages vary over time for both CT and MRI
In intracerebral hemorrhages the spot sign on CTA, reflecting contrast extravasation, deserves special attention since it is associated with a higher risk of growth of the hematoma
CAA shows a different lesion pattern than hypertensive hemorrhage pattern and can be recognized by the presence of superficial siderosis

Open Access This chapter is licensed under the terms of the Creative Commons Attribution 4.0 International License (http://creativecommons.org/licenses/by/4.0/), which permits use, sharing, adaptation, distribution and reproduction in any medium or format, as long as you give appropriate credit to the original author(s) and the source, provide a link to the Creative Commons license and indicate if changes were made.
The images or other third party material in this chapter are included in the chapter's Creative Commons license, unless indicated otherwise in a credit line to the material. If material is not included in the chapter's Creative Commons license and your intended use is not permitted by statutory regulation or exceeds the permitted use, you will need to obtain permission directly from the copyright holder.