CHAPTER ONE
The Beginning of the End
In retrospect, the temporary breakdown of the financial system seems like a bad dream. There are people in the financial institutions that survived who would like nothing better than to forget it and carry on with business as usual. This was evident in their massive lobbying effort to protect their interests in the Financial Reform Act that just came out of Congress. But the collapse of the financial system as we know it is real, and the crisis is far from over.
Indeed, we have just entered Act II of the drama, when financial markets started losing confidence in the credibility of sovereign debt.
—George Soros speech at the Institute of International Finance in Vienna, June 10, 2010
The bankruptcy of Lehman Brothers in the fall of 2008 drew the curtain on a very long 60-year Act I in the debt supercycle. You could feel in the air the end of a golden period, when ever-increasing quantities of debt could lead to ever more consumption and “wealth.” As stock markets crashed globally and the lines of unemployed lengthened, the end of the era was something we could observe in real time.
And let’s be very clear. That debt did fuel growth, not just in the United States but throughout the developed world. Figure 1.1 shows total U.S. debt as a percentage of GDP. We will return to this chart later, but here you can see the explosion of debt in the United States, both public and private. As we will see, there are any number of countries with similar charts.
Figure 1.1 Total U.S. Debt as a Percentage of GDP (through Q3 2009)

Source: Hoisington Investment Management, Bureau of Economic Analysis, Federal Reserve, Census Bureau: Historical Statistics of the United States Colonical Times to 1970.
Gary Shilling noted, “According to the Federal Reserve, Americans extracted $719 billion in cash from their houses in 2005 after a $633 billion withdrawal in 2004 and $439 billion in 2003. Back in the mid-1990s, it was less than $200 billion per year. This was easily accomplished with the help of accommodative lenders through refinancings and home equity loans. Other homeowners looked on their houses as golden geese that never stop laying, so they simply saved less and borrowed more on credit cards and other means to bridge the gap between their robust spending growth and meager income gains.”1
That $719 billion in one year is more than the recent stimulus in 2009. That is about 5 percent of GDP that went into all sorts of consumer spending. Clearly, the mortgage equity withdrawal was a large part of the growth after the 2001 recession. Without such “stimulus” the U.S. economy would not have grown nearly as much.
Things always appear more certain and clearer when we look backward. Usually big changes happen imperceptibly, and it is only in retrospect that we recognize them. For example, you can look back at the early 1980s and see the end of stagflation and the beginning of a new bull market in stocks, but at the time it didn’t feel like it. In fact, many people even thought we might enter a third recession when Continental Illinois Bank went bankrupt in 1984. Or you can look back at when China joined the World Trade Organization in 2001 and see it as a massive game changer in terms of global trade, but at the time it drew little attention. Do you remember where you were when China joined the WTO on December 11, 2001? Almost no one remembers it, but it has changed our lives.
The end of the debt supercycle is different. We all know we have seen the end of an era, and we have courtside seats to watch endgame unfold. We have seen the end of Act I: the debt supercycle. Now we will get to see how Act II, endgame, plays out.
One of the principal Chinese curses heaped upon an enemy is “May you live in an interesting age.” While the outcome of endgame is uncertain, one thing we can count on is that we will indeed live in interesting times.
We face a fundamentally different economic environment than we have lived in for the last 60 years. Throughout this book, we lay out the case that there is a massive reset of the global economy, some of it for the good and some of which will make us very uncomfortable, depending on the country in which you reside. But as individuals and governments come to the end of their ability to borrow massively, growth must come from different sources.
How Did the Debt Supercycle Come About?
Stability leads to instability, and success breeds its own undoing. The trend is your friend until it isn’t. Currently, government lending rates are close to zero and are at all time lows. The European Central Bank (ECB) has kept its policy rate at 1 percent, the Fed at 0.25 percent, the Bank of Japan is at 0.10 percent, and the Bank of England is at 0.50 percent. The largest central banks in the world are all afraid of deflation. How times change! If you rewind the clock to 1980, almost all central banks were hiking rates to almost 20 percent because inflation was the biggest fear. The story of how we got from 20 percent interest rates to 0 percent is one of the great ironies of our time. Low rates induced a false sense of confidence. It was possible to take on more and more debt at lower coupons, but the debt then piled so high that people became unable to repay it.
In 1980, most developed countries suffered from high inflation, which was the result of excessively loose monetary and fiscal policies. This had been 15 years in the making. To make matters worse, many workers were trapped in a wage price spiral. Simply put, if prices went up, wages went up automatically as well. If wages went up, then employers raised prices to try to compensate for higher labor costs. Higher prices lead to higher wages, which lead to higher prices. Wash, rinse, and repeat.
After more than a decade of excessive spending and borrowing, combined with a too loose money supply, central banks and governments finally got religion. The United States, the United Kingdom, and many European countries rolled back the unions, breaking the vicious wage price spiral, and central bankers like Paul Volcker showed they were willing to hike rates until it hurt to crush inflation. Inflation fell, and interest rates fell as well. From 1980 to 2010, as Figure 1.2 shows, 10-year yields fell from 16 percent to 3 percent.
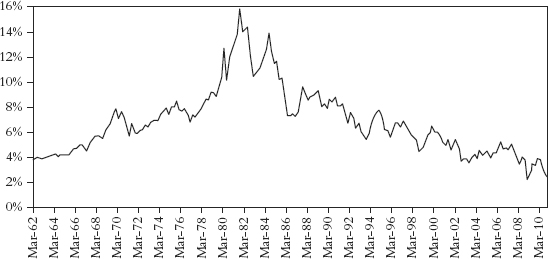
When interest rates fall, so does the cost of borrowing. It is easier to make your monthly interest payments. A payment on a 3 percent interest rate mortgage is much more manageable than an 8 percent interest mortgage payment, all things being equal. It also means you can borrow more money and buy a larger house if you choose.
The decline in interest rates and bond yields is almost the mirror image of rising borrowing, as Figure 1.3 shows. Debt grew much, much faster than GDP. Total debt rose from a level of 140 percent of GDP to about 370 percent of GDP today.
Figure 1.3 U.S. Nonfinancial Debt Outstanding versus U.S. 10-Year Yield
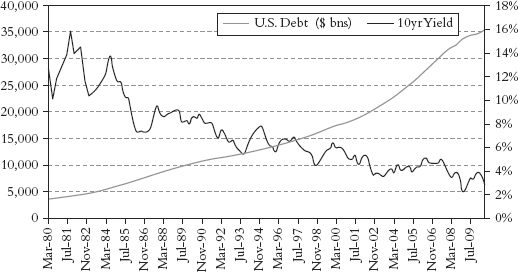
Source: Bloomberg, Variant Perception.
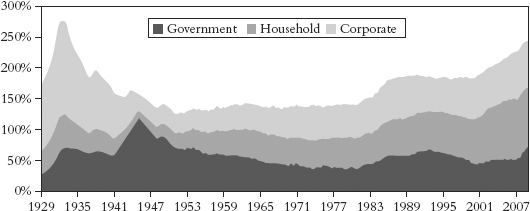
Figure 1.4 shows total debt levels for the United States as a percentage of GDP with each component of debt by type: government, Fannie Mae and Freddie Mac (agencies), bank debt, asset-backed securities (ABS), household debt, and corporate debt. As you can see, by far the biggest growth in debt has been in household and mortgage debt.

Arguably, Figure 1.4 overstates current debt on account of securitization, which allows debt to show up in more than one place. Some economists argue that ABS, financials, and agencies should not be included in the debt calculation. Debt issued by a financial or through securitization is also likely to appear in the nonfinancial data after financials lend on the money they raised in the debt markets.
Figure 1.5 eliminates such potential double counting and shows that we are roughly back at 1929 levels. But the ratio spiked in the 1930s because GDP fell, not because debt rose.
Figure 1.5 U.S. Debt (Excluding Financial, Government-Sponsored Enterprise/Agency, ABS) to GDP back to 1929
Source: Deutsche Bank, Bloomberg, BEA, Federal Reserve.
Which figure is right? It doesn’t really matter. No matter which chart you believe, the total stock of debt is extremely large, and a great deal of it probably will not be paid back in dollars that are close to the value of the dollar in 2011.
And this was not just a phenomenon in the United States. Look at the following charts. It was happening all over the developed world. Take a look at the Figure 1.6, which is a chart of G7 debt. That is one ugly and unsustainable chart. In 1950, the G7 countries were recovering from very large wartime debts. Now we don’t have that excuse. Nor do we have the option of doing what they did. They cut military spending, inflated a little in nominal terms, and grew their way out of the problem.
Figure 1.6 The Great Debt Swap (G7 Debt Soars after the Global Financial Crisis)
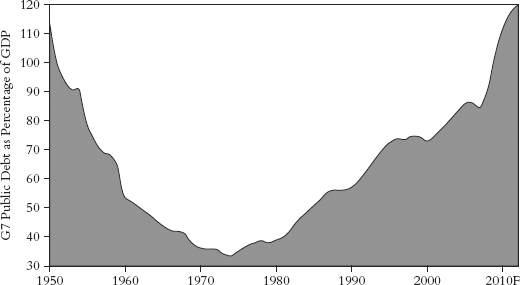
Source: IMF, Independent Strategy.
Common sense tells you that your debt cannot grow faster than your income forever, and at a certain stage, the huge pile of debt becomes unsustainable. All responsible parents teach their children not to let their debt grow faster than their income. It is only the Fed and Congress that are too foolish to get it.
It wasn’t only falling interest rates, though, that built up the pile of debt. Loose monetary policy helped, and deregulation and financial innovation provided a perfect excuse. From the late 1980s onward, monetary policy remained far too loose throughout the entire period. The Fed and other central banks confused low inflation with a successful monetary policy. That is their prime objective. The key, though, was regulatory failure. When the Berlin Wall fell in 1989, and when China and India opened up to world trade, suddenly the global labor pool increased massively. China started producing cheaper and cheaper consumer goods, but they started buying more and more commodities like oil, copper, and lead.
Prices for consumer goods went down while commodity prices went up, sending false signals to central banks. The Fed mainly looks at core inflation, not headline. Consumer goods prices go into core inflation; commodities go into headline inflation. When they saw that core inflation was falling, they thought monetary policy was not too hot, not too cold. Stable core inflation was one of the ingredients of the Goldilocks economy.
However, stable inflation merely allowed money and credit to grow too quickly, and that credit and money went into rising asset prices that became bubbles (first stocks and then housing), which do not get tracked by CPI. No one complained when their home prices inflated. The Fed ignored the housing bubble, and some even denied it. And they were absent without leave when it came to regulatory oversight.
Not only was the Fed excessively lax when it came to inflation but also it provided liquidity as the solution to any crisis. This all started when Alan Greenspan came to the Fed. On August 11, 1987, Alan Greenspan succeeded Paul Volcker as chairman of the Board of Governors of the Federal Reserve. Only two months later, he faced the 1987 stock market crash. Immediately after the crash, Greenspan stated that the Fed “affirmed today its readiness to serve as a source of liquidity to support the economic and financial system.” From then on, that was the mantra of the Fed.
Please note that we are not criticizing Greenspan for providing liquidity in 1987. It was an appropriate decision. One of the main tools the Fed has is to provide liquidity. As they say, if all you’ve got is a hammer, everything looks like a nail. And there are times when the problem is liquidity, and there are times when that is a secondary issue.
After the NASDAQ bubble burst, Greenspan and Bernanke lowered rates to 1 percent and kept them there far too long. The lessons all financial market participants learned was: “Load up on debt and take more risks; the Fed has your back.” It was the famous Greenspan put as the Fed stood ready to provide more liquidity when the markets were faltering.
The final blow off the top for the increase in debt was when the Fed kept rates at 1 percent. When the NASDAQ bubble collapsed, the Fed feared that it might be like the bursting of the Japanese bubble in the 1990s and that we might end up with deflation. The solution, in the words of the Fed was: “We draw the general lesson from Japan’s experience that when inflation and interest rates have fallen close to zero, and the risk of deflation is high, stimulus, both monetary and fiscal, should go beyond the levels conventionally implied by baseline forecasts of future inflation and economic activity.”2 With that in mind, the Fed kept rates at 1 percent for almost three years and promised it would keep rates low and only raise rates at a “measured pace,” which translated into layman’s terms was at a snail’s pace.
The final ingredient that capped it all off was securitization and the shadow banking system. Almost all bubbles require some form of new financial technology or financial engineering. In the 1920s, installment credit, broker loans, and margin debt helped lead to the debt bubble of the 1920s; in 2008, it was securitization and shadow banking that helped lead to the collapse.
The shadow banking system, a phrase coined by my good friend Paul McCulley at PIMCO, describes the vast financial patchwork of nonbanks that acted like banks. They took deposits, borrowing short, lending long. They took liquid assets and invested them in illiquid assets like mortgages. The beauty of it for the shadow banking system was that they didn’t have to hold any capital against their lending. Nice work if you can get it.
The shadow banking system could get away with something like this only with help of the ratings agencies, who should have been the cops but were handing out fake IDs to issuers, as McCulley so memorably put it. The ratings agencies declared that senior short-dated liabilities were just as good as bank deposits. The problem was that, unlike banks, the central bank didn’t regulate the shadow banking system and couldn’t bail them out without flipping over the chessboard and playing by a different playbook. That is when private debt very quickly became public debt.
Private Deleveraging and Public Leveraging Up
The beginning of the financial crisis and the end of the shadow banking system happened on August 9, 2007, when Bank Paribas (BNP) said that it could not value the mortgage assets in three of its off-balance sheet vehicles and that therefore the liability holders, who thought they could get out at any time, were frozen.3 When that happened, it kicked off a run on the shadow banking system that finally culminated in the bankruptcy of Lehman Brothers.
All the assets that had been securitized and sat on the balance sheets of money market funds would eventually make their way back onto the balance sheets of banks. The run wasn’t only restricted to the commercial paper market. Foreign central banks started dumping Fannie Mae and Freddie Mac mortgage bonds, forcing the Fed to start buying them unless it wanted to watch a full-scale implosion of the U.S. mortgage market.
Governments tried to stop the effects of the private sector paying back its debt and unleashing a major debt deleveraging cycle by running large fiscal deficits and printing massive amounts of money, causing the balance sheets of central banks and governments to explode. The sovereign sector is hurriedly plugging the gap left by the deleveraging private sector in the wake of the financial crisis. While households and corporations started paying back their debts, governments massively ramped up their borrowing.
Figure 1.7 is one of the most important charts you will see in this book. It is the passing of the baton from the private sector to the public sector. It is the transition from Act I to Act II. The debt supercycle gives way to endgame.

This has pronounced effects on government finances, as the chart for the U.S. fiscal balance going back to 1900 starkly shows. Our deficits are almost literally exploding off the chart, as Figure 1.8 shows.
Figure 1.8 U.S. Federal Deficit/Surplus ($ mns, 1901 to Present)
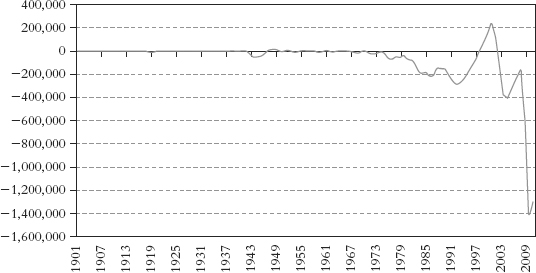
Source: Bloomberg, Variant Perception.
The extremely important point is this: for the most part, debts have not been extinguished, merely transferred. Debt is moving from consumer and household balance sheets to the government. While the debt supercycle was about the unsustainable rise of debt in the private sector, endgame is the crisis we will see in the public sector debt. Real endgame is when governments begin to run into the limits of their ability to borrow money at today’s low rates. Greece already has. Others will follow.
When people have too much debt, they typically default. When countries have too much debt, you have one of three options.
1. They can inflate away the debt.
2. They can default on it.
3. They can devalue and hurt any foreigners who are holding the debt. This is really just a variant of inflating it away.
The last point is particularly important. Figure 1.9 shows that stock market collapse of 1929 was followed by banking collapse of 1931. Both episodes were a prelude to the currency crises of the 1930s. Many people say that the United States has never defaulted, but it did leave the gold standard and impose a 30 percent loss on foreigners who were holding U.S. bonds. The debts they held from the United States were repaid in dollars that were worth much less.
Figure 1.9 Proportion of Countries with Banking and Debt Crises Weighted by Their Share of World Income
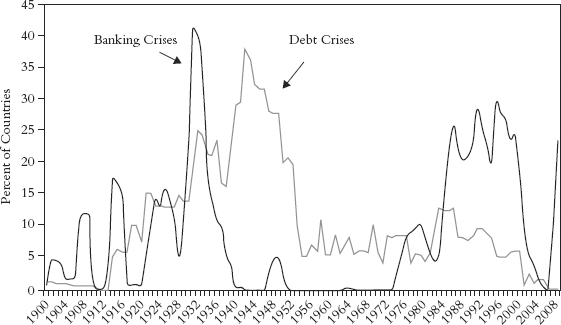
Source: Reinhart and Rogoff, “Banking Crises: An Equal Opportunity Menace,” www.bresserpereira.org.br/terceiros/cursos/Rogoff.Banking_Crises.pdf, National Bureau of Economic Research.
Needless to say, whenever one country devalues, its neighbors almost always follow right behind. Barry Eichengreen, who is one of the world experts on the 1930s, describes the situation:
In the 1930s, one country after another pushed down its exchange rate in a desperate effort to export its way out of depression. But each country’s depreciation only aggravated the problems of its trading partners, who saw their own depressions deepen. Eventually even countries that valued currency stability were forced to respond in kind.
In the end competitive devaluation benefited no one, it is said, since all countries can’t devalue their exchange rates against each another. The only effects were to fan political tensions, heighten exchange rate uncertainty, and upend the global trading system. Financial protectionism if you will.4
Clearly, not everyone can win devaluing, but we know that throughout history, that is what happens after banking crises.
As we wrote earlier, the outcomes for various countries around the world are path dependent. By that, we mean that the paths we choose will determine the outcome. Politicians can choose between bad outcomes and worse ones. Let’s hope they can choose wisely.
Large banking crises and deleveraging episodes typically lead to crises for countries. This has already started. In the past year, we have seen sovereign debt crises in Latvia, Greece, Hungary, Dubai, Iceland, and elsewhere. Dubai has little to do with Latvia and is nowhere close to the others. However, history teaches us that sovereign countries rarely default alone. Figure 1.10 shows a chart going back to 1800, from Carmen Reinhart and Ken Rogoff’s book This Time Is Different. It shows that sovereign defaults tend to cluster and they tend to happen suddenly after quiet periods. (Reinhart and Rogoff pretty much wrote the bible on debt cycles, and we’ll be devoting a chapter later to their impressive work, as well as a special interview with them.)
Figure 1.10 Sovereign External Debt 1800–2006, Percentage of Countries in Default or Restructuring
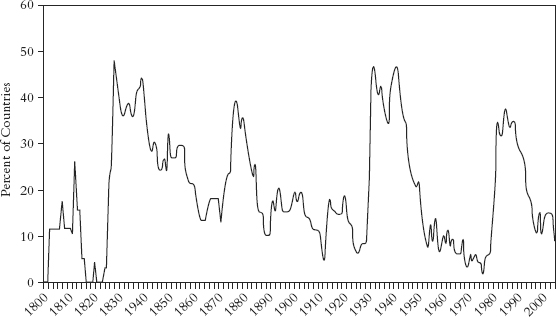
Source: Reinhart and Rogoff, This Time Is Different.
These clusters match the boom and bust cycles in international capital flows. The bursting of the global debt bubble guarantees beyond a doubt that we will have more sovereign crises ahead of us.
Many governments are finding it easy to borrow right now, but bad habits from the crisis may become entrenched. It is clear that nations whose public debt is mainly denominated in domestic currency and whose central bank is not very independent are likely to choose inflation and exchange rate depreciation over default as a way out of fiscal and financial unsustainability. That category could eventually (not this year!) include the United States and, to perhaps an even greater extent, the United Kingdom. (We will deal with competitive devaluations and the problems they present in a few chapters.)
Previously, central banks would do anything rather than monetize debt, but as Bernanke said about the Fed’s role in the crisis, “There are no atheists in the foxhole.” Going forward, now that the line of monetizing debt has been crossed, it will be easier and easier to do the wrong thing. The Fed and the Bank of England have in fact coordinated their actions with their treasuries, making a mockery of monetary independence. Going forward, they are likely to have a tendency to coordinate their actions again. That is exactly what has happened after previous banking crises.
As Figure 1.11 from Reinhart and Rogoff shows, inflation globally has risen as countries have monetized debts.
Figure 1.11 Inflation and External Default 1900–2006
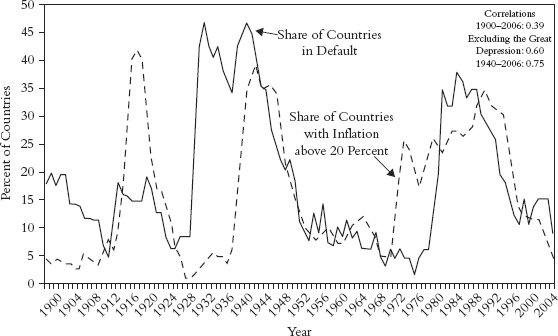
Source: Reinhart and Rogoff, “Banking Crises: An Equal Opportunity Menace,” www.bresserpereira.org.br/terceiros/cursos/Rogoff.Banking_Crises.pdf, National Bureau of Economic Research.
We suspect that if the Federal Reserve or the Bank of England were in Caracas, Venezuela, or Bogota, Colombia, instead of in Washington or London, we would probably have a currency crisis and inflation because of a crisis of confidence. You could say we are lucky that the United States and the United Kingdom have a store of credibility, but it is not unlimited.
Once again, governments and central banks are pursuing a risk management strategy and attempting to put out a global fire. Their responses will put us on a path-dependent outcome toward a bigger blowup.
Consider the following analogy. Global markets and economies are like forest fires. California and Baja California both have very similar forests and vegetation but have very different fire control policies. In California, small fires are put out regularly by firefighters. In Baja California, they are not. Paradoxically, this means that Baja California has many more small fires and almost no major fires, while California has very limited small fires and occasional major, catastrophic fires.
Lesson: Without small fires to clear the brush, enrich the soil, and unlock pine seeds, nature isn’t in balance. Avoiding small problems creates greater systemic problems when brush between the trees builds up.
Trying to micromanage the small fires in central banking and fiscal policy leads to growing confidence by risk takers, so you get fewer small fires and paradoxically a greater chance of a major catastrophic fire. Mopping up after financial bubbles with massive liquidity is merely chasing the wind, insofar as monetary and fiscal policies operate with a lag, but intervention is also creating greater systemic instability. The source of that greater instability is likely to be caused by out-of-control fiscal policies. Avoiding the pain of the current downturn will create larger fires in the future with more macroeconomic volatility and greater variability of inflation rates.
The bigger fire is ahead of us, not behind us. It is global endgame. For some countries, the end will mean default, for others inflation, and for yet others devaluation. Each country will be different. In this book, we’ll examine how each scenario plays out, and we’ll go country by country. Some countries have a fairly ugly future, while others still have a good chance of turning things around. We’ll be honest and unflinching, so let’s dive right in.