15
Peak Variability and Optimal Performance in Cortical Networks at Criticality
15.1 Introduction
Variability and fluctuation are among the most prominent and pervasive characteristics of neural dynamics in mammalian cortex. This fact is apparent in the trial-to-trial variability of responses to a repeated stimulus as well as in the large ongoing, that is, spontaneous, fluctuations in neural activity in the absence of a particular stimulus. For example, in the visual cortex, the spike count or spike rate that a neuron generates in response to a single repeated stimulus has variability that is similar in magnitude to the average response [1–5]. Ongoing fluctuations are even greater in magnitude when no stimulus is present [6] [7]. In fact, the ongoing fluctuations immediately preceding a stimulus strongly influence the ensuing response [8] [9]. In addition to evidence from electrophysiological studies, similar findings come from human brain imaging (electroencephalography (EEG), magnetoencephalography (MEG), functional magnetic resonance imaging (fMRI)) studies. The human brain spontaneously generates activity (the so-called resting state) with huge fluctuations and variability [10–12], and a large part of the trial-to-trial variability in evoked brain responses can be explained by considering the immediately preceding spontaneous fluctuations [13] [14]. For a review, see [15], which mostly addressed fMRI-BOLD studies. Thus, better understanding of ongoing fluctuations will also entail better understanding of the variability in cortical response to input. However, the importance of understanding the origins of ongoing activity fluctuations extends beyond the questions of how it affects response to stimulus. Mounting evidence demonstrates that fluctuations of ongoing activity reflect previous experience [6] [16–19], which implicates a role for ongoing fluctuations in internal cognitive processes such as consolidation of memory. In line with this view, there are dramatic changes in the character of ongoing activity during development [20] as well as developmental changes in variability of task-evoked neural activity [21] [22].
There are numerous potential underlying mechanisms for large fluctuations and high variability in cortical network dynamics. At the synaptic level, the release of neurotransmitters is a stochastic process, which often results in total failure of a presynaptic spike to elicit a postsynaptic response [23]. At the systems level, ongoing changes in mood, vigilance, attention, and more may influence the observed fluctuations of cortical neural populations [24] [25]. Another population-level explanation of highly variable spiking is balanced excitation and inhibition [26] [27]. Here, we focus on a source of variability of ongoing activity that has been studied less. We hypothesize that variability is the result of operating near criticality. In this chapter, we review recent experimental studies in mammals that support this hypothesis.
15.2 Fluctuations are Highest Near Criticality
The theory of criticality describes and quantifies a system's behavior when it is poised at the brink of a second-order phase transition. At criticality, systems are endowed with unusual properties that are absent when the system is away from the critical point. One of the most fundamental of such critical phenomena is the lack of a dominant length scale and, for nonequilibrium systems, the lack of a dominant time scale in the system dynamics. Rather, all scales play an important role in the system's dynamics – fluctuations may be tiny at one moment, but may span the entire system a moment later. In contrast, when systems operate in a regime far from criticality, only one or a few scales dominate the dynamics. In critical systems, correlations between different parts of the system exist at small scales, but also extend across intermediate and large scales. In fact, the correlation length is highest at criticality compared to noncritical regimes. Thus, if the cortex operates near criticality, then we expect diverse cortical dynamics with a high degree of fluctuation as the system explores the wide range of spatiotemporal scales available to it. Figure 15.1 shows examples of network dynamics generated by a model operating far from criticality (Figure 15.1a,c) and near criticality (Figure 15.1b). It is immediately apparent in this example that variability is largest near criticality.
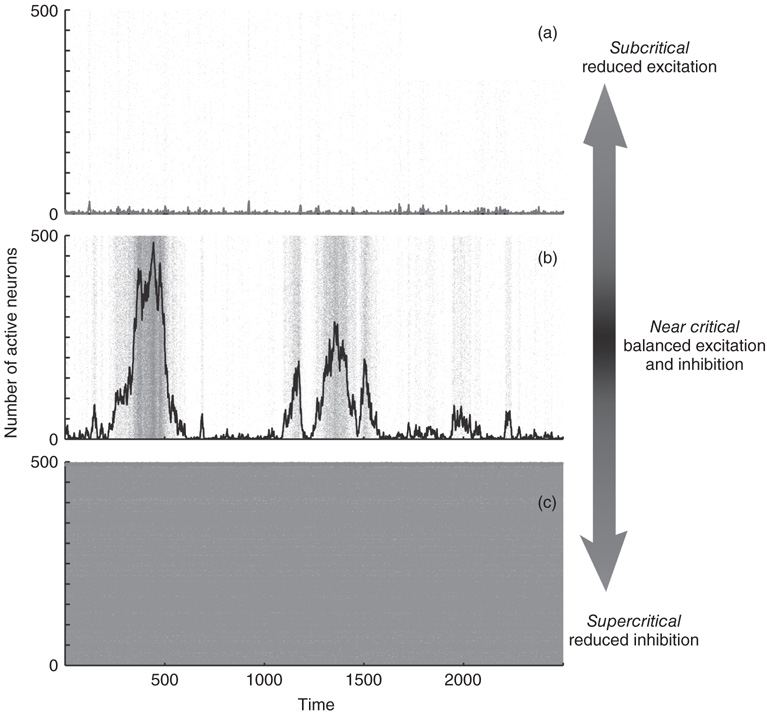
Figure 15.1 Dynamic variability is greatest at criticality. Three examples of dynamics generated by a model comprised of 500 leaky integrate-and-fire neurons. The network is all-to-all connected with 20% inhibitory neurons. When the excitatory and inhibitory connections are balanced appropriately [28], the network operates at criticality. (a) When excitation is reduced by 10%, the system is subcritical with few active neurons and very low fluctuations. The gray dots represent a spike raster. The black line represents the number of active neurons. (b) At criticality, the inhibitory neurons balance the excitatory neurons and activity fluctuates greatly. (c) When the strengths of inhibitory connections are reduced by 10% compared to the critical case, the system is supercritical. Most neurons are active, but fluctuations are very small. For supercritical dynamics, the activity never ceases. For the subcritical and critical cases, these example time series appear ceaseless because activity was restarted whenever it came to a quiescent state by activating a randomly chosen single neuron.
How can this possibility be tested in experiments? It is crucial that the experimentalist be able to tune the cortex through a range of different operating regimes putatively including criticality as well as noncritical regimes. Without this ability to compare critical versus noncritical conditions, one cannot conclude that criticality gives rise to the largest fluctuations. Below, we review two experimental studies in which cortical networks were tuned using pharmacological agents which change the balance of excitation and inhibition [28] [29]. In both studies, the degree of variability of cortical neural activity was assessed using Shannon entropy. In the first study, spatial patterns of spontaneous and evoked activity were studied. Temporal fluctuations of spontaneous activity were examined in the second study, with a focus on phase synchrony. In both studies, entropy was found to be highest when the cortex was tuned to operate nearest to putative criticality, thus supporting the hypothesis that criticality results in maximal fluctuations of ongoing dynamics in the cortex.
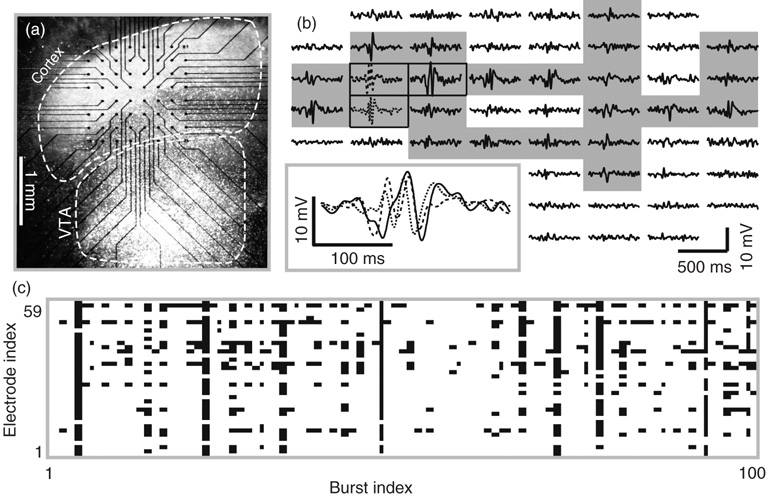
Figure 15.2 Spontaneous burst of neuronal activity in cortex organotypic cultures grown on planar microelectrode arrays (MEAs). (a) Light-microscopic image of a neural culture including somatosensory cortex and ventral tegmental area (VTA) grown on a 60-channel MEA. Black dots indicate the location of the n = 59 recording electrodes. The ground electrode is outside the imaged region. (b) Example of local field potential (LFP) traces simultaneously recorded during a burst of neural activity (no drugs applied). The spatial arrangement of LFP traces matches that of the electrodes from which they were recorded. Inset: magnified view of three LFP traces. The traces with gray background are considered to be active during the burst (fluctuations >4 SD). (c) Raster displaying patterns of active recording sites for 100 consecutive bursts. Each column represents one burst, and each row represents one recording site. Black – active; white – quiescent.
15.3 Variability of Spatial Activity Patterns
The study of Shew et al. [29] provided the first experimental support for the hypothesis that the diversity of cortical activity patterns is maximized at criticality. They studied local field potential (LFP) dynamics in cortex slice cultures grown on the surface of multielectrode arrays [30]. The micro-electrode array provided simultaneous measurements from many recording sites arranged on an 8 × 8 square grid covering 1.4 × 1.4 mm2 (Figure 15.2a). The spacing between adjacent electrodes was 200 μm. The electrodes were also used to deliver an electrical shock stimulus to a single location. Both spontaneous and stimulus-evoked cortical activity patterns were studied. In these slice cultures, activity (both spontaneous and stimulus-evoked) was burst-like. Bursts were diverse; some manifested as a brief fluctuating signal at a single electrode, while other bursts spanned multiple electrodes and hundreds of milliseconds. An example burst is shown in Figure 15.2b. Consecutive bursts were well separated in time by clear periods of quiescence. Shew et al. [29] analyzed the spatial patterns of bursts. Temporal aspects of these bursts were studied later in Yang et al. [28] (see Section 15.4). The spatial pattern of one burst was defined, on the basis of which electrodes in the array displayed high amplitude neuronal activity during the burst (shaded recording sites in Figure 15.2b). Different spatial patterns correspond to different groups of activated neurons. After a large number of bursts were recorded, the variability of spatial patterns was assessed by computing the Shannon entropy. The diversity of different spatial patterns is illustrated in Figure 15.2c.
With the aim of tuning the cortex cultures through a range of operating regimes, potentially including criticality, Shew et al. [29] altered the balance of excitatory and inhibitory interactions in the cortical network using pharmacological means. Empirically, they found that reducing inhibition (partially blocking the GABAA channels) resulted in network dynamics very similar to the supercritical dynamics observed in nonequilibrium models (e.g., directed percolation), and reducing excitation (partially blocking glutamate channels) led to dynamics similar to subcritical activity. Importantly, neuronal avalanches typically occurred when no drug was applied to the tissue, suggesting that the default operating regime of the cortex is near criticality and that the drugs push the network away from the critical state (Figure 15.3a). Consistent with this possibility, the entropy of burst patterns was also highest when no drug was applied (Figure 15.3b,c). For either reduced inhibition or reduced excitation, the entropy dropped, just as expected for subcritical and supercritical regimes. These results held for both spontaneous and stimulus-evoked bursts.
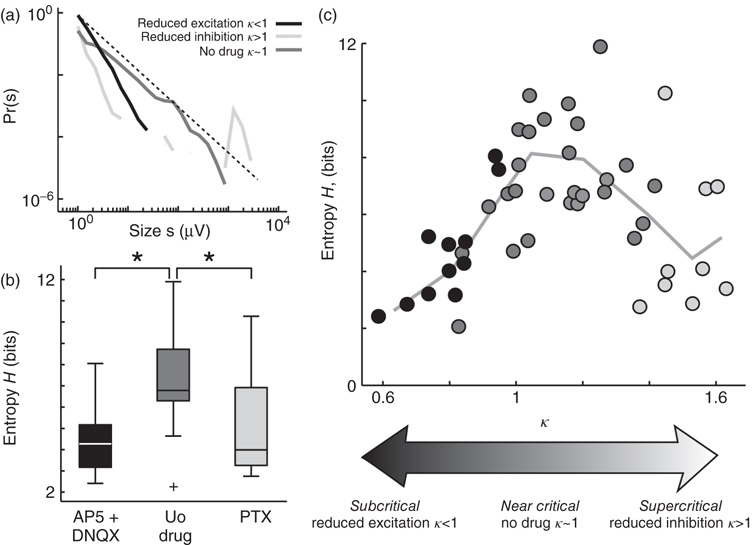
Figure 15.3 Maximized information capacity at criticality. (a) Example probability density distributions of spontaneous burst sizes for a normal (no drug, dark gray), reduced inhibition (PTX, light gray), and reduced excitation (AP5/DNQX, black). Broken line: −3/2 power law. Burst size s is the sum of n LFP peak amplitudes during the burst (see [29] for details). Note that the distribution is closest to a power law with −3/2 exponent when no drug is added, suggesting that the system operates near criticality. (b) Information capacity (entropy H) of the pattern repertoire is maximized when no drugs perturb the E/I ratio. Significant differences marked with * (p < 0.05). Box plot lines indicate lower quartile, median, upper quartile; whiskers indicate range of data, excluding outliers (+, > 1.5 times the interquartile range). (c) Pattern entropy H peaks near criticality, indicated by κ ≈ 1. Each point represents one recording of ongoing activity (n = 47, 8 × 8 MEA, 1 h, gray scale indicates drug condition; light gray = PTX, black = AP5 + DNQX, dark gray = no drug). Line is the binned average of points. κ is a parameter to quantify proximity to criticality based on similarity of the burst size distribution to a −3/2 power law. Typically, the no-drug condition would have κ close to 1, reduced inhibition κ > 1, and reduced excitation state with κ < 1. Details can be found in [28] [29, 31].
15.4 Variability of Phase Synchrony
The results of Shew et al. [29] were primarily concerned with variability of spatial patterns. However, the bursts of activity they studied also exhibited rich temporal dynamics (see inset in Figure 15.2b), which was not studied in Shew et al. [29]. To obtain a better understanding of these dynamics, Yang et al. [28] studied phase synchrony across different recording electrodes using exactly the same experimental dataset as studied by Shew et al. [29]. Across the same range of drug-altered excitation and inhibition conditions, they compared both the mean levels of synchrony and its variability.
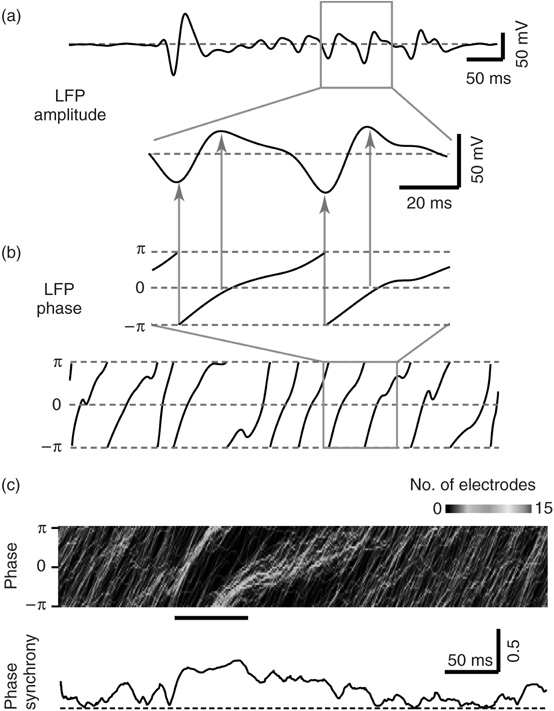
Figure 15.4 Assessing phase synchrony from multisite LFP recordings. (a) Example LFP amplitude trace recorded from a single electrode under disinhibited condition. A 100 ms period (gray box) is expanded (lower trace). (b) Using the Hilbert transform, the LFP amplitude trace is converted to a corresponding phase trace. Top: Phase corresponding to expanded LFP trace. Note that phase near ± π corresponds to negative LFP peaks, while phase near zero coincides with positive LFP peaks (arrows). Lower trace shows the phase for the full time period in (a). (c) Example of phase synchrony dynamics under normal condition. Duration of the burst is indicated by the black bar. Top: Dynamic phase histogram. Gray scale indicates the number of electrodes with a given phase (vertical axis) at a given time (horizontal axis). Phase “bundles” marked by light gray/white pixels over time indicate many sites with the same phase, that is, in-phase locking. Bottom: Phase synchrony quantified with Kuramoto's order parameter r. Dashed line indicates r = 0. Phase synchrony r is high during periods of in-phase locking.
Yang et al. [28] used the Hilbert transform to extract phase traces from the LFP traces of each electrode (Figure 15.4a,b). The network-level phase synchrony at any given instant was quantified using Kuramoto's order parameter [32] [33], treating each electrode as one phase oscillator. During a burst, phase signals from many different sites tended to transiently synchronize, and then desynchronize when the burst ended (Figure 15.4c). For each burst, the network-level phase synchrony was averaged over the duration of the burst to obtain a single number that quantifies the degree of synchrony in the network during the burst. Thus, for a recording in which many thousands of bursts occurred, a distribution of burst synchrony values was obtained. The Shannon entropy of this distribution was computed to quantify the variability. In line with Shew et al. [29], they found that neuronal synchrony is maximally variable when no drug altered excitation and inhibition and neuronal avalanches occurred (Figure 15.5). When excitation or inhibition was altered with drugs, neuronal avalanches were abolished, and the variability of synchrony dropped. Given that neuronal avalanches are expected to occur at criticality, the results of Yang et al. [28] constitute the first experimental evidence that network-level synchrony in the cortex is most variable near criticality.
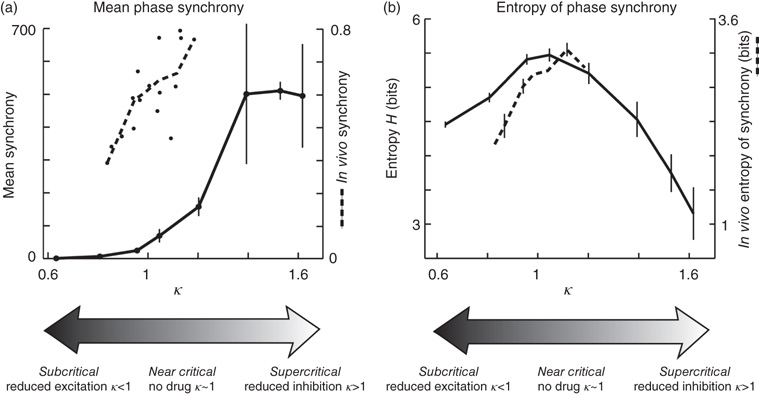
Figure 15.5 Neural synchrony attains moderate mean and maximum entropy near criticality. (a) Mean network synchrony in vitro (solid black) rises slowly for low κ, increases sharply near or just above κ = 1, and saturates for high κ. Here, synchrony is averaged over bursts. The synchrony of one burst is the integral of r over the burst duration. Dashed black: Mean network synchrony in vivo. For in vivo data, synchrony of one burst was defined as the average of r over the burst duration. Each point represents one recording of ongoing activity (n = 16, Michigan probe 8 × 4, 0.5 h). (b) The variation of synchrony across bursts was quantified with entropy. The entropy peaked close to κ = 1. Since κ = 1 is expected near criticality, these findings support the hypothesis that variability of network dynamics is highest near criticality. Findings in vivo (dashed black) are in line with in vitro results (solid black).
Preliminary results in vivo are in line with the findings of Yang et al. [28]. A 32-channel probe was inserted in the barrel cortex of urethane-anesthetized rats, LFPs were recorded, and the phase signal and variability of synchrony were computed similar to the in vitro analysis. Despite the limited range in κ, which reflects variability between different experiments in the absence of any drug manipulation, these preliminary data are consistent with the results of Yang et al. [28]: that is, the variability of synchrony is highest when the cortical state is close to criticality (Figure 15.5, dashed black).
15.5 High Variability, but Not Random
Above, we have emphasized that dynamic variability is high at criticality. Here we address the question: high compared to what? From the experimentalist's point of view, the two reviewed experiments demonstrate that systematically altering the balance of excitation and inhibition away from their “default” levels results in a reduction in variability. On comparing with models and theory, these results correspond to the fact that entropy at criticality is higher than that found in subcritical or supercritical regimes. However, the observed values of entropy were very far from the upper bounds they could theoretically reach. This upper bound would be reached if the neural activity at different electrodes was totally independent with equal probability to be active or inactive in each burst. In contrast, the observed activity near criticality was often rather correlated across distant recoding sites. While the high variability at criticality is partly due to stochastic aspects of the underlying network, it should not be interpreted as totally random; criticality would not exist if not for the coordinated interactions among the neurons. Indeed, criticality is often described as a regime at the boundary between randomness and order.
15.6 Functional Implications of High Entropy of Ongoing Cortex Dynamics
Is high entropy a good thing when it comes to spatial patterns and phase synchrony of cortical network dynamics? As Shannon suggested with his use of entropy to quantify information, high entropy can be good as long as the information in question is useful. Indeed, many information theoretic studies have found that maximizing entropy of neural responses considering the statistics of the stimuli may be a common “design principle” in sensory systems [34–41]. However, in the two studies reviewed in the previous sections of this chapter, most of the entropy measurements were done on spontaneous activity. Thus, we may rephrase our question: Does spontaneous activity contain useful information? Given that spontaneous activity consumes 80% of the energy used by the brain [42], it would be surprising if the answer to this question is no. However, whether information is useful or not clearly depends on context. For example, a long-standing tradition in sensory neuroscience is to treat ongoing, spontaneous activity as a noisy hindrance to reliable encoding of sensory input (not useful information) [43]. However, this point of view was directly challenged in experiments which showed that exactly the same conditions that result in high entropy of spontaneous activity are also optimal for transfer of information from stimulus to response [29] [31]. This aspect of these studies has recently been reviewed elsewhere [44]. Similarly, variability of task-related brain activity in humans is positively correlated with task performance [21] [22]. Moreover, a growing number of studies are uncovering traces of recent experiences in spontaneous activity, implicating a more interesting role for spontaneous activity in internal cognitive processes such as memory consolidation [16–19]. In this view, the information contained in spontaneous activity is potentially important whether or not it is directly evoked by sensory input. More generally, if we consider that any given cortical microcircuit may be responsible for processing input from both the thalamus (sensory processing) and from other cortical microcircuits (internal cognitive processing), then it is clear that this microcircuit must have a large repertoire of accessible activated states to work with. The microcircuit must switch among its different possible roles in cortical information processing. This switching is likely to manifest as high entropy ongoing dynamics. Indeed, low entropy dynamics would necessarily constrain the possible contributions to cortical information processing. Therefore, we suggest that having high entropy, whether spontaneous or stimulus-evoked, is a beneficial property of cortical network dynamics. If this is indeed true, then criticality is an optimal regime of operation for the cortex, which may contribute to explaining why so many studies have observed neuronal avalanches in the cortex.
References
- 1. Tolhurst, D.J., Movshon, J.A., and Dean, A.F. (1983) The statistical reliability of signals in single neurons in cat and monkey visual cortex. Vision Res., 23, 775–785.
- 2. Vogels, R., Spileers, W., and Orban, G.A. (1989) The response variability of striate cortical neurons in the behaving monkey. Exp. Brain Res. (Experimentelle Hirnforschung Expérimentation cérébrale), 77, 432–436.
- 3. Softky, W.R. and Koch, C. (1993) The highly irregular firing of cortical cells is inconsistent with temporal integration of random EPSPs. J. Neurosci.: Off. J. Soc. Neurosci., 13, 334–350.
- 4. Swindale, N.V. and Mitchell, D.E. (1994) Comparison of receptive field properties of neurons in area 17 of normal and bilaterally amblyopic cats. Exp. Brain Res., 99, 399–410.
- 5. Holt, G.R., Softky, W.R., Koch, C., and Douglas, R.J. (1996) Comparison of discharge variability in vitro and in vivo in cat visual cortex neurons. J. Neurophys., 75, 1806–1814.
- 6. Luczak, A., Barthó, P., and Harris, K.D. (2009) Spontaneous events outline the realm of possible sensory responses in neocortical populations. Neuron, 62, 413–425.
- 7. Churchland, M.M. et al. (2010) Stimulus onset quenches neural variability: a widespread cortical phenomenon. Nat. Neurosci., 13, 369–378.
- 8. Arieli, A., Sterkin, A., Grinvald, A., and Aertsen, A. (1996) Dynamics of ongoing activity: explanation of the large variability in evoked cortical responses. Science, 273, 1868–1871.
- 9. Azouz, R. and Gray, C.M. (1999) Cellular mechanisms contributing to response variability of cortical neurons in vivo. J. Neurosci.: Off. J. Soc. Neurosci., 19, 2209–2223.
- 10. Linkenkaer-Hansen, K., Nikouline, V.V., Palva, J.M., and Ilmoniemi, R.J. (2001) Long-range temporal correlations and scaling behavior in human brain oscillations. J. Neurosci.: Off. J. Soc. Neurosci., 21, 1370–1377.
- 11. Corbetta, M. and Shulman, G.L. (2002) Control of goal-directed and stimulus-driven attention in the brain. Nat. Rev. Neurosci., 3, 201–215.
- 12. Laufs, H., Krakow, K., Sterzer, P., Eger, E., Beyerle, A., Salek-Haddadi, A., and Kleinschmidt, A. (2003) Electroencephalographic signatures of attentional and cognitive default modes in spontaneous brain activity fluctuations at rest. Proc. Natl. Acad. Sci. U.S.A., 100, 11053–11058.
- 13. Fox, M.D., Snyder, A.Z., Zacks, J.M., and Raichle, M.E. (2006) Coherent spontaneous activity accounts for trial-to-trial variability in human evoked brain responses. Nat. Neurosci., 9, 23–25.
- 14. Fox, M.D., Snyder, A.Z., Vincent, J.L., and Raichle, M.E. (2007) Intrinsic fluctuations within cortical systems account for intertrial variability in human behavior. Neuron, 56, 171–184.
- 15. Fox, M.D. and Raichle, M.E. (2007) Spontaneous fluctuations in brain activity observed with functional magnetic resonance imaging. Nat. Rev. Neurosci., 8, 700–711.
- 16. Tsodyks, M., Kenet, T., Grinvald, A., and Arieli, A. (1999) Linking spontaneous activity of single cortical neurons and the underlying functional architecture. Science, 286, 1943–1946.
- 17. Kenet, T., Bibitchkov, D., Tsodyks, M., Grinvald, A., and Arieli, A. (2003) Spontaneously emerging cortical representations of visual attributes. Nature, 425, 954–956.
- 18. Ji, D. and Wilson, M.A. (2007) Coordinated memory replay in the visual cortex and hippocampus during sleep. Nat. Neurosci., 10, 100–107.
- 19. Han, F., Caporale, N., and Dan, Y. (2008) Reverberation of recent visual experience in spontaneous cortical waves. Neuron, 60, 321–327.
- 20. Berkes, P., Orban, G., Lengyel, M., Fiser, J., and Orbán, G. (2011) Spontaneous cortical activity reveals hallmarks of an optimal internal model of the environment. Science, 331, 83–87.
- 21. McIntosh, A.R., Kovacevic, N., and Itier, R.J. (2008) Increased brain signal variability accompanies lower behavioral variability in development. PLoS Comput. Biol., 4, e1000106.
- 22. Garrett, D.D., Kovacevic, N., McIntosh, A.R., and Grady, C.L. (2011) The importance of being variable. J. Neurosci., 31, 4496–4503.
- 23. Borst, J.G.G. (2010) The low synaptic release probability in vivo. Trends Neurosci., 33, 259–266.
- 24. Alkire, M.T., Hudetz, A.G., and Tononi, G. (2008) Consciousness and anesthesia. Science (New York), 322, 876–880.
- 25. Fekete, T., Pitowsky, I., Grinvald, A., and Omer, D.B. (2009) Arousal increases the representational capacity of cortical tissue. J. Comput. Neurosci., 27, 211–227.
- 26. van Vreeswijk, C. and Sompolinsky, H. (1996) Chaos in neuronal networks with balanced excitatory and inhibitory activity. Science (New York), 274, 1724–1726.
- 27. Shadlen, M.N. and Newsome, W.T. (1998) The variable discharge of cortical neurons: implications for connectivity, computation, and information coding. J. Neurosci.: Off. J. Soc. Neurosci., 18, 3870–3896.
- 28. Yang, H., Shew, W.L., Roy, R., and Plenz, D. (2012) Maximal variability of phase synchrony in cortical networks with neuronal avalanches. J. Neurosci., 32, 1061–1072.
- 29. Shew, W.L., Yang, H., Yu, S., Roy, R., and Plenz, D. (2011) Information capacity and transmission are maximized in balanced cortical networks with neuronal avalanches. J. Neurosci., 31, 55–63.
- 30. Plenz, D., Stewart, C.V., Shew, W., Yang, H., Klaus, A., and Bellay, T. (2011) Multi-electrode array recordings of neuronal avalanches in organotypic cultures. J. Visual. Exp., 1, 2949.
- 31. Shew, W.L., Yang, H., Petermann, T., Roy, R., and Plenz, D. (2009) Neuronal avalanches imply maximum dynamic range in cortical networks at criticality. J. Neurosci., 29, 15595–15600.
- 32. Strogatz, S.H. (2001) Exploring complex networks. Nature, 410, 268–276.
- 33. Arenas, A., Diazguilera, A., Kurths, J., Moreno, Y., and Zhou, C. (2008) Synchronization in complex networks. Phys. Rep., 469, 93–153.
- 34. Laughlin, S. (1981) A simple coding procedure enhances a neuron's information capacity. Z. Naturforsch., C: Biosci., 36, 910–912.
- 35. Laughlin, S.B. (2001) Energy as a constraint on the coding and processing of sensory information. Curr. Opin. Neurobiol., 11, 475–480.
- 36. Dong, D. and Atick, J. (1995) Statistics of natural time-varying images. Network: Comput. Neural Syst., 6, 345–358.
- 37. Dan, Y., Atick, J.J., and Reid, R.C. (1996) Efficient coding of natural scenes in the lateral geniculate nucleus: experimental test of a computational theory. J. Neurosci.: Off. J. Soc. Neurosci., 16, 3351–3362.
- 38. Li, Z. (1996) A theory of the visual motion coding in the primary visual cortex. Neural Comput., 8, 705–730.
- 39. Baddeley, R., Abbott, L.F., Booth, M.C., Sengpiel, F., Freeman, T., Wakeman, E., and Rolls, E.T. (1997) Responses of neurons in primary and inferior temporal visual cortices to natural scenes. Proc. R. Soc. Lond. B Biol. Sci., 264, 1775–1783.
- 40. Bhandawat, V., Olsen, S.R., Gouwens, N.W., Schlief, M.L., and Wilson, R.I. (2007) Sensory processing in the Drosophila antennal lobe increases reliability and separability of ensemble odor representations. Nat. Neurosci., 10, 1474–1482.
- 41. Garrigan, P., Ratliff, C.P., Klein, J.M., Sterling, P., Brainard, D.H., and Balasubramanian, V. (2010) Design of a trichromatic cone array. PLoS Comput. Biol., 6, e1000677.
- 42. Zhang, D. and Raichle, M.E. (2010) Disease and the brain's dark energy. Nat. Rev. Neurol., 6, 15–28.
- 43. Lee, D., Port, N.L., Kruse, W., and Georgopoulos, A.P. (1998) Variability and correlated noise in the discharge of neurons in motor and parietal areas of the primate cortex. J. Neurosci.: Off. J. Soc. Neurosci., 18, 1161–1170.
- 44. Shew, W.L. and Plenz, D. (2012) The functional benefits of criticality in the cortex. Neurosci.: Rev. Bringing Neurobiol. Neurol. Psychiatry, 32, 9817–9823.