Now that you know what doesn’t work in the stock market, it’s time to look at what does: the 3 percent signal, hereafter shorthanded to 3Sig. You’re going to tune out the z-vals in favor of running this signal’s proven system just four times per year.
We’ll begin this chapter with an overview of the plan. Next we’ll explore price fluctuation, the market characteristic that is the powder behind 3Sig’s bullet. There are only three directions the stock market can go: up, sideways, or down. It moves forward by switching among these directions at its own pace, and from this unpredictable fluctuation we’re supposed to achieve profit by selling at prices higher than we paid. If we automate the process using arithmetic, even random price changes can work for us rather than against us, as you’ll discover when we extend the coin toss example you saw in the last chapter. We can’t know in advance what the coin will do, but we can know how we’ll react to what it does.
In this sense, fluctuation is beautiful. We need prices to change in order to benefit from buying and selling. If they didn’t, adding money to the stock market would be the same as depositing into and withdrawing from a bank account that paid no interest. However, fluctuation can get ugly when our powers of premonition fail us (as they’re wont to do) and we end up selling things for less than we paid to buy them. These things are usually stocks, mutual funds, and exchange-traded funds. With 3Sig, we will rationally react to fluctuation in their prices by buying cheap and selling dear.
The 3 Percent Signal
There are six components to 3Sig. We’ll briefly look them over here, so you can see where we’re going, then spend the rest of the book becoming better acquainted with them, why they work, and most important, how amazingly they work. The six components are:
- the growth vehicle where we keep most of our capital during our working years;
- the safety vehicle where we keep a smaller portion of our capital;
- the target allocation of capital between the growth and safety vehicles;
- the safety vehicle allocation at which a rebalance back to its target is triggered;
- the timing of our growth signal; and
- the growth target.
There’s flexibility in how these parts are defined. For example, the growth vehicle could be a large-company stock fund, a specialty stock fund such as one that focuses on technology companies, or a screened stock fund that invests in bargain-priced stocks. The safety vehicle could be a money market fund, a bond fund, or something else that doesn’t fluctuate much. As for allocation, we could put half in growth and half in safety, or move the slider in either direction for more growth or more safety. A 20/80 division between growth and safety would be quite safe but our money wouldn’t grow much, while money in an 80/20 division would grow a lot but also fluctuate widely along the way. In the timing component, we could specify how often we adjust the stock fund to its growth target: monthly, quarterly, annually, or at some other pace. Our growth target could be anything we want, such as 2 percent per month, 4 percent per quarter, or 11 percent per year.
We’ll explore different permutations of these components later in the book, but there’s a default, evergreen combination that I call the base case of the plan. It works for anybody during most of his working years, and it’s what I mean when referring to 3Sig. In the base case of the plan, the components are:
- a small-company stock fund as the growth vehicle;
- a bond fund as the safety vehicle;
- an 80/20 target allocation between the stock and bond funds;
- a 30 percent bond allocation threshold that triggers rebalancing back to 80/20;
- a quarterly timing schedule; and
- a 3 percent growth target.
At the end of each quarter, you’ll look at your stock fund balance. If it grew 3 percent, you’ll do nothing. If it grew more than 3 percent, you’ll sell the extra profit and put the proceeds into your bond fund. If it grew less than 3 percent or lost money, you’ll use proceeds from your bond fund to buy your stock fund up to the balance it would have attained if it had grown 3 percent in the quarter. In this manner, you will mechanically extract profit from price fluctuation.
Imagine the 3 percent signal line rising up and to the right on a price chart. At the end of each quarter, your stock fund balance will be either above or below the signal line. You could shade in the distance between the two, in dark gray for a profit surplus above the signal line, in light gray for a profit shortfall below it. The quarterly procedure sells the surplus or buys the shortfall to bring your stock balance perfectly back to the signal line. It looks like this:
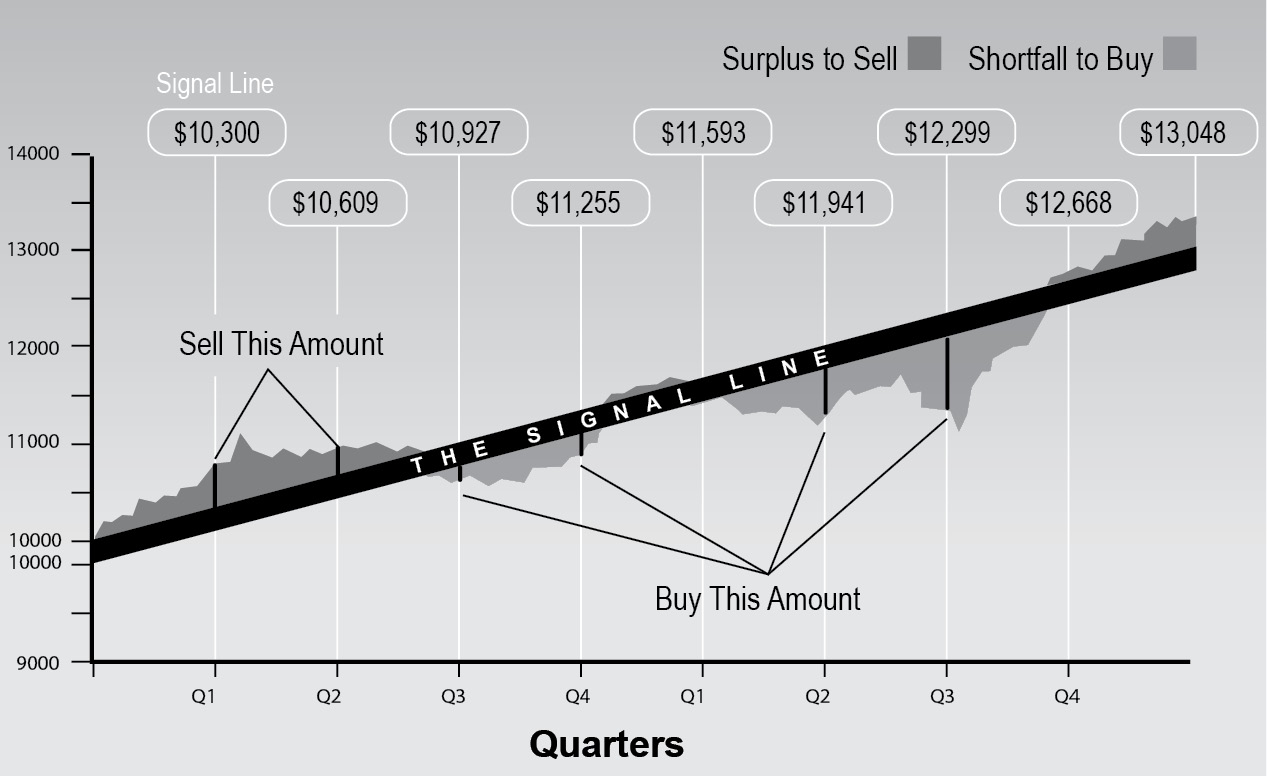
Selling surpluses and buying shortfalls along the 3 percent signal line.
This simple system beats the stock market by stripping out noise. You will not need (or want) anybody’s opinion on where stocks are going, not even your own. The plan reacts to what did happen rather than trying to predict what might happen, and all it needs in order to do so are quarterly closing prices. Hard numbers, not prognostications, fuel this approach. It will help you achieve a return better than that from the supposed experts, without listening to anything they say, as you lock in the 3 percent growth rate with little work and almost no stress. This plan is going to automate an important part of your financial life to help you get back to living.
In the rest of the book, we’ll look at 3Sig’s components and add two addendums that boost its performance: a “stick around” rule that keeps you fully invested in stocks for recovery after a crash, and the use of a “bottom-buying” account to fund buy signals during big sell-offs.
To run 3Sig, you’ll need just two cheap index funds, one for small-company stocks and one for bonds. This means you can run the plan anywhere you keep your investments, such as a 401(k), an IRA, or a regular brokerage account. A retirement account is the best place to run 3Sig because it enables you to follow sell signals without worrying about taxes on profits. We’ll cover this more fully in Chapter 6. Converting your retirement and other financial goals to 3Sig will remove market nervousness from your life, lower the expenses you pay, and substantially boost your investment performance. It works so well and so painlessly, you’re going to wonder how you ever made it this far without it.
Say good-bye to z-val distractions and the anxiety of indecision that haunts most investment approaches, and hello to rational calculations that take out all the guesswork on the mere four days per year you’ll bother to check in. This is how the real smart money invests, and you’re about to join it.
Volatility Is Opportunity
Flat lines are not conducive to profit. We need highs and lows. Our job as investors is to recognize the inevitable oscillation between highs and lows as the natural tide of the market. The media churn this movement into emotional stories of thrill and agony, but when we filter them out and simply understand that low prices are to be bought and high prices are to be sold, volatility becomes our friend.
Unfortunately, we’re not naturally good at tuning out noise. We’re even worse at tuning out friends and family who are tuned into noise and eager to share what they’ve heard. The financial media know how to make a convincing case using believable experts and compelling evidence. The latter is often couched in terms of some market measurement being at what the media claim to be some historically significant level. For instance, you might read that volume on the New York Stock Exchange topped a certain number of shares for the first time in eighteen months. You’re left to believe that an important conclusion should be drawn from this information, but you’ll have to draw it yourself. Combine this with an occasion where stock prices went way up or way down, and you’re emotionally vulnerable to running off in a random direction. Egging you on will be experts recycling well-worn catchphrases such as “due for a rest” or “priced for perfection” on the bearish side, and “room to run” or “the bad news is baked in” on the bullish side.
All you really need to know is that stock price movement is yours for the using. It does not matter why prices are up, just that they are. It does not matter why prices are down, just that they are. Their being up or down does not influence in any way the odds of their being higher or lower in the future. You can only know what happened, not what might happen. Anything could happen, so why bother guessing? Leave that to the experts.
The more an investment fluctuates, the more opportunity it provides for profit, but at a higher level of stress. Low fluctuation is easy to accept emotionally, but is not very profitable. High fluctuation is hard to accept emotionally, but can be very profitable. Most planners will suggest that a balance needs to be struck by combining low-volatility assets with high-volatility, arguing that the stability of the former will provide us with confidence to stay invested for the strong performance of the latter.
I propose a different approach. Rather than relying solely on the comfort of low-volatility assets to stay the high-volatility course, why not also add an automated mechanism for putting volatility to work? Doing so makes price changes interesting and fun, not emotionally devastating, as we merrily run the automation of buying lows and selling highs. We become comfortable with the process, not fearful of losses and greedy for gains.
This comfort and the effectiveness of the automation enable us to focus the bulk of our money on a more volatile segment of the stock market for better performance in the long run. Few planners advise such a route because the higher volatility shakes most people from the plan. This is because most plans include no mechanism for signaling lows to be bought and highs to be sold. Mine does, so the automated handling of higher volatility makes it much easier to stick with the plan through ups and downs. This pays off with better performance over time for two reasons. First, because volatile parts of the market rise more than tamer parts after all is said and done; and second, because the automated buying of lows and selling of highs magnifies this already stronger performance.
We’ll get to which volatile part of the market we’re going to use. For now, just understand that volatility provides opportunity when it’s used properly. It’s not to be feared. In an investment that can’t go bankrupt, falling prices are just an opportunity to deploy money for profit later. This might seem self-evident, but it’s lost in the daily to-and-fro of market prognostication. By the time you’re done with this book, you’ll focus entirely on the prices that market volatility already delivered to you, not at all on the ones it might deliver in the future. You’ll come to trust that the same automation that got you this far will take you farther still, and you’ll stop worrying about where the market is heading. Wherever it goes, your automation will react appropriately.
Volatility is opportunity, and you’re going to put it to work.
Retreat to the Index
Looking at the evidence in the last chapter and the shelves of research backing it up, many investors give up on timing the market and retreat to index funds. Even the great investor Warren Buffett, who amassed one of the world’s largest fortunes by owning shares of companies that he believed to be undervalued, said at a press conference after his company’s annual shareholder meeting in May 2007 that most investors would do better owning low-cost index funds rather than entrusting their money to managers or picking stocks on their own. “A very low-cost index is going to beat a majority of the amateur-managed money or professionally managed money,” he said. He believed he could continue beating the S&P 500, but would be amazed if it were by more than “a couple of percentage points.” Coming from one of the all-time best stock pickers, these observations are noteworthy. In recent years, Buffett has not outpaced the S&P 500, and he gave explicit instructions for money he’s bequeathing in a trust for his wife: put 10 percent in short-term government bonds and 90 percent in a very low-cost S&P 500 index fund.
An index mutual fund or exchange-traded fund (ETF) owns the market without exercising any judgment whatsoever. It doesn’t try to guess ups and downs, doesn’t care what’s happening in the economy, is indifferent to exciting new product launches, and so forth. In the case of the S&P 500, an index fund owns all five hundred of the large-company stocks on the list maintained by Standard & Poor’s. In the case of the Russell 2000, an index fund owns all two thousand of the small-company stocks on the list. The stocks in an index are called its “components.” Most index funds own all the components in the same percentage weighting as the index itself. These indexes, especially the big ones such as the Dow Jones Industrial Average and the S&P 500, are called “the market.” When we own index funds, we put our money into the market itself, with no attempt to select which stocks are going to do better than the aggregate.
This works because it’s cheap and it outperforms the majority of professional managers, who fall victim to all the human shortcomings you read about in the last chapter. In any given year, about two-thirds of the “pros” do worse than they would have done if they’d just bought an index fund on the first trading day in January and spent the rest of the year fishing.
Index investing, not Peter Perfect or the z-vals, is our real rival. If we can’t devise a plan that beats the S&P 500 over time, then we should give up and own the index itself. The S&P 500 will be our benchmark in this book, and we’ll soundly beat it. In so doing, we’ll utterly trounce the legions of z-val money managers.
Nudging the Coin Toss Line
In the last chapter, we looked at a chart I created by tossing a coin fifty times and adjusting a $10,000 balance higher by 5 percent on heads and lower by 5 percent on tails. We found that it produced performance streaks that don’t appear random, and that the resulting chart looked like charts from the stock market. To refresh your memory, here’s the sequence of toss results and the chart it produced:
HHH tt H t HH t H ttt H ttttt HH ttt HH t H t HH t H t H ttt HHHHHH t H t HH
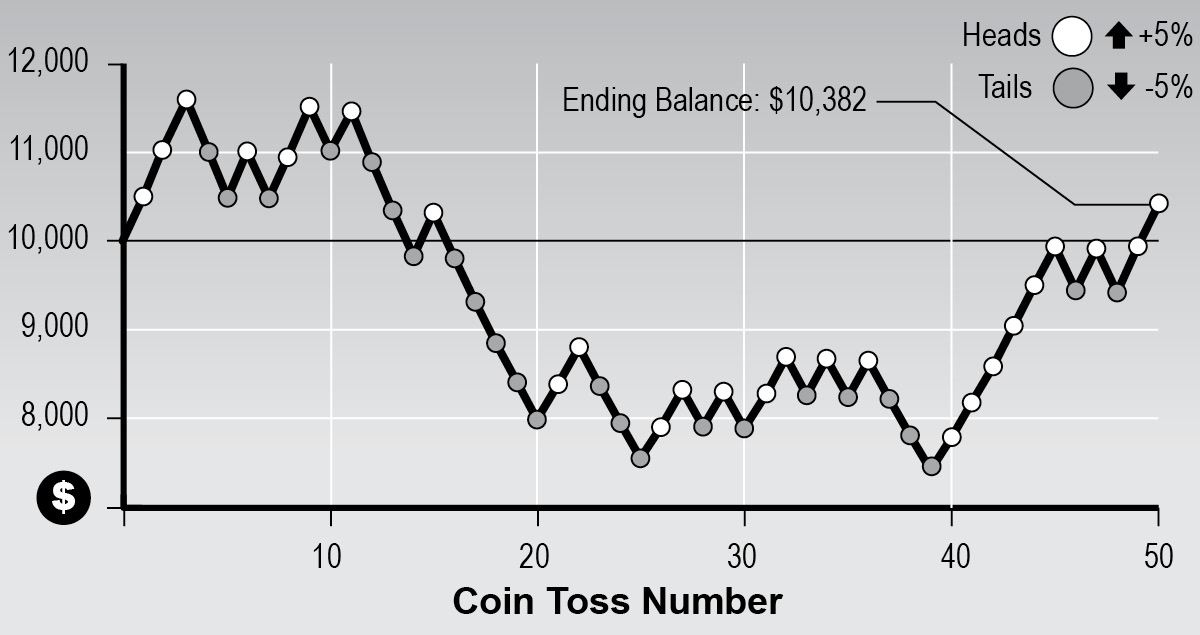
Change in $10,000 balance by coin toss.
To make the example more realistic, let’s add a second layer of randomness. On top of the same sequence of heads and tails tossed previously, I tossed the coin another fifty times. Heads meant a 6 percent change in account balance, either up or down depending on the first toss, while tails meant only a 4 percent change. Here’s the second sequence of toss results:
t H t HHH tt H t HH tttttt H tt HH tt H t HH t H t H t H t HH ttttt H t H tt H t
The first toss was heads in the first sequence, indicating positive change, and tails in the second sequence, indicating 4 percent. The $10,000 balance grew 4 percent, to $10,400. The second toss was heads in the first sequence, again indicating positive change, and heads in the second sequence, indicating 6 percent. The $10,400 balance grew 6 percent, to $11,024. Here’s how this process played out over fifty rounds:

Change in $10,000 balance by double coin toss.
The pattern is very close to the one we generated before with constant 5 percent moves. The numbers are slightly different, but the pattern is almost the same. Our second layer of randomness did little to change the outcome of the first. The reason for this is that the second layer couldn’t alter the direction of the chart line in each round, just the size of the move. In the first example, the chart always moved 5 percent. In the second, it moved either 4 or 6 percent, thus either a little less or a little more. That 4 and 6 average out to 5 added to the similar outcome over time, since each was equally likely.
However, larger numbers and numbers farther apart can significantly alter the outcome by forcing the same pattern over wider territory. Here’s a chart of the same coin toss sequences as those just given, but with heads in the second sequence producing a 30 percent move and tails producing a 10 percent move:

Change in $10,000 balance by double coin toss with larger moves.
This big change happened by just growing the moves. The first example, with every change at 5 percent, left us with $10,382. The second example, with heads at 6 percent and tails at 4 percent, left us with $9,989. This third example, with heads at 30 percent and tails at 10 percent, left us with $3,184.
In these examples, we achieved different outcomes on the same random pattern of ups and downs by changing the size of the moves, but it could also have happened by our changing the amount of money riding the moves. Investing more at bottoms and less at tops would nudge our performance upward even as the market followed a random path. We’ll explore this in more detail next.
Reactive Rebalancing
If we believe the evidence in Chapter 1, then aren’t we being hypocritical in attempting to invest more at bottoms and less at tops? If we can’t know when the market has bottomed and when it has topped, how can we know when to add more money and when to sell profits?
We can’t know bottoms and tops exactly, but we can know the direction the market has gone and react appropriately. This requires no prediction. Instead of guessing forward, we react backward. We determine our actions by what already happened instead of what may or may not happen. When prices rise and we find ourselves with excess profit, we sell. When prices fall and we find ourselves surrounded by bargains, we buy. I call this “reactive rebalancing,” to describe reacting to where the market went by rebalancing more of our capital into and out of the stock market as appropriate—no crystal balls required. The more common attempt to profit from stocks involves predictive rebalancing, which is moving money to where a z-val’s coin toss says it will grow in the future.
Consider the coin toss pattern we’ve looked at. In the first example, we moved 5 percent at every inflection point, up and down. In the second, we moved either 4 percent or 6 percent. In the third, 30 percent or 10 percent. We assigned the movement size randomly in the second and third examples. What would happen if, instead of reacting randomly to market moves, we reacted deliberately based on what transpired? Let’s find out.
In this next example, we’ll move the market randomly by the same pattern we’ve been using, but we’ll react to it by selling after it moves higher and buying after it moves lower. We’ll use the same constant 5 percent market moves from our first example, so all rises and drops will be by 5 percent. We’ll begin with an 80/20 division of our $10,000 between stocks and cash, so $8,000 in stocks and $2,000 in cash. When the market rises, we’ll sell 5 percent of our stock position. When the market falls, we’ll use our cash balance to buy a 5 percent increase in our stock position. For example, if after a market drop of 5 percent our stock position is worth $5,000, we’ll move $250 into it, which is 5 percent of $5,000. Here’s the result of this plan over the same fifty coin tosses we’ve been following, compared with the base movement of the coin tosses themselves:

Change in $10,000 balance by coin toss vs. reactive buys and sells.
How about that? These mechanical reactions improved our performance over the performance of the coin toss market. In the first up sequence, the bold reactive line slightly underperformed because we sold the strength and therefore had less riding on stocks to benefit from the further move higher. We muted the updraft. This continued for several cycles, but even our underperformance wasn’t intolerable. We were behind in that part of the journey, but not by much. The worm turned when the coin entered its tttHtttttHHttt phase, and both the market and our balance fell steadily toward the $8,000 level on all those tail tosses. Suddenly, our plan’s tactic of muting the moves came in handy. It previously prevented us from getting as high as the market’s peaks, but in this extended downdraft it put the brakes on our losses as the market fell freely on each tail toss. As a result, we fell less and were able to keep a performance margin over the market for the remainder of the fifty tosses.
The prognosticators of the real stock market would complicate this simple example and create the confusions that so vex us. Instead of reading about the random results of coin tosses, you would read and hear opinions from professional guessers who’ve spent years of their lives in the z-val environment of stocks. Thus your journey along the random market sequence would generate discussions of a “range-bound” market along the $11,000 line in the beginning. You’d hear about the bulls and the bears battling it out for control. In the tttHtttttHHttt phase, you’d hear from bears about the gathering momentum to the downside. You’d read about the unemployment rate, rising tensions in the Middle East, an overheating property market in some faraway country, the “unprecedented” decisions of the Federal Reserve or its “lack of imagination,” how the president is ruining the country, the fecklessness of Congress, industrial production this month as compared with last month, dangers that are “on the radar” but not yet realized, inflation being too high or too low or on its way to one or the other, and what the price of gold says about interest rates. You would be led to believe that all this was vitally important and that wherever the market went next, it was obvious from the combination of these factors that it would do so. Come on, smart money, didn’t you know that?
Then, to make forecasters look as silly as we know them to be, the market often goes sideways, as it did between coin tosses nineteen and forty-one in our example, when it fluctuated between $8,000 and $9,000. These are always the most humorous environments to watch in the media, because after the market proves everybody wrong by going neither up nor down, both sides come out in force to explain why the market is “coiling” for its next move in their pet direction. The permabulls say it’s basing before going higher; the permabears say it’s topping out before falling lower. It eventually breaks one way or the other, and one side or the other claims victory in that round of the coin toss contest.
We, on the other hand, beat the majority of pros and the market itself by automating our reactions to where prices actually went, and could have spent all fifty rounds of this scenario blithely disregarding the chatterboxes in favor of living our lives. At the end of the fifty rounds, we and our reactive rebalancing ended up with $10,661, the market ended up with $10,382, and the majority of pros would have ended with balances between the $9,989 of our second example (when heads produced a 6 percent move and tails a 4 percent) and the $3,184 of our third example (when heads produced a 30 percent move and tails a 10 percent).
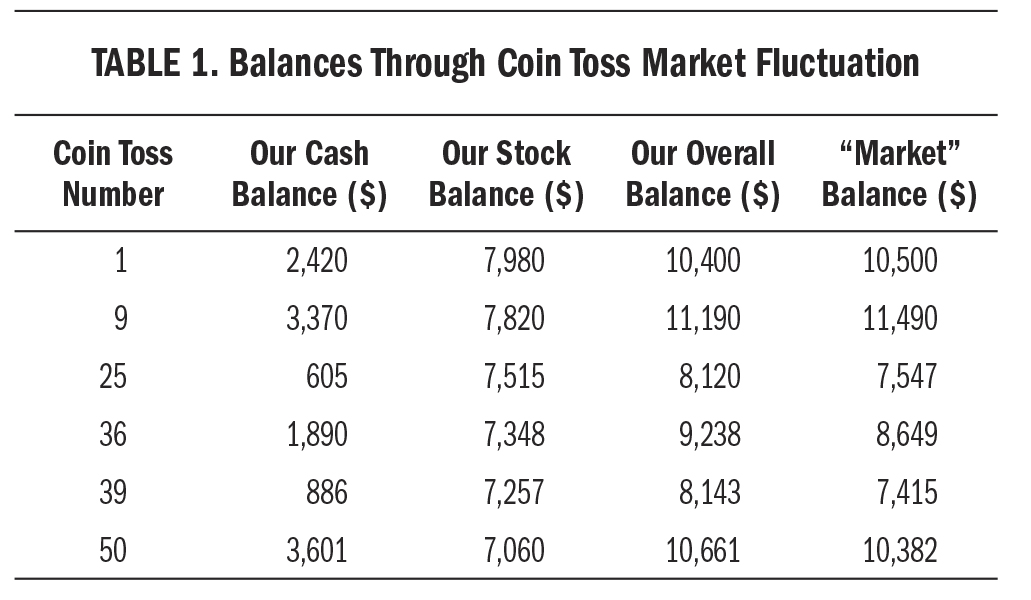
On top of this, notice that we achieved this superior performance with a good chunk of our capital in the safety of cash. You read at the beginning of this chapter that 3Sig keeps a safe-fund target allocation of 20 percent. That’s a key point that we’re mimicking in this example. We began with 20 percent of our capital in cash, and the amount fluctuated later as we bought and sold, but we were never all in. Peruse the following table of key points in our journey, marked by the coin toss number in the left column and then balances after the action caused by it:

Visit (http://bit.ly/1AZPb0i) for a larger version of this table.
See the dynamic at work? As the market fell, our automated plan steadily moved more of its cash into stocks at lower prices. When the market recovered, our plan steadily moved that money back out of stocks at higher prices. You can see the fluctuation between the cash fund and the stock fund. The cash balance fell with the market as more of it went into stocks to maintain a fairly stable balance in the $7,000 area. When the market recovered, stock profits went back into cash, so that fund’s balance swelled again.
In this construct, we get ahead of the market when it falls because we fall less. If the market hits a string of heads and rises relentlessly over a long period, it could pull ahead of us because we’d be selling along the way and benefiting less from further rises. Remember, though, that the market fluctuates. Over time, the gradual tipping of the scales in our favor will nudge our performance line higher. That’s all we want.
This example is simplistic because the actual stock market doesn’t move in clean 5 percent increments, and setting a firm buy/sell allocation at 5 percent of our portfolio isn’t the best technique. Later, we’ll use real market data to develop a more elegant reaction to fluctuation. We’ll also keep our safe allocation in bonds, not cash, thereby boosting performance even more while retaining much of the safety of cash. The purpose of these coin toss examples is to establish that intelligent reaction to random moves can provide a performance edge.
On this concept, we’ll build a reliable system. We’ll stop asking, “What will the market do?” and start asking, “What did the market do?” and then, “What should I do in response?” It’s the beginning of investing wisdom, our first step away from the rabble and toward a method of making market fluctuation work for us rather than against us.
Executive Summary of This Chapter
The stock market moves at its own pace in an up, sideways, or down direction. The resulting price changes can be used to our advantage after they’ve happened, no prediction required. Automating the process of buying low and selling high makes market volatility a tool to be used, not a condition to be feared. Key takeaways:
 The 3Sig approach rebalances a stock fund back to its growth target each quarter by selling surpluses or buying shortfalls using money from a safe fund.
- Volatility is opportunity. We need to recognize that the oscillation between highs and lows is the natural tide of the market. It matters only that prices are where they are, not why they got there. Nobody knows why.
- As long as an investment won’t go bankrupt, more price volatility will enable an automated system of buying low and selling high to produce more profit. This is why a volatile index, which can’t go bankrupt, is our primary investment in 3Sig.
- Indexing beats the majority of investors, so our goal is to beat indexing. We will do so swimmingly, thereby utterly trouncing money managers.
- A randomly generated price line can be nudged by changing only the size of its moves; there’s no need to change or predict its direction. The impact of moves on our balance can be changed by altering the amount of money riding the moves.
- Mechanically buying lows and selling highs adjusts the amount of money riding a price line in a helpful way, shifting performance higher than that achieved by the raw price line. This requires no forecasting, just reactive rebalancing.