Young Entrepreneurs, Younger Firms
New technologies have created a new class of wealth, most of it controlled by young men (and a few women). Thirty-two-year-old Leo Chen of China is the youngest self-made billionaire in the developing world. Bobby Murphy and Evan Spiegel, the creators of Snapchat, became billionaires at 24. Facebook cofounders Mark Zuckerberg and Dustin Moskovitz became billionaires well before 30. Forty-five percent of billionaires under 40 made their fortunes in new technology (82 percent if inherited wealth is excluded).
Except in new technologies, where the superrich from all countries tend to be young, emerging-market billionaires are significantly younger than their advanced-country counterparts, and their firms are newer. More than half of emerging-market billionaires are under 60, compared with less than one-third of advanced-country billionaires.
The sources of their wealth are also young. The average firm of a billionaire from the South was created in 1986, compared with 1967 for his counterpart in the North. Emerging-market billionaires are in the prime of their lives, running relatively new businesses.
Studies of the psychology of extreme wealth find that its creators are often people who are able to spot revolutionary change and act on it. Times of transformation are times when fortunes can be made or lost. Chrystia Freeland writes about this mentality in Plutocrats: The Rise of the New Global Super-Rich and the Fall of Everyone Else. Billionaires born in emerging markets, such as George Soros, Aditya Mittal, and Yuri Milner, show a unique ability to spot transformation and make immediate and large investments. As Freeland puts it, “Responding to revolution is how you become a Plutocrat” (2012, 162). These people are willing to take huge risks, risks extraordinary enough to make billions but risks that sometimes end very badly. (The riches of Lai Changxing and Mikhail Khodorkovsky landed both men in jail.) This leads to high volatility at the top in some countries and, as more than one commentator on the rich has remarked, to extreme paranoia among the rich who survive.
The opportunities created by seismic economic shifts are part of the reason why industrialization and modernization tend to coincide with the emergence of a new class of mega-rich. Structural transformation creates change and opportunity that enables fortunes to be built quickly. To the extent that wealth creation is a natural phenomenon that accompanies change, the billionaires of the developing world may look much more like the young billionaires of advanced countries who mastered new technologies than older billionaires who got rich producing traditional goods. Like the structural transformation in emerging markets, new technologies have created extraordinary opportunities for building companies for those rare individuals who can see the direction of change and have the talent to act on it.
The divergence between North and South in the age of firms associated with large fortunes is relatively new. In 2001 the age of the median firm was similar: 45 in the North and 42 in the South. By 2014 billionaires’ firms had aged in the North, with an average age of 47. In contrast, the median firm in the South was just 28 years old, similar to the age of the median new sector firm in the North (31).
This chapter uses founding dates of companies associated with billionaire wealth to assess the decay of old fortunes and the growth of new fortunes among the superrich. It documents the extent of creative destruction, the process by which more productive firms replace less productive firms.
Emerging-Market Billionaires Are Young
Emerging-market billionaires, particularly self-made, are younger than their advanced-country counterparts (figure 8.1).
In emerging markets, billionaires under 50 outnumber billionaires over 70. The distribution of self-made billionaires is skewed toward younger billionaires, whereas inherited wealth is more evenly distributed around the mean. In contrast, more than one-third of high-income-country billionaires are 70 years or older, with just 12 percent under 50. In advanced countries the distributions of self-made and inherited billionaires by age are nearly identical.
Figure 8.1 Distribution of billionaires in advanced countries and emerging economies, by age and source of wealth, 2014

Note: This graph shows the distribution of billionaires at each age, using a smoothed histogram to connect the observations.
Source: Data from Forbes, The World’s Billionaires.
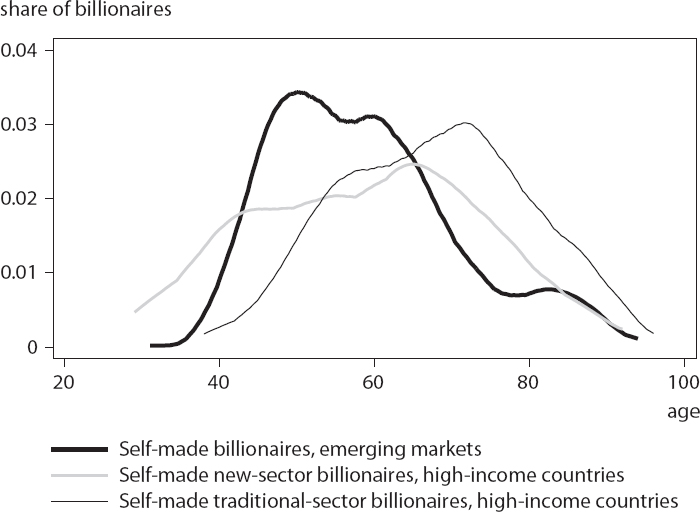
Emerging-market billionaires are responding to new opportunities in their economies. They therefore tend to be younger than entrepreneurs from high-income countries. Advanced-country billionaires in new sectors are also responding to rapid technological change and therefore may be more similar to self-made billionaires in emerging markets than self-made billionaires in more traditional sectors (both traded and nontraded sectors). Indeed, new-technology billionaires have a wider distribution across ages and they overlap more with emerging-market billionaires than other high-income billionaires (figure 8.2).
Figure 8.2 Distribution of self-made billionaires in advanced countries and emerging economies, by age and industry, 2014

Note: This graph shows the distribution of billionaires at each age, using a smoothed histogram to connect the observations.
Source: Author’s research using data from Forbes, The World’s Billionaires.
Emerging-Market Companies Are Young
Emerging-market billionaires are younger than their advanced-country counterparts, even new-technology billionaires. However, age only approximates the time it takes to build a fortune and does not offer information about inherited wealth. This section therefore looks at the age of fortunes by company founding date.
Of the five oldest companies associated with individuals on the Forbes billionaires list in 2014, three fortunes stem from European nobility. The oldest is that of the von Thurn und Taxis family, who operated the German postal system beginning in 1615.1 The Canada-based Hudson’s Bay Company, which began as a fur trading group, is more than 300 years old. China’s largest soy sauce producer, the Foshan Haitian Flavouring Company, was founded in the 1700s. Very few fortunes last this long; only 7 percent of companies associated with wealth in 2014 were founded before 1900, down from 13 percent in 2001.
Companies are becoming younger, particularly in emerging markets. Some of the youngest companies on the 2001 billionaires list in high-income economies—including Yahoo! (founded in 1994), Amazon (1994), and eBay (1995)—are today’s technology giants. In 2014 the youngest companies in high-income countries were also technology companies, including Groupon (founded in 2008), WhatsApp (2009), and Zulily (2010). In emerging markets the four youngest companies in 2001 were all Russian oil or gas companies, riding the wave of privatization in the country; all of them were at least eight years old. By 2014 the youngest firms were half that age, with Chinese mobile phone company Xiaomi Tech making its founder, Lei Jun, a billionaire only four years after he founded the company, in 2010.
The founding dates of companies offer more precise information about the life cycle of fortunes than the age of billionaires. An average founding year in 2001 that is similar to the average founding year in 2014 is consistent with the idea that the same fortunes remain intact (though the names of owners may change), because of either bequests or investment. A later founding date is consistent with wealth turnover among the superrich and creative destruction among firms.
The average business associated with billionaires was 50 years old in 2014, younger than in 2001, when the average firm was 55 (table 8.1). The median company was also younger in 2014 (41) than in 2001 (43).2 This could be because of an abundance of young new companies, with the biggest companies and hence the richest individuals remaining the same over time. But stagnancy at the top is not the case: Even among the top 150 billionaires the companies associated with the biggest fortunes were roughly the same age in 2001 and 2014, indicating that new companies moved into the top 150 richest between 2001 and 2014. If the same companies created the biggest fortunes in both years, the companies would have aged by 13 years over the period.
Table 8.1 Average founding date of billionaire-related companies in advanced countries and emerging economies, 2001 and 2014

Source: Author’s research based on data from Forbes, The World’s Billionaires.
In advanced countries companies tend to be older than emerging-market firms, and they were older in 2014 (average age of 58) than in 2001 (average age of 55). In contrast, emerging-market companies were 12 years younger in 2014 (average age of 40) than in 2001 (average age of 52). Companies in emerging markets associated with self-made billionaires had a median age of 35 in 2001 and 23 in 2014. In advanced countries, the median age was 29 in 2001 and 35 in 2014.
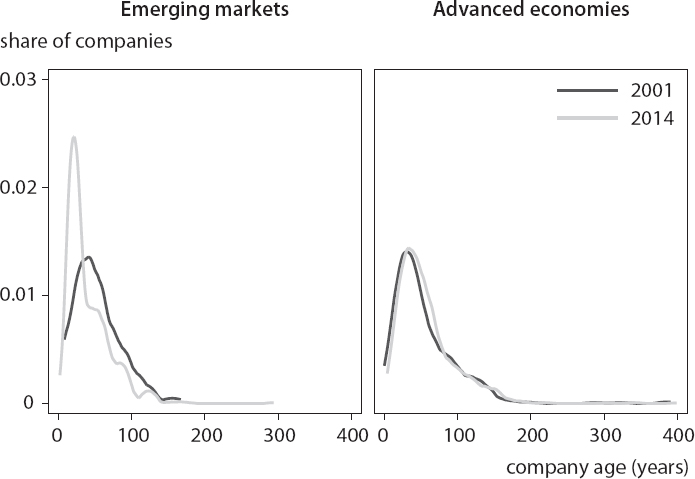
To understand the difference in distribution of founding dates across years, as well as the influence of outliers, Figure 8.3 plots the age of billionaire companies in each year. The vertical axis shows the share of companies of any given age (from the horizontal axis) in that year. Age rather than founding date is plotted to account for the 13-year gap between data. The distribution of company founding dates is indeed right-skewed, with a small share of very old companies pulling the mean company age above the highest concentration of billionaires. The distributions of company age in 2001 and 2014 are very similar in advanced countries, indicating turnover in the companies responsible for billionaire wealth. But a kind of steady-state equilibrium is evident, in which new firms displace older firms at a constant rate, keeping average age fixed. In contrast, in emerging markets there is a shift in the distribution toward younger companies in 2014, with a quarter of all emerging-market companies founded between 1990 and 1995. Excluding China and Russia reduces this concentration of young firms, but the data still show a shift toward younger firms (figure 8.4).
Figure 8.3 Age of companies associated with billionaire wealth in advanced countries and emerging economies, 2001 and 2014

Note: This graph shows the distribution of companies at each age, using a smoothed histogram to connect the observations.
Sources: Author’s research using data from Forbes, The World’s Billionaires.
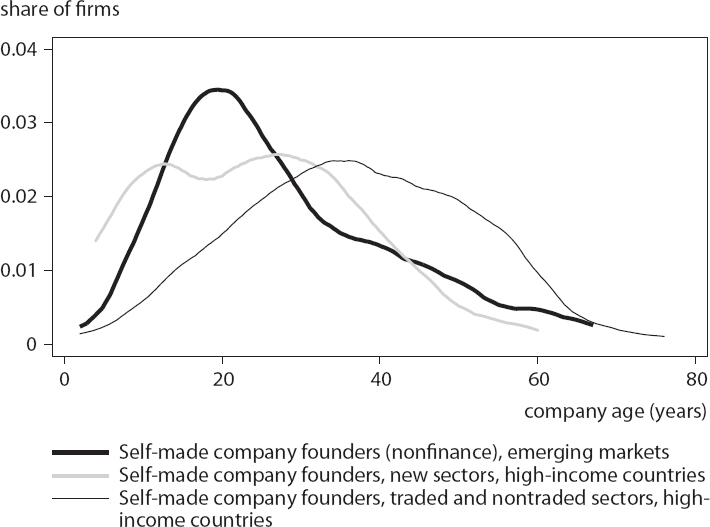
Using founding dates is useful for comparing today’s emerging-market entrepreneurs with different types of entrepreneurs in advanced countries. In 2014 the distribution of founding dates of emerging-market companies in new, traded, and nontraded sectors tracked the distribution of new-sector billionaires in advanced countries, with a peak at about 20 years. In contrast, most billionaire-related companies in traded and nontraded sectors in advanced countries are at least 30 years old (figure 8.5). New-sector firms in advanced countries thus look more like emerging-market firms than other advanced-country firms.
Figure 8.4 Age of companies associated with billionaire wealth in emerging economies, excluding China and Russia, 2001 and 2014

Note: This graph shows the distribution of companies at each age, using a smoothed histogram to connect the observations.
Source: Author’s research using data from Forbes, The World’s Billionaires.
The results are in line with work by Nicolas Véron (2008), who finds that among the top 500 largest companies, emerging-market companies tend to be younger than advanced-country firms. He interprets this finding as reflecting a catch-up growth process. The results above also show that large-scale entrepreneurship is a much more recent phenomenon in emerging markets.
Transition: Get Richer or Get Out
Table 8.2 shows transition matrices for billionaires from the North and the South. Quintile 1 is the bottom 20 percent of billionaires; quintile 5 is the top 20 percent. The matrix shows where the billionaires who were in each quintile in 2001 ended up in 2014.
Figure 8.5 Age of companies associated with billionaire founders in advanced countries and emerging economies, by type of sector, 2014

Note: This graph shows the distribution of companies at each age, using a smoothed histogram to connect the observations.
Source: Author’s research using data from Forbes, The World’s Billionaires.
The data show a very strong up-or-out phenomenon, especially in the South. No matter where billionaires start in 2001, if they remain on the list, they are much more likely to move up than to stay in the same cohort. Nearly 80 percent of billionaires from emerging markets who started in the bottom quintile in 2001 moved up to the top quintile or exited by 2014, compared with less than 60 percent from advanced countries. Not a single emerging-market billionaire who was on the list and in the bottom quintile in 2001 remained there in 2014 (upper-left entry); all either exited or moved up the distribution.
Thus, changes in the emerging-market billionaires list from 2001 to 2014 reveal tremendous movement. Only 60 percent of the fortunes survived. Of the fortunes in the bottom 20 percent of the distribution in 2001, only half survived. Those that did, however, were twice as likely to move up to the top quintile as they were to remain in the bottom one.
Table 8.2 Movement of billionaires across quintiles in advanced countries and emerging economies, 2001–14

Source: Author’s calculations using data from Forbes, The World’s Billionaires.
Creative Destruction: Changes in the Billionaires List between 2001 and 2014
All of the evidence points to more dynamism in the South than in the North. A stability index, which gives a sense of how much turnover there is among top businesses or entrepreneurs, can also be used to determine whether this dynamism is present among the largest firms. Kathy Fogel, Randall Morck, and Bernard Young (2008), for example, examine stability in the top 10 businesses in 1978 and 1998 in a sample of 44 countries. They find that greater turnover among the top businesses in a country is associated with faster economic growth, which they interpret as evidence of creative destruction. Countries perform better when the business sector is more dynamic, with new businesses growing large and replacing aging national champions.
Stability is measured by the share of the top 3, 5, or 10 billionaires on the list in 2014 that was in the same group in 2009. For the stability index, 2009 is used as the benchmark year because the billionaire group needs to be large enough in each year that the top 3, 5, or 10 exist. To be on the top 3 list, a country must have had at least 3 billionaires five years ago in order for the stability indicator to be measured. Similarly for top 5 and 10. There are thus more countries when stability is measured by the top 3 than by the top 5. There were too few billionaires in 2001 to calculate a stability index for most emerging-market countries. Low stability implies that new fortunes are coming on board often.
Table 8.3 Five-year stability index for top 3, top 5, and top 10 billionaires, by country, 2009–14

Note: Stability is measured as the share of the top 3, 5, and 10 billionaires on the list in 2014 who were also in the top 3, 5, and 10 places in 2009.
Source: Author’s calculations using data from Forbes, The World’s Billionaires.
Table 8.3 shows stability rates by country. The data show much more dynamism in the South, where 47 to 57 percent on average of billionaires at the top remain unchanged. In contrast, the average in the North is 57 to 67 percent.
Among emerging economies, China and India show very different pictures. Despite similar population sizes, China is at the top of the list, indicating tremendous dynamism, while India is near or at the bottom. Both China and India have a handful of new-sector billionaires at the top, but India also has oil and steel fortunes, which are absent in China. Instead, China has billionaires who made their money in tradable goods, such as cars, appliances, and beverages. Of the top 10 billionaires in China, only 2 inherited their wealth, compared with half in India.
Takeaways
Five patterns emerge from this examination of changes in billionaire wealth. First, emerging-market billionaires tend to be younger than their advanced-country counterparts. Second, a wave of new businesses appeared in the early 1990s in the South, generating this pattern. A similar pattern exists for the new sectors in the North. Third, there is an up-or-out phenomenon among billionaires, especially in emerging markets: Fortunes grow rapidly or fall off the list. Fourth, there is more dynamism in the South than in the North. Finally, fortunes are not aging significantly in either the North or the South, indicating there is a lot of wealth creation as well as a lot of wealth destruction.
1. The other two companies associated with European nobility are Britain’s Grosvenor Group (1677), associated with the Duke of Westminster, and Cadogan Estates (1712), associated with the Earls Cadogan.
2. In this section information on the main company associated with each fortune as well as the founding date of each primary company is added to the 2001 and 2014 billionaire lists. Each individual rather than each company is counted as an observation. Billionaires whose wealth came from the same company are therefore individual data points.