Chapter 11
Testing the Profits and Market Value
In This Chapter
![]() Getting a handle on the price/earnings ratio
Getting a handle on the price/earnings ratio
![]() Diving into dividend yield and cover
Diving into dividend yield and cover
![]() Examining return on sales
Examining return on sales
![]() Realising return on assets
Realising return on assets
![]() Taking a look at return on equity
Taking a look at return on equity
![]() Working with margins
Working with margins
Well, did the company make any money? That’s the question everyone, and we mean everyone with a financial stake in the company – executives, investors, creditors, employees – wants the answer to. Investors especially want to know whether or not the company’s shares are worth the price they would have to pay for them.
You may think the answer should be a simple ‘yes’ or ‘no’, but actually the answer always depends on many factors. How well did the company make use of its resources in order to make a profit? Was that profit high enough based on the resources the company had at hand and compared with that of similar companies? Did the company pay out a fair share of its earnings to its investors? Did it reinvest the right amount of the money in its coffers for future growth?
In this chapter, we show you how to answer these key questions with calculations that help you to test a company’s profitability and market value: price/earnings ratio (P/E), dividend yield, and return on sales (ROS), return on assets (ROA), and return on equity (ROE). We also review how to calculate the profit margins – both the operating margin and the net margin.
To help you understand the validity of these profitability tests, we compare the results of two leading retailing companies, Tesco and Marks and Spencer, and compare their results with those of the retail industry in general. (See Appendix A for these companies’ financial statements.)
The Price/Earnings Ratio
The profit term you hear discussed most often in the financial news is the price/earnings ratio, or the P/E ratio. Basically, the P/E ratio looks at the price of the shares in a company against its earnings. For example, P/E ratios of 10 means that for every £1 in company earnings per share, people are willing to pay £10 to buy a share. If the P/E is 20, that means people are willing to pay £20 per share for each £1 of company earnings.
Why are people willing to pay more per pound of earnings on some shares? Because the people who buy the more expensive shares believe that the share has greater potential for growth. This ratio is used when valuing shares and is one of the oldest measurements in the world of stock exchanges.
.jpg)
To help put the P/E ratio into perspective, check out the section ‘Using the P/E ratio to judge company market value (share price)’, later in this chapter.
Working out earnings per share
Earnings per share represent the amount of income a company earned per share on the stock market. The company calculates the earnings per share (EPS) by dividing the Profit for the Year on the Income Statement by the number of shares outstanding.
Companies often use a weighted average of the number of shares outstanding during the reporting period because the number of shares outstanding can change as a company sells new shares to outside investors or company employees. In addition, companies sometimes buy back shares from existing shareholders, reducing the number of shares available to the general public. A weighted average is calculated by totalling the number of shares available during a certain period of time and dividing that number by the number of periods included. For example, if the weighted average is based on a monthly average, the number of shares outstanding on the stock market at the end of each month is totalled and divided by 12 to find the weighted average. If the company has not published this calculation in the annual report you have to use a cruder method to find the weighted average. Simply add the number of shares at the end of 2007 to the number at the end of 2006 and divide by two.
Calculating the P/E ratio
To get the P/E ratio, divide the share price by earnings per share:
Share price/earnings per share of stock = P/E ratio

The P/E formula comes in two flavours, which vary according to how earnings per share are calculated: on historic or projected earnings.
 Historic P/E: You calculate a historic P/E by using earnings per share from the last four quarters or 12 months of earnings. This number gives you a view of a company’s earnings ratios based on accurate historical data.
Projected P/Es: The other two types of P/E ratios are calculated using analysts’ expectations, so they’re sometimes called ‘leading’ or ‘projected P/Es’.
• The current P/E ratio is calculated using earnings expected by analysts during the current year.
• A forward P/E ratio is based on analysts’ projections for the next year or years further ahead.

Practising the P/E ratio calculation
Here’s how you can calculate the P/E ratio using real-world numbers from Tesco and Marks and Spencer. To calculate the P/E ratio you first need to obtain the earnings per share (EPS) figure, which represents the Profit for the year divided by the number of shares outstanding (see the previous section ‘Working out earnings per share’). Remember that the number of shares outstanding can change as the company sells new shares to investors or buys them back from existing shareholders.
When a company reports its earnings per share, it usually shows two numbers: basic and diluted. The company calculates the basic EPS using a weighted average of all shares currently on the market. The diluted EPS takes into consideration all future obligations to sell shares. For example, this number takes into account employees who have options to buy shares in the future or bondholders who hold bonds that are convertible into shares.
To practise using the formula to calculate P/E ratios, we use numbers from Tesco’s and Marks and Spencer’s income statements. Table 11–1 shows Tesco’s basic and diluted EPS for 2007 and 2006. Table 11–2 shows the same information for Marks and Spencer.
| Net Income (Loss) | Earnings Per Share | |
|---|---|---|
| 2007 | 2006 | |
| Basic | 23.84p | 20.07p |
| Diluted | 23.54p | 19.79p |
| Net Income (Loss) | Earnings Per Share | |
|---|---|---|
| 2007 | 2006 | |
| Basic | 39.1p | 31.4 |
| Diluted | 38.5p | 31.1 |
Notice that the diluted EPS of Marks and Spencer has made more progress from 2006 to 2007 as a percentage than Tesco.
In the following examples, to calculate how the public valued the results for Tesco and Marks and Spencer at the time of writing (June 2007) using the 2007 annual report (see Appendix A), we looked up the share price online while writing this section of the book. We also use the diluted earnings per share, which more accurately represents the company’s outstanding shareholder obligations. The Tesco share price was 457.75p, and Marks and Spencer was 674.00p.
Here’s Tesco’s P/E ratio:
457.75p (share price) ÷ 23.54p (2007’s diluted EPS) = 19.4 (P/E ratio)
So Tesco investors are willing to pay 19.4p for every 1p of earnings by Tesco in 2007.
The following is Marks and Spencer’s P/E ratio:
674p (share price) ÷ 38.5p (2007’s diluted EPS) = 17.5 (P/E ratio)
Marks and Spencer investors are willing to pay 17.5p for every 1p of earnings by Marks and Spencer in 2007.
Using the P/E ratio to judge company market value (share price)
In comparing Tesco’s and Marks and Spencer’s P/E ratios, you can conclude that in June 2007, investors believed that Tesco had slightly better chances of improving its earnings performance than Marks and Spencer and, therefore, were willing to pay a higher price for a Tesco share. You must dig deeper into the numbers, the quarterly reports for the first half of 2008, and general financial press coverage to determine why investors are more bullish on Tesco than Marks and Spencer. But this one quick calculation lets you know which company investors favour. Tesco has the more consistent growth of profit performance and is, of course, a much bigger company.
How do you know what a reasonable P/E ratio is for a company? Historically, the average P/E ratio for shares falls between 12 and 20 for large companies. This ratio depends on economic conditions and the industry the company’s in. Some industries, such as technology, regularly maintain higher P/E ratios in the range of 30 to 40.
In addition to comparing two companies, you should compare the P/E calculation you did to the industry in which the companies fall. Doing so allows you to compare share price or market value, not only for the companies whose annual reports you’re analysing, but also to compare the companies you’re focusing on with others in the same business.
The P/E is a good quick ratio for picking potential investment candidates, but you shouldn’t use this ratio alone to make a buying or selling decision. After you pick your targets, read and analyse the annual reports and other information about the company before making a decision to invest.
When investors are bullish, they tend to bid up the price of shares and end up paying higher prices for shares than they may actually be worth. This price-bidding war also drives up the P/E ratio.
During the Internet and technology share bubble of the late 1990s and early 2000s, P/E ratios hit highs in the 100s and tumbled dramatically after the bubble burst. Even big names, such as Microsoft, had P/E ratios over 100 that dropped back to realistic levels when the bubble burst. In June 2007, Microsoft’s P/E was 26.9, so you can see that even a top company can from time to time be seriously overpriced by investors.
Understanding variation among ratios
You probably find varying P/E ratios for the same company because the number used for EPS can differ depending on which method for calculating EPS is chosen. The diluted EPS is the one you should generally use. This figure is based on the current number of shares on the market as well as those promised to employees for purchase in the future and those promised to creditors who may decide to convert a debt into a shareholding (if that’s part of the debt agreement). So diluted earnings gives you the most accurate picture of the actual earnings per share available on the market or committed for sale in the future.
When reporting EPS in the accounts, companies are constrained by the rules in IAS 33 and will produce figures consistent with the explanations given in this chapter. However, companies are permitted to report additional EPS figures in the notes to the accounts as long as they explain how the earnings figures have been arrived at.
When companies put out a press release, they might be tempted to use whatever EPS looks most favourable for them. Companies can choose among four basic ways to calculate EPS:
Reported EPS: Companies calculate this EPS number by using general accounting principles and report it on the financial statements. They show it in two formats: basic and diluted. Usually, the diluted EPS number is the best one to use, but sometimes it can be distorted by one-time events, such as the sale of a division or a one-time charge for discontinued operations. So you need to read the notes to the financial statements to determine whether the EPS figure needs to be adjusted for unusual events. Chapter 9 discusses the notes to the financial statements in great detail.
Pro forma EPS: You often find this EPS in a company’s press release because it makes the company look its best. In most cases, this figure excludes some of the expenses or income the company used in the official financial reports. The company adjusts these official numbers to take out income that won’t recur, such as a one-time gain on the sale of marketable securities, or expenses that won’t recur, such as the closing of a large division.
When a company mentions Pro forma EPS or statements in its press release, be sure that you compare these numbers with what the company calculates using Generally Accepted Accounting Principles (GAAP) in financial statements filed at Companies House.
Headline EPS: This EPS is the one you hear about on television and read about in the newspapers. The earnings per share numbers used could be basic EPS, diluted EPS, Pro forma EPS, or some other EPS calculated based on analysts’ projections, so you have absolutely no idea what’s behind the numbers or the P/E ratio calculated using it. It’s likely to be the most unreliable EPS, and you shouldn’t use it for your evaluation.
Cash EPS: Companies calculate this EPS by using operating cash flow (cash generated by company operations to produce and sell its products and services). Operating cash can’t be manipulated by accounting rules as easily as net income, so some analysts believe this EPS is the purest. When you see this number, be sure it’s based on operating cash and isn’t just a fancy way of saying EBITDA (earnings before interest, taxes, depreciation, and amortisation). You can judge by calculating the cash EPS using the EBITDA reported in the financial statements and the net cash from operations reported in the statement of cash flows. Only the net cash figure gives you a true picture of cash flow.
Dividend Yield and Cover
Dividend yield looks at the amount a company pays out to investors as dividend as a percentage of the price they would have to pay for a share. Using this ratio, you can predict the actual cash return you’ll get by buying and holding a share.
Some companies pay a portion of their earnings directly to their shareholders as dividends. Growth companies, which reinvest all their profits, rarely pay out dividends, but older, mature companies usually do. Older companies that no longer need to reinvest large sums in growing their businesses pay out the highest dividends.
To determine how well investors did with their stock holding, you can calculate the dividend yield yourself.
Determining dividend yield
To find the dividend yield, divide annual dividend per share (the total amount per share paid out to investors during the year in dividends) by share price:
annual dividend per share ÷ share price = dividend yield
You can use numbers from Tesco’s 2007 annual report (see Appendix A) to practise calculating the dividend yield. The dividend payout is in the notes to the financial statements. The share price is on the company’s Web site or in the financial pages of a newspaper:
8.91p (dividends per share) ÷ 457.75p (share price) = 1.9 per cent (dividend yield).
The following are numbers from Marks and Spencer’s 2007 income statement (see Appendix A) and the Web site for the share price. You can use them to calculate dividend yield.
15.5p (dividends per share) ÷ 674p (share price) = 2.3 per cent (dividend yield).
Marks and Spencer offers investors a higher return on an investment in their shares at the current price than Tesco. Notice that it is only in the notes to the Marks and Spencer accounts that you see the actual dividend paid according to IFRS rules. In the financial review they have claimed dividend paid of 18.3p. This figure represents, probably fairly, what the company will pay in dividend out of the profits for 2007. Part of the dividend was paid during 2007 (an interim dividend) and the rest (the final dividend) will be paid in 2008 after approval by the shareholders at the AGM. In the past, the dividend shown in the accounts would include amounts not yet paid at the year end but, in 1985, the Companies Act was altered and now UK GAAP, in line with IFRS rules, insist that the amount shown in the accounts is the amount actually paid in 2007 – which of course now includes the final dividend for 2006.
Depending on the particular requirement of an investor, dividend yield could help determine which of the two shares to purchase. If, for example, an old-age pensioner needs income, then the share with the higher yield may be attractive. On the other hand, young high earners may not want dividend returns at this time because of the tax they will have to pay: they may accept a lower-yielding share in expectation of a capital gain from an increase in the value of their shareholding: In this case, the higher P/E ratio of Tesco may suggest that the market is expecting Tesco to be the faster grower.
Digging into dividend cover
Dividend cover, the number of times profits ‘cover’ the dividend. So, if profits were 100 and the dividend payment were 25 then dividend cover would be 4 times. Dividend cover helps an investor to answer two questions:
What proportion of its earnings is a company paying out as opposed to retaining in the business to fund growth?
How likely is the company to be able to maintain its dividend strategy in the future?
To find the dividend cover, divide earnings per share by dividend per share (the total amount per share paid out to investors during the year in dividends):
earnings per share ÷ annual dividend per share = dividend cover
You can use the EPS figure from Tesco’s 2007 income statement (see Appendix A) to practise calculating the dividend payout ratio:
23.54 (diluted EPS) ÷ 8.91p (dividends per share) = 2.64 (dividend cover).
The following are numbers from Marks and Spencer’s 2007 income statement (see Appendix A). You can use them to calculate dividend yield.
38.5p (diluted EPS) ÷ 15.5p (dividend per share) = 2.48 (dividend cover).
Both Tesco and Marks and Spencer have a very reasonable level of dividend cover. There would have to be a dramatic fall in profits in the future for the companies to have to reduce or pass their dividend payments.
Lower dividend cover means that a company is paying out a larger proportion of its earnings to its shareholders. Should the amount a company pays out in dividends, compared to how much of its earnings it keeps back to fund growth, make a difference to you? In the past, investors expected dividend payouts. In fact, dividends made up as much as 40 per cent of most investors’ portfolio returns about 20 years ago. But investors’ priorities have changed in the past 20 years. Today, investors look toward capital gains – the profits investors make when selling shares for more than they paid for them – for portfolio growth.
You should definitely check how a company’s dividend strategy compares with that of similar companies. If dividend cover is considerably higher than that of other similar companies, be sure you understand what the company does with the money and whether the company is making good use of the funds it’s reinvesting. If the company pays out a significantly larger portion of earnings to investors than most other companies in the industry, the company may not have any good ideas for growth and is therefore just milking the cash cow, which may eventually run dry. If dividend cover moves towards 1 it may well become increasingly difficult for the company to maintain its high level of dividend distribution.
If dividend cover looks extremely high or extremely low, look at the financial statements before you get too concerned. Did some extraordinary event dramatically impact net income, such as a significant loss from a plant closing or the sale or purchase of a subsidiary? A one-time event that impacts net income can explain an unusually high or low dividend pay-out ratio and needn’t raise a red flag for investors.
Who pays the highest dividends?
Investors who purchase shares primarily for current income look to industries that traditionally have high dividend yields. Utility companies traditionally have some of the highest dividend yields, but you find good dividend payers in many mature, older industries. If you want to look for a good share to buy based on dividend pay out, here are two key factors to consider:
Cash stash: When you read the annual report, pay close attention to how much cash the company reports in its books. Remember that the dividend comes from extra cash flow. Most companies need to hold on to some of their cash so that they have money for acquisitions, research and development, and other capital needs to keep the company competitive, even if it’s not in a high-growth industry. Use your calculation of dividend cover to determine how much cash the company is using to cover its dividends and how much cash it’s saving for future needs. If the company is paying out most of its cash and saving very little, that may be a sign that the cash could run out at some point because the company is no longer reinvesting anything in maintaining its market or updating its products. Eventually, the company will lose out to competition and earn less, bringing in less cash.
Dividend consistency: As you read the annual report, also look for information about dividends paid out over the past few years. You can find that information for the past two years in the annual report and possibly longer if the company has a Five Year Record table in the notes to the accounts. You can get information for more than two years by looking up the company at Yahoo! Finance and other financial Web sites. You want to find companies that pay dividends at a consistent level or, even better, that are able to increase their dividend pay outs regularly.
Return on Sales
You can test how efficiently a company runs its operations (that is, the making and selling of its products) by calculating its return on sales (ROS). This ratio measures how much profit the company is producing per pound of sales. By analysing the numbers you’re seeing in the income statement using ROS, you can get a picture of its profit per pound of sales and gauge how much extra cash the company is bringing in per sale.
Remember, the company needs that cash to cover its expenses, develop new products, and keep itself competitive. Investors also hope that at some point in the future they may even be paid some dividends. At the very least, investors want to be sure that the company is generating enough cash from sales to keep itself competitive in the market through advertising, new product development, and new market development.
Figuring out ROS
To calculate ROS, divide the profit before taxation by sales. You can find both numbers on the income statement. Sales (sometimes called revenue) is the top number on the income statement. This figure for sales is sometimes referred to as net sales since it is shown in the accounts net of VAT. Profit before taxation is in the expense section of the income statement just before tax expenses are reported.
profit before taxation ÷ sales = return on sales
You can calculate Tesco’s ROS based on information in its income statement for 2007 (see Appendix A):
£2.653 million (profit before taxation) ÷ £42,641 million (sales) = 6.22 per cent (ROS)
Tesco made 6.22 per cent on each pound of sales. Compare that number with Marks and Spencer’s ROS (using numbers on its income statement in Appendix A):
£936.7 million (profit before taxation) ÷ £8,588.1 million (sales) = 10.91 per cent (ROS)
Marks and Spencer made 10.91 per cent on each pound of sales.
Investors can use the ROS ratio to determine how much profit is being made on a pound of sales. In comparing Tesco and Marks and Spencer, you can see that Marks and Spencer made almost double the amount per pound of sales than Tesco did.
When comparing with previous years, you must consider any changes which have occurred to the accounting policies, or any unusual events that may have occurred in one year and not the other. Marks and Spencer provide a good example of this. In the financial year to 2007, they disclose that some of the interest charge is exceptional in nature. Therefore, if we want to make a fair comparison between 2007 and 2006, we need to adjust the ratio to remove the exceptional cost from the profit before tax figure. This results in a revised ROS of 11.26 per cent as against the original calculation of 10.91 per cent. The figure of 11.26 per cent is the correct figure to use when making a comparison with the 2006 ratio which was 9.56 per cent.
This exceptional item will affect all calculations of ratios which use a profit figure. For simplicity, in the following ratios, we use the figures as stated and will not adjust for the exceptional costs.

Reaching the truth about profits with ROS
In reading analysts’ reports on Tesco and Marks and Spencer, we found that Marks and Spencer’s historical ROS has been climbing so the results for Marks and Spencer in the preceding section are expected. Tesco is experiencing a continued improvement in its operating income. Its ROS in 2007 was 6.22 per cent, a good advance on the previous year. There’s no question that Marks and Spencer is making more per pound on sales than Tesco, so why do investors see Tesco as the better buy measured by P/E ratios? You need to consider the fact that Tesco sells primarily food while Marks and Spencer is very big in the garment business. The garment business is known to be more risky because of the risk associated with what is fashionable and what is not. When you see a disconnect between the ratios and the market’s view of a share’s worth, you need to research further using the information you find in the notes to the financial statements as well as in reports from analysts and the financial press. Because Marks and Spencer shares are selling at a lower P/E, even though it’s earning more per pound on sales than Tesco’s, we knew we needed to dig deeper to find out why. Perhaps the answer is in the segmentation of the businesses between food and garments that you can find in the notes to the accounts.
Once you’re armed with the information about why investors have a positive or negative view about a particular share, you can determine for yourself whether or not the share is a good investment. Even Marks and Spencer’s stronger ROS is just one part of the puzzle. You need to analyse fully the information you see in the annual reports to find all the pieces and make a determination about whether to invest in a company. This chapter focuses on profitability. You also need to analyse a company’s liquidity, discussed in Chapter 12, and its cash flow, covered in Chapter 13.
Return on Assets
You can judge how well a company uses its assets by calculating the return on assets (ROA). The ROA ratio shows you how much a company earned from its assets or capital invested. If the ROA is a high percentage, the company is likely to be managing its assets well. As an investor, that’s important because your shares represent a claim on those assets. You want to be sure that your claim is being used wisely. If you haven’t invested yet, be sure your investment goes toward shares in a company that invests its assets well. As with all ratios, you need to compare results with those of similar companies in an industry for the numbers to mean anything.
To calculate ROA, divide profit for the year by total assets. You can find profit for the year at the bottom on the income statement, and you can find total assets by adding together the figures for non-current assets and current assets from the assets section of the balance sheet.
profit for the year ÷ total assets = return on assets
Doing some dividing to get ROA
Using the numbers from Tesco’s income statement and balance sheet (see Appendix A), you can determine its ROA:
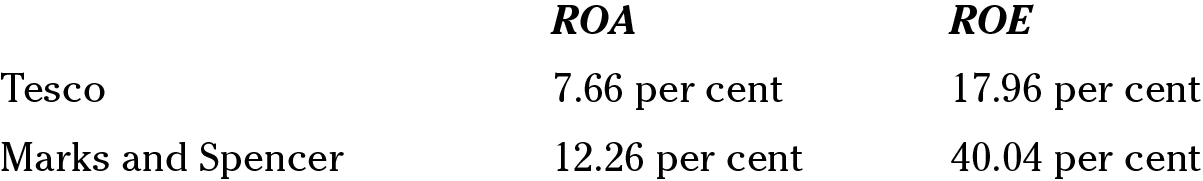
£1,899 (profit for the year) ÷ £24,807 (total assets) = 7.66 per cent (ROA)
So Tesco made 7.66 per cent on each pound of assets. Compare this number with Marks and Spencer’s ROA (using numbers from its income sheet in Appendix A):
£659.9 (profit for the year) ÷ £5,381.0 (total assets) = 12.26 per cent (ROA)
Marks and Spencer made 12.26 per cent on each pound of assets. Marks and Spencer earned about 60 per cent more on each pound of assets compared with Tesco.
Ranking companies with the help of ROA
The ROA ratio gives investors and creditors a clear view of how well a company’s management uses its assets to generate a profit. Both shareholders’ equity (claims on assets by shareholders) and debt funding (claims on assets by creditors) are factored into this calculation, meaning that the ratio looks at the income generated using money raised by borrowing funds from creditors and selling shares to shareholders. From looking at the examples in the preceding section, you can see that Marks and Spencer generated more income on its invested capital than Tesco.
ROA can vary significantly depending on the type of industry. Companies that must maintain manufacturing operations with expensive machinery have a much lower ROA than companies that don’t require to put much of the capital they raise from selling shares, borrowing funds, or generating income into expensive assets, such as factories and production equipment. Service companies don’t require spending on these expensive types of assets. Companies with low asset requirements have an ROA of up to 20 per cent or higher, whereas companies that require a large investment in assets can have ROAs below 5 per cent.
Return on Equity
Return on equity (ROE) measures how well the company did earning money for its investors. ROE looks at the profit left for the shareholders after meeting all other liabilities.
In fact, you’ll probably find it easier to determine an ROE for a company than an ROA. Although the ROE is an excellent measure of how profitable the company was in comparison with other companies in the industry, you should look at the ROA as well, because that ratio looks at returns for both investors and creditors.
Calculating ROE
You calculate ROE by dividing net income earned by the company (which you find at the bottom of the income statement) by the total shareholders’ equity (which you find at the bottom of the equity section of the balance sheet):
profit for the year ÷ shareholders’ equity = return on equity
Note that shareholders’ equity includes minority interests because the profit for the year is stated before any payments (dividends) are made to the minority shareholders.
You can figure out Tesco’s ROE based on its 2007 income statements and balance sheets (see Appendix A):
£1,899 (profit for the year) ÷ £10,571 (shareholders’ equity) = 17.96 per cent (ROE)
Tesco made17.96 per cent on each pound of shareholders’ equity. The following is Marks and Spencer’s ROE, also based on its 2007 income statements and balance sheets (see Appendix A):
£659.9 (profit for the year) ÷ £1,648.2 (shareholders’ equity) = 40.04 per cent (ROE)
Marks and Spencer made 40.04 per cent on each pound of equity. Comparing Tesco and Marks and Spencer, you can see that Marks and Spencer generated more than twice as much profit on its shareholders’ equity.
Reacting to companies by understanding the ROE
Investors most often cite the ROE ratio when they want to see how well a company is doing for them. But is ROE really the best measure? Comparing ROE to ROA for Tesco and Marks and Spencer, you can see that both companies’ ROEs look better than their ROAs.
The Big Three: Margins
You need to investigate three types of margins when you evaluate a company based on its financial reports. Margins show you how much financial safety the company has after its costs and expenses. Each of the three margins we discuss – gross margin, operating margin, and net profit margin – shows what the company has left to work with at various stages of the profit calculation.
Dissecting gross margin
Gross margin is the profit margin based solely on sales and the cost of producing those sales. It gives you a picture of how much revenue is left after all the direct costs of producing the product have been subtracted. These costs can include discounts offered, returns, allowances, production costs, and purchases. We talk about these costs in greater detail in Chapter 7.
To calculate gross margin, divide gross profit by sales or revenues:
gross profit ÷ sales or revenues = gross margin
You can find gross profit at the bottom of the sales or revenue section of the income statement. Sales are at the top of the same section.
Using numbers from Tesco’s income statements (see Appendix A), you can calculate its gross margin:
£3,463 (gross profit) ÷ £42,641 (net sales) = 8.12 per cent (gross margin)
Tesco made a gross profit of 8.12 per cent on each pound of sales. Compare this number with Marks and Spencer’s gross margin (using numbers from its income statement in Appendix A):
£3,341.2 (gross profit) ÷ £8,588.1 (net sales) = 38.9 per cent (gross margin)
Marks and Spencer has about 30 pence in every pound of sales more revenue left after it subtracts its direct costs than Tesco has. You may think therefore that Marks and Spencer has better cost controls on the purchase or production of the products it’s selling but you need to remember that Tesco operate in a much more competitive market. The gross margin is a crucial number in a comparison of these two companies. Tesco has to run the gamut of price wars with its competitors and runs with a much lower gross margin as a result.
Investigating operating margin
The operating margin takes the financial report reader one step further in the process of finding what is left over for future use and looks at how well a company controls costs, factoring in any expenses not directly related to the production of a particular product. These costs include advertising, selling (sales staff, sales offices, sales materials, and other items directly related to the selling process), distribution, administration, research and development, royalties, and any other expenses not directly related to the cost of producing a particular product.
operating profit ÷ sales or revenues = operating margin
You can find sales or revenues at the top of the income statement and the operating profit at the bottom of the expenses-from-operations section on the income statement.
Using numbers from Tesco’s income statements (see Appendix A), you can calculate the operating margin:
£2,648 (operating profit) ÷ £42,641 (net sales) = 6.21 per cent (operating margin)
Tesco made an operating margin of 6.21 per cent on each pound of sales. Compare this number with Marks and Spencer’s operating margin (using numbers from its income statements in Appendix A):
£1,045.9 (operating profit) ÷ £8,588.1 (net sales) = 12.18 per cent (operating margin)
Marks and Spencer made an operating profit of 12.18 per cent on each pound of sales.
You can see the profitability gap is closing. Now that all indirect expenses are factored into the equation, Tesco appears to have a better handle on expenses than Marks and Spencer. Marks and Spencer’s operating margin is only twice as much as Tesco although their gross margins were apart by about four times. Again, remember that while the two companies are in the same sector (retail), they are facing different challenges because of the products they sell and the market that they sell them to.
Catching the leftover money: Calculating the net profit margin
The profit for the year looks at a company’s bottom line. This calculation shows you how much money the company has left after it has deducted all expenses – whether from operations related to the production and selling of a company’s products or from non-operating expenses or revenue not related to the company’s sales of products or services.
For example, a non-operating revenue would be interest or dividends earned on a company’s investments. That money wasn’t generated by operations but is still considered earnings for the company. After the operating income line on the income statement, you usually see a line for finance costs. This line represents the interest the company paid out on corporate borrowings and overdrafts. You also see taxation, which indicates the amount that the company will be paying in corporation tax on the profits for the year. These are two of the biggest charges left to subtract from operating income. The only exception to this rule is if a large exceptional charge from a special event, such as discontinued operations or the purchase or sale of a division, appears on the income statement. These items also appear after the operating profit line.
To find net profit margin, divide profit for the year by sales or revenues:
profit for the year ÷ sales or revenues = net profit margin
You can find the profit for the year at the bottom line of the income statement; it may also be called ‘net profit’ or ‘net loss’. Sales or revenue is on the top line of the income statement.
You can calculate the net profit margin using numbers from Tesco’s income statements (see Appendix A):
£1,899 (profit for the year) ÷ £42,641 (sales) = 4.45 per cent (net profit margin)
Tesco made a net profit of 4.45 per cent on each pound of sales. Now calculate Marks and Spencer’s net profit margin using numbers from its income statements (see Appendix A):
£659.9 (profit for the year) ÷ £8,588.1 (sales) = 7.68 per cent (net profit margin)
Marks and Spencer made a net profit of 7.68 per cent on each pound of sales. Comparing Tesco’s and Marks and Spencer’s net profit margins, Marks and Spencer appears to be more successful at generating a net profit per pound of sales than Tesco. The key question investors must then ask themselves is whether or not Marks and Spencer will perform as well in the future. They need more than just figures to do this. They need to think about the products and markets the companies are dealing with and whether, in their opinion, they will still thrive into the future. They take into account the quality and reputation of directors and managers.