Chapter 5
Why the Templeton Method Works
John Templeton was always at pains to emphasize that no one single metric would enable investors to pick winning stocks. His team of analysts, he once told two biographers researching a book on his methods, looked at more than 100 different yardsticks of value when his team was “hunting for bargains” around the world. Earnings, balance sheets, and cash flow were all among the many indicators that his analysts studied. “We think it would be a mistake to adopt any one method,” he went on. “We want our analysts to adopt whatever approaches are appropriate to a particular situation. I cannot be really specific about this. Besides, any method that is particularly successful only works if we keep it to ourselves. So we wouldn’t tell people about methods that worked particularly well.”1
At the same time, he was adamant that the successful investor should not be tied to one single approach. “The key to long-term success is to keep an open mind,” he told the same authors. “And by that I mean the willingness to adapt any approach, any technique suitable for the investment. And to explore any type of investment in any place in the world.”2
This was not just a matter of words. He himself gave money from time to time to a number of professional investment managers who followed a range of quite different approaches than his own, merely to test how well they might do. To take just one example, in the 1990s he gave £10 million of his own money, in two tranches, to Jayesh Manek, an Asian pharmacist in England who had won a stock picking competition in a national newspaper. The money enabled the latter to start a fund, which continues today. Templeton admired his enterprise and wanted to see if he did in fact have genuine stock picking skill. His argument that the most relevant yardsticks of value would vary from one kind of stock, or investment, to another was one that he was diligent in enforcing on those who worked for him.
Yet there was one central idea behind his concept of bargain hunting to which he continually returned, and which lies at the very heart of his investment methodology. The yardstick of value for stocks on which he placed most reliance was earnings—and critically, not just a company’s historic earnings, which are known, but their future earnings, which by definition are not. The critical task for any analyst setting out to pick stocks, he believed, is to attempt to forecast future earnings more than one year ahead and then to determine whether stocks are cheap in reference to their intrinsic value based on those future earnings estimates.
The focus on future earnings, it is worth recalling, was already a central part of the methodology that he put forward in memos to his investment advisory clients as early as the 1940s. It was the same idea that he pitched to Dr. Mark Mobius when persuading him to launch an emerging markets fund in the 1980s. Over time, he came to refine this approach more precisely to the point where, by the time one of the current authors was working directly for him in the 1990s, as Director of Global Equity Research, the focus of the analytical effort had zeroed in specifically on five year forward earnings forecasts as being the most important input in the stock picking process. It remains to this day the central metric around which Templeton disciples continue to craft their regular analytical work.
Clearly forecasting earnings five years ahead is, however, a complex and demanding task. Most broker forecasts of earnings even one year ahead, for example, have been shown to have significant biases. They are so prone to systematic error that they are an unreliable basis on which to make stock picking decisions.3 This is one reason why, although Templeton used broker research for background information and ideas, he insisted on using his own trained in-house analysts to carry out this important and challenging research. Although it was impossible to achieve anything like 100 percent accuracy in forecasting earnings, they would at least be attempting to look at what he was confident was the right variable over the right time horizon.
Before looking at how this can in fact be done, it is worth returning to an important fundamental question, which is: Why was Templeton so sure that five-year forward earnings forecasts should be at the heart of his stock picking methods?4 Why five years rather than some other period? Why earnings rather than some other commonly used metric, such as cash flow or balance sheet analysis? In the next section we attempt to address this fundamental issue, which remains largely unanswered in other books or studies of Templeton’s methods.
To do so, we draw on the findings of the detailed research that one of the current authors has been undertaking, in ever greater depth, since he first worked for the Templeton organization more than 15 years ago. As Director of Global Equity Research at Templeton Investment Management in the mid-1990s, he took it upon himself to start testing empirically some of the many investment ideas and hypotheses that John Templeton had come to believe in through his own studies and experience.
One of the first of these that he set out to study was the relationship between long-term earnings, share price performance, and investor returns. This produced a set of results that, though based on just a single five-year period, so clearly and so emphatically reinforced the wisdom of John Templeton’s intuition that no further analysis seemed necessary at the time. Subsequently, however, and in order to test the validity of this initial finding more thoroughly, the study has been expanded across a wide range of other markets and periods to establish exhaustive and statistically robust conclusions.
The findings of these exhaustive studies can be summarized as follows:
- The most important imperfection in the way that the stock market prices stocks is to be found in the short time horizons of the majority of investors.
- There is no statistically significant relationship between one-year forward earnings and future share price performance. (It follows that there should be no surprise that stockbroking analysts have such an indifferent record in forecasting share price performance over such short periods.)
- The same is true for earnings two years ahead. There is no statistically reliable correlation between the earnings a company will make two years ahead and its share price performance. It is only when comparing three year forward earnings with share prices that the first signs of a significant causal relationship begins to appear.
- Further analysis shows that the closest and strongest correlation between current share prices and forward earnings comes over five years, which was precisely the time horizon on which Templeton expected his analysts to concentrate when preparing their analyses of quoted companies.
- This relationship appears to hold for most markets around the world and is consistent over any period that is chosen for study. (Our analysis dates back to the mid-1970s, when the comprehensive data that allows such analysis first became available.)
- It follows that investors who can forecast, within reasonable margins of error, the five-year forward earnings for most of the stocks they own are likely to be rewarded with above average performance over that time period.
- It is no coincidence that five years happened to be Templeton’s own average holding period for the stocks in his portfolios; and also the period over which his funds most reliably outperformed the market. His intuition about five years being the critical forecasting period ultimately derived from his own experience as an investor.
The study provides strong empirical evidence, therefore, not just that Templeton was right to focus on five-year future earnings as a key variable in stock selection, but that those who can forecast them with any degree of effectiveness can expect to be handsomely rewarded by the market. When the majority of investors are asking the wrong question, anyone who can ask the right one starts out with a huge advantage. Although he continued to study alternative methods until the end of his life, it was an article of faith with John Templeton that there was no more reliable way to produce exceptional long-term results.
Having said that, however, by its nature forecasting future earnings remains a hazardous business in which certainty can never be attained. So, while the five-year earnings forecast remains the most reliable method of obtaining above average results, it alone does not guarantee success. It has to be implemented well. The risk of analytical error is what makes it essential, in Templeton’s view, to diversify portfolios. The Canadian fund manager Peter Cundill recalled being given some sound advice after both men once lost a lot of money in the shares of Cable & Wireless: “I talked to John Templeton about it afterwards and he took a worse hit than us. He said: ‘That is why we diversify. If you are right 60 percent of the time and wrong 40 percent you’re always going to be a hero; if you are right 40 percent of the time and wrong 60 percent you will be a bum,’ adding, ‘I think he probably put it more elegantly than that!’”5
The initial study looked at the relationship between earnings and share prices in the U.S. market between 1990 and 1995. The coverage has subsequently been expanded to incorporate 30 years of data (every year back to 1970); companies from every sector; all investable markets (both developed and emerging); and a full range of market capitalizations (from large cap to small cap). As distortions caused by survivorship bias are an important risk to any study of historical relationships, significant efforts have been made to recreate the investable universe as it would have looked in the past. Today a team of three at Edinburgh Partners continues the analysis using more than 40 years of data from over 25,000 companies.
The methodology used is based on the assumption of perfect forecasting ability. In other words, for any given period of historical data, the earnings actually achieved by the universe of companies being studied are compared to the price at which their shares traded at specific earlier periods (one, two, three, four, and five years before). The implicit price-earnings ratio at the original date can then be plotted against, and compared with, the eventual return that was subsequently achieved. Returns are calculated in both local and common currency (USD) and in both nominal and real (inflation-adjusted) terms.
The study demonstrates conclusively that there is a clear and unambiguous relationship between five-year forward P/E ratios and the subsequent total return to investors. This strong and positive relationship holds over different economic and stock market cycles, and across all sectors and geographies. Just as clear, and equally robust in a statistical sense, is the lack of any relationship over much shorter time periods.
The easiest way to illustrate the strength of the relationship is to plot on a chart the total return delivered by a range of real life stocks over five years (shown on the vertical axis) with the implied five-year forward P/E ratio at the time the shares in question could be bought (shown on the horizontal axis). If there is a clear and positive relationship, you would expect it to appear as it does in the stylized version shown here. Note that the study examines total returns, meaning capital appreciation and income return combined. See Figure 5.1.
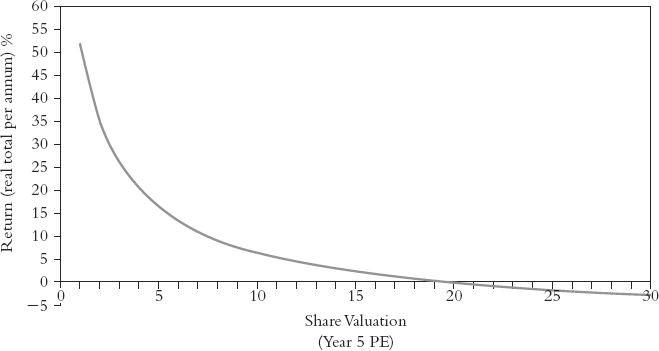
Figure 5.2, which shows the average real returns and P/Es for over 3,400 stocks from 50 countries and all sectors over the period 2003 to 2008, illustrates the strength of the relationship between year five P/E ratios and total returns. With the exception of the very lowest P/E band (discussed later), the lower the starting P/E, the higher on average the eventual return—or, to put it in simpler language, the cheaper a stock when you buy it, the greater the return five years later. (The year five price to earnings ratio is the current share price of a company, divided by our forecast of earnings in five years’ time, so in 2012, the investment team at Edinburgh Partners will be forecasting earnings for 2016.)

The horizontal line on the chart marks the point at which stocks in aggregate in this period delivered a zero real total return. It shows that in aggregate any shares which were trading at the outset at more than 11 times their earnings five years later were destined on average to deliver negative real total returns to those who bought them at that point. Those who bought the shares that turned out to be cheapest on a five-year view also produced the best returns. The breakeven P/E ratio, the one above which an investor is destined to achieve negative returns, was again about 11 times five-year earnings in this period.
Caution always needs to be exercised when analyzing results for a single five-year period. The results may simply illustrate a cyclical phenomenon, reflecting the particular circumstances of that period. Hence, the study also looks at the relationship for all five-year periods since 1970. This, we believe, is a sufficient period of time to capture examples of most economic or stock market cycles. Events that are covered in this period include: the hyper-inflation of the 1970s; the deflation experienced in Japan since 1990; periods of both strong growth and recession; and both bull and bear markets for stocks.
When recreating history in this way, it is important to analyze the universe of stocks that would have been available to investors at the specific starting point chosen, and not just those stocks that happened to survive throughout the period being studied. The risk otherwise is that a significant “survivorship bias” is introduced, which can have a material impact on the returns in particular.
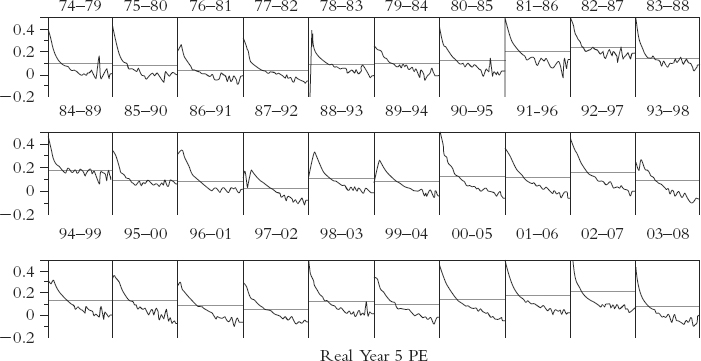
Figure 5.3 summarizes the relationship between total real return in US$ per annum (on the vertical axis) and the five-year real P/E ratio (on the horizontal axis) for each five-year period since 1974. The black line shown on each chart represents the unweighted average real total return in US$ for all stocks within each five-year period. It can be clearly seen that in every period the relationship follows a broadly similar pattern. (It is surely no accident that the years 1985 to 1990, when the normal relationship was unusually and exceptionally weak, was also the period when the Templeton Growth Fund underperformed the world market by the largest margin in its 38-year history.)
Figure 5.3 Five-Year Total Real Return versus Year 5 Real PE, 1974 to 2008
Note: NB: 0.4 = 40% per annum.
Source: Edinburgh Partners.
Shorter time periods from one to four years have also been systematically examined to investigate whether the relationship between real returns and real P/E ratios holds over different investment cycles. The findings are instructive, since they make clear that there is no formal or identifiable relationship between earnings multiples and returns over these shorter time periods. By way of example, Figure 5.4 shows the relationship between the real P/E ratio and the total real return in U.S. dollars over two different two-year periods. As with all charts in the study, this is based on the assumption of perfect hindsight (actual attained earnings and returns).
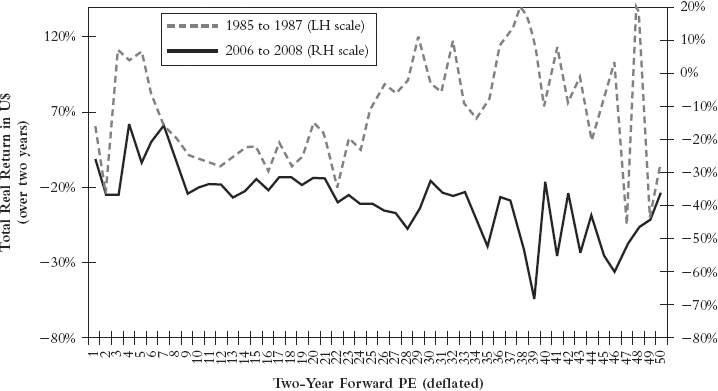
The results clearly illustrate the dangers of extrapolating what appears to be a short-term relationship into a universal truth that holds in different economic and market cycles. The results of the two-year period from 2006 to 2008, for example, would initially suggest a reasonable relationship over this time period. Compare this to another two-year period, such as 1985 to 1987, however, and the relationship is almost completely reversed. In this period, the highest average returns were achieved by stocks trading on two-year forward P/E ratios above 30!
This has some important implications. Over one- and two-year periods, the study demonstrates that there is no certain relationship between the starting P/E, even assuming perfect foresight, and the total returns subsequently achieved. Those who attempt to pick stocks solely on this kind of methodology are therefore fated to do well in some periods, and badly in others. While their methods may produce good or even spectacular results from time to time, they cannot be said to be either reliable or consistently well-founded. The only systematically consistent and reliable basis for picking stocks on the basis of forward P/E ratios is if you choose a five-year time horizon and have the discipline and expertise to apply it. This is exactly what John Templeton set out to do and exactly what he succeeded in doing.
Some readers may perhaps be wondering at this point why so much time and effort has been devoted to what might simply be described as common sense. It is surely no surprise that investors who buy the cheapest stocks, those with the lowest price-earnings ratios based on future earnings, should subsequently achieve the best results. It is a valid question, and one to which John Templeton himself gave some thought. He was always clear that his methods were in fact no more than common sense. He conceded that calculating forward earnings estimates was difficult and required exceptional amounts of hard work, but was adamant that there was no better path to investment success than following the simple admonition: “Buy cheap stocks.”
Implications for Portfolio Construction
The findings of the equity study have powerful implications for the creation of investment portfolios. The study shows that there is a clear relationship between long-term P/Es and real total investment returns. It also demonstrates that there is no relationship over periods of less than three years. The closest correlation appears to be with the real after-tax profits that a company makes over a five-year time horizon. It follows that anyone who has a better than random success in forecasting five-year earnings has the capacity to produce above average returns.
If in the long-run share prices are determined by profits, it follows that the central task of the investor is to seek to forecast these profits, which is far from easy. Most of the forward-looking information available to investors, including analyst earnings forecasts, typically relates to periods that are in practice much shorter than two years. That the task is difficult does not remove the need to attempt it. Since the market will eventually value all stocks on this basis, any investment decision is implicitly making a judgment about a stock’s long-term earnings potential. The question for anyone constructing a portfolio is how to make this judgment explicit and central to the process.
Of course, if anyone had 100 percent accuracy in forecasting, there would be no need for a portfolio at all, since perfect knowledge would remove all the risk from the process. It would suffice to pick the best single future performer. But as nobody has perfect foresight, it makes sense to measure the risk in each potential stock, by for example estimating a range of future profit outcomes with a probability attached to each one. From this the investor can then build a diversified portfolio that takes account of and reflects these uncertainties. (“The only investors who shouldn’t diversify,” to repeat a Templeton maxim, “are those who are right 100 percent of the time.”6)
The distinction between investment philosophy and investment process is critical to understanding the way that John Templeton invested. His philosophy is the belief that securities are valued relative to their long-term earnings. The investment process, however, involves assembling a range of tools that help determine what these earnings are likely to be, and the margin of error that surrounds those estimates. The analytical tools—the 100 yardsticks of value mentioned earlier—are used by investors of all types, but only rarely are they directed at answering the question that Templeton understood was the one that most needed answering.
Books that claim to have discovered a magic formula for generating investment returns often fall foul of the important distinction between philosophy and process. All too often they are not about how to implement an investment philosophy, but about how to apply a specific investment process—conduct this analysis, or apply this technique, so the message to the reader runs, and you too can outperform the market. The reality is that, in helping to predict future earnings, no one set of analytical ratios works all the time. Different approaches work at different points in time. The formulas that grab the headlines are almost invariably based on historic data that has been back tested to show how they would have produced outstanding results over a certain period in the recent past. The implicit assumption is that what worked before will work again in the future. Yet we know that this is not the case, which is why in many cases the recipes for success cease to produce good results almost as soon as they have been publicized.
A more sensible view, implicit in John Templeton’s own philosophy, is that any investment process must combine a wide range of techniques and allow for the fact that the future will not invariably repeat the past. That in turn implies understanding how and why it is that human nature drives markets to extremes of under- and overvaluation. In his experience, it was just as important to avoid costly mistakes as it was to pick winners.7 Some of the smartest and best educated people in the world work in financial markets. Yet the history of investment is full of manias during which even the smartest participants find themselves owning stocks whose valuations are so high that they defy rational explanation.8 Simple extrapolation of past experience is often to blame.
One of the most costly mistakes stock pickers make, for example, is to assume that a successful company in a competitive marketplace can go on making supernormal profits for an extended period, in direct contravention of all the principles of economics. For example, a pharmaceutical company with strong profits and cash-flow trading on a historic P/E of 10× earnings with growth for the next five years superficially looks cheap. However, if it has no drugs pipeline and all its drugs go off patent in year five then it may well be expensive.
Equally, if an auto manufacturer has never managed to sustain an operating profit margin over 10 percent in the past 40 years, is it rarely likely that it will do so in the future in an industry that continues to be characterized by overcapacity? A robust investment process will highlight how the margins being forecast sit in the context of historic ones, leading to a debate about whether there is any justification for this having changed. The process involves a combination of rates of growth and valuation. While the study shows that companies are unlikely to produce good returns unless they are trading at less than 11× five-year forecast earnings, the route by which different companies might reach that end point can be very different. A company that is in the early stages of growth, and trades on an initial P/E of 50× next year’s earnings clearly looks expensive. But if it is in fact about to experience 10 years of strong future double-digit growth, it is not impossible that it is cheap, although the assumptions behind expecting such an outcome clearly need to be rigorously tested. Similarly a company that is trading on six times next year’s earnings may still be expensive if its earnings are set to fall thereafter. A robust investment process should make it difficult to make stupid assumptions.
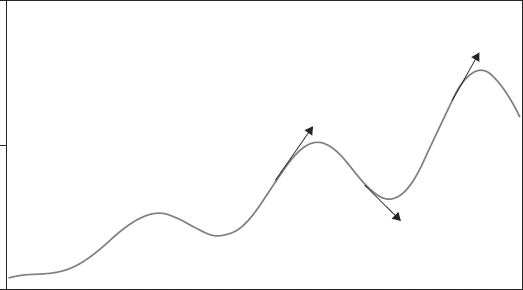
Linear extrapolation is a natural way for human beings to observe the world. Figure 5.5 may help to explain why. It shows a simple cycle set on top of an underlying growth. For most of the time linear extrapolation represents the best forecast with the lowest error. The problem arises when the cycle changes. When that happens, extrapolation is not just wrong, but very wrong. Investors who rely on it will find themselves either greatly overoptimistic, or greatly pessimistic. This, as John Templeton saw, was what created opportunities and underpinned his maxim that the time to buy was during times of maximum pessimism. When from time to time economists float the idea that the business cycle has been abolished, it is also the result of linear extrapolation trumping historical experience. It is a good example of his famous phrase that “this time it’s different” are the four most expensive words in the investing language.
Understanding how and why investors make mistakes is therefore an essential part of the analytical process and every bit as important as a mastery of financial ratios. John Templeton was once asked what had made the greatest difference to the quality of his investment decision making. He replied, “Every mile I moved away from New York.” As we have seen, this is borne out by the evidence; the margin by which his fund beat the market went from zero to 6 percent per annum when he moved to the Bahamas and started to work on his own. Investment analysis is, or should be, a contemplative and peaceful task. It is unlikely to be successful in an environment where the telephone never stops ringing and the analyst is distracted by multiple screens of data, all changing in real time, on the desk in front of him. To beat the market, Templeton pointed out, it is necessary to do something different from the market. The ability to make independent judgments is unlikely, therefore, to be helped by looking for guidance from the opinions of other participants in the market. Yet this is how many investors in practice choose, or are required, to operate.
Information overload is an operational hazard for all modern investors. Ironically, many asset management companies go out of their way to differentiate themselves by reference to the number of analysts they employ or the number of offices they have around the globe. Access to instant information, web-based systems, and technology are deployed as reasons why they have an information edge. Yet, as we have seen, initially working alone in the Bahamas, Sir John was able to produce a track record that is unlikely ever to be bettered. He had no Internet and no fax machine. His information was out of date by the time it arrived. All he had was access to historic financial statements, the contacts he had built up over many years, and the scope for extensive travel. It was the depth and clarity of his thought that determined his results, not the volume of information or the speed with which it was delivered.
The way in which professional investors are organized and incentivized also often creates a bias against independent thinking. Most fund managers, for example, are judged and rewarded on the basis of the returns their funds make over relatively short-term periods. If, as the study suggests, there is no discernible relationship between share prices and valuations over periods of three years or less, then effectively analysis of results over that time horizon has little meaning. It is impossible to determine whether the results of fund managers are the results of luck or skill. Yet this does not prevent investors from moving money in large quantities away from fund managers who have performed poorly over a two- or three-year period and placing it with others who have better short-term results.
At the same time, the primary focus in measuring fund performance remains relative rather than absolute. It is little surprise in the circumstances that few fund managers are prepared to take the risk of deviating far from their benchmarks. The important point in this context is that business risk, or fear of losing funds or clients, militates strongly against effective decision making in the investment business. Any investor who spends much time thinking about tracking error, or the relative performance of his portfolio against a benchmark, has already moved away from the fundamental truth that is captured in John Templeton’s approach. Relative performance is a useful way of measuring the outcome of an investment process—but as soon as it becomes an input in the investment process, it is doomed to be counter-productive.
Ever improving technology is one of the spurs that challenges the modern professional investor to greater levels of activity than is either necessary or desirable, and distracts attention from what is genuinely important to the main task of forecasting future earnings. Much of the information that arrives in real time on a Bloomberg or a Reuters screen is “noise,” irrelevant to the investment analyst’s objectives. Thanks to the Internet, graphs and prices of relevant securities can be updated on a minute-by-minute basis. Brokers are another source of pressure to trade, since trading activity drives their revenues. The role of the broker is to stimulate activity. Broker revenue is paid for by clients and if it leads to excessive turnover, can become a meaningful cost that detracts from eventual returns. Investment firms themselves create incentives that perversely detract from the atmosphere of quiet detached contemplation that is required to implement a Templeton philosophy successfully.
It is not news that the return you can expect from owning a security is determined by its future growth in earnings. That assumption features in every modern investment and accounting textbook. The key variables are the sustainable future rate of growth and the price that an investor is willing to pay for that growth. Neither on its own, in Templeton’s method, says whether a stock is a bargain or not. It is the two in combination that matter. That does not, however, stop a huge amount of time and effort in the investment world being devoted to analyzing an investor’s style, and in particular to seeking to classify that style as either “value” or “growth.” While value investors focus on historic measures such as price to book, price to sales, or price to earnings, growth investors concentrate instead on future profits or cash-flow growth. John Templeton is often described as a value investor, but this is an oversimplification. After all, his most famous fund was called the Templeton Growth Fund. The name gives an important clue to how important future profits growth was in his approach. His genius was to combine both styles in a simple coherent approach that determined how much he was willing to pay for future growth and yet displayed an equal willingness to step back from ownership if the price was too high.
Applying Templeton principles is conceptually very simple. It is an approach that relies on a common sense search for value. Common sense requires that the majority of time is spent analyzing companies in a rigorous and disciplined manner to try and identify their underlying intrinsic value. Once this value has been established, it is compared to the prevailing share price. If there is a sufficient discount, it qualifies as a potential investment. The empirical evidence of the earnings study confirms that if the analysis is correct, it has every chance of producing above average returns.
The discount to intrinsic value that creates a potential bargain is a product of the sentiment that prevails in the market at any particular point in time. The analysis can be applied to a wide range of different industries and stocks, and in many different investing environments. There are always shares that, for reasons of sentiment or faulty analysis, are trading above or below their long-term intrinsic value. John Templeton’s greatest insight was to see that most investors are not even looking in the right place—which makes it unsurprising that, if their analysis is good enough, those who do can expect to outperform.
The proper question that any student of Templeton’s approach has to ask is therefore: Why do so many investors, professional and amateur alike, continue to pick stocks on metrics for which there is no discernible or reliable relationship over their chosen time horizon? The results from such an exercise, so the study implies, can never be other than random, even with perfect foresight. The answer to this conundrum is almost certainly to be found in the institutionally short-term nature of the investment business and the fundamental irrationality of much human behavior. A mystery is, however, what it remains.
Examples from the 1990s
In this section we seek to throw some further light on how the Templeton investment philosophy can be applied in practice by drawing on some real historical examples of investment decisions that were made in the 1990s. This was a period when one of the authors was working directly for the Franklin Templeton group as director of global equity research, with the responsibility of applying the principles established by Sir John Templeton to the management of an institutional global equity portfolio. The purpose is to show how an understanding of the philosophy could in practice be translated into effective action. Although Templeton himself was no longer applying his personal genius to the task of managing portfolios, he continued to meet the managers of the funds bearing his name on a regular basis to offer guidance and support.
The Templeton approach has important implications for how portfolios are constructed. Many professional funds are required, for example, not to hold more than certain pre-fixed proportions in different industries and countries. However, such an approach is logically incompatible with the Templeton philosophy. A portfolio constructed on Templeton lines will be shaped by where the cheapest stocks are to be found at any point in time. At a minimum a stock needs to offer a meaningful excess return over inflation for it to be worth including in a portfolio. If there are no stocks in a particular country or sector trading below their intrinsic value, choosing to own stocks in that category merely to conform with an arbitrary rule is, he believed, logically inimical to the investor’s best interests. If, for example, 40 percent of the cheapest securities the investor can find are in the United States, the presumption should be that the portfolio should have 40 percent of its holdings in U.S. securities. This, as we have seen, is how John Templeton himself managed his own mutual fund portfolios, and the discipline he imposed on those who managed funds for him.
In practice this meant avoiding, wherever possible, “big decisions.” The art of managing a global equity fund, in his view, was based on making a large number of individual decisions and letting them shape the portfolio, rather than following any predetermined global or macro judgments. Allied to this was his belief that the worst mistakes in investment arise when investors feel constrained to own something for reasons other than fundamental value.
A disciplined approach that focuses on a series of small decisions about individual companies has a number of practical advantages. It makes it easier for fund managers to act decisively. Having to obtain consensus for a major shift in asset allocation is far harder than adding a single new stock to a portfolio. By the end of the 1980s, no asset allocation or investment strategy committee operating under conventional asset allocation rules would have dared to advocate avoiding Japanese equities entirely, as Templeton did. It would have been far too high risk. Yet, by sticking to analyzing individual companies with a strict valuation discipline, this is precisely the freedom that an investor operating on Templeton principles enjoys.
If, as Templeton believed, the greatest risk in investment is paying too much for what you choose to own, it follows that, provided that the analysis of individual companies is thoughtful and diligent, the risk associated with owning something different from a market capitalization rated index is immaterial. The real risk in the Templeton approach is that the fundamental analysis used to pick individual stocks turns out to be wrong. The value of diversification comes not from owning a wide range of different types of security, but rather from the risk that the investor is wrong about the intrinsic value of what he has chosen to own. As we have seen, even such a great investor was never precisely right.
The focus on individual company analysis makes the task of asset allocation much more straightforward. If a professional investor can find enough cheap stocks to buy, then as a general rule it is right to be as fully invested in them as general portfolio considerations allow. If, though, as does happen periodically, the investor can no longer find sufficient “cheap” stocks to fill a portfolio, it makes sense to reduce the weighting in equities and hold cash instead (just as Templeton himself advised his clients to do at points in the 1940s and 1950s).
Example 1: The Savings and Loan Crisis
By the early 1990s, when the Japanese stock market was finally beginning a sharp descent from its earlier highs, Templeton was no longer being criticized in the financial press for having reduced the exposure of its portfolios of Japanese securities to zero. With the Japanese market now plunging, another big theme was now on everyone’s lips. It was: “Why are you investing in U.S. financial stocks? Don’t you know there is a savings and loan crisis?” This was a reference to the failure of many savings and loan institutions in the United States, that had lent heavily and unwisely following the deregulation of interest rates under the Reagan Administration, culminating in an expensive government-backed rescue. Yet the Templeton funds at the time, in typical contrarian fashion, had started to invest heavily in financial stocks, leading to a barrage of critical questions from investors and the media. Anyone pursuing the Templeton investment philosophy for a living discovers quickly how psychologically demanding it is to have to spend so much time defending buying what other investors are discarding, which by definition is where a Templeton-inspired investment philosophy leads you. Bargain hunters, in his words, “have to get used to the idea of people not confirming or agreeing their actions.”
In the case of the savings and loans, the background can be illustrated by some representative headlines at the time. A short summary could be: “It is a disaster! It is terrible! It is never going to recover!” These are powerful words if you begin to believe them. Although the headlines were right to highlight the troubles facing the industry at the time, the challenge for investors was to examine how far the prospects facing the industry were already discounted in the share price.
What the Herd Thinks
- S&L Crisis Makes Federal Government the Hottest Employer in Real Estate (Wall Street Journal, December 1989)
- S&L Rescue Hits More Cost Trouble (Financial Times, May 1990)
- Brady Says Cost of S&L Bailout Could Double (Wall Street Journal, May 1990)
- One Year After Signing of S&L Bailout Bill Industry Faces Same Problems Plus New Ones (Wall Street Journal, August 1990)
- S&L Crisis: Federal Bailout Agency Digs the Hole Deeper (Information Week, March 1992)
Moral: Buy during times of pessimism.
As can be seen from Figure 5.6, the share prices of U.S. financial companies, as a group, had been falling for almost three years. It is a good example of the general rule that negative sentiment about well publicized disasters tends to become so extreme that it results in potential problems being over-discounted. The savings and loan companies in the early 1990s were prime examples of the best time to buy, being times of “maximum pessimism.” The negative headlines were already more than reflected in share prices. Many stocks had halved. During times of pessimism it is difficult to stand apart from conventional wisdom. “Never follow the crowd,” another of Sir John’s sayings, is precisely what has to be done at such moments.
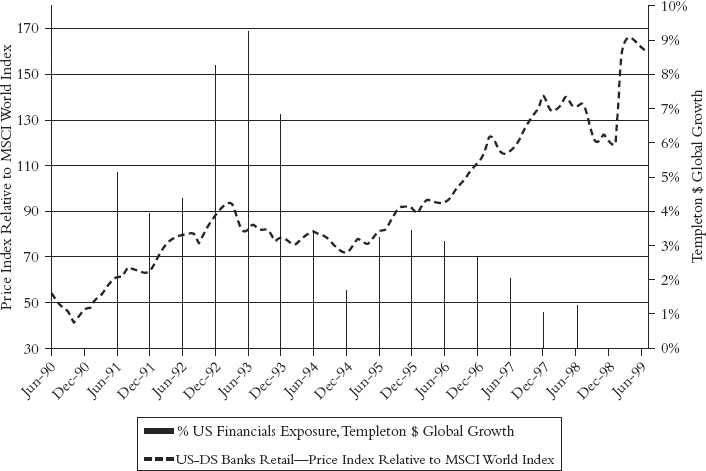
How to distance oneself from the crowd? Ignoring the headlines and concentrating solely on the operating characteristics and prospects of individual companies is an essential part of the discipline required. “Buy low” and “hunt for bargains among quality stocks” may sound like nothing more than common sense advice, but the advice would not be needed were it not so frequently ignored in real life when troubles hit. In the case of the savings and loan crisis, the decision to invest followed a detailed examination of the provisions for real estate losses, bad debts, credit and banking ratios, and so forth on a case-by-case basis. The fact that the Federal Reserve was supplying liquidity to the market and Federal Deposit Insurance Corporation (FDIC) was actively providing support were important background factors, an example of how understanding the macro background can be relevant when assessing the value of a particular company, or set of companies.
As can be seen from the charts, the weak share price performance of three of the companies in which the Templeton fund invested persisted for some time after the investment was made. As noted earlier, the Templeton investment approach rarely succeeds in identifying the precise moment at which the share prices of companies deemed to be cheap hit bottom. In the case of the financial stocks, the initial average loss before the shares started their recovery was in the region of 10 to 15 percent. The rationale for investing in the Templeton process is that over a five-year time horizon the share prices of undervalued companies will come to reflect the underlying intrinsic value of the company, not that they will go up immediately. It is directed at identifying intrinsic value, not when sentiment is about to turn. Patience is definitely required.
The exposure of the fund to U.S. financial stocks can be compared to the performance of the financial sector relative to the MSCI World Index (right hand scale). It can be seen how the proportion of the fund invested in U.S. financials rose during the period of negative sentiment and was later reduced before the shares of these U.S. financial stocks had reached their peak. This is the other side of the coin of being unable to judge how far negative sentiment will push share prices down. No investor can ever judge for certain how far beyond intrinsic value positive sentiment will push share prices on the upside. Chasing a share higher when its intrinsic value falls below the current share price, in the Templeton way of thinking, takes the investor beyond the realms of investment, as correctly defined, and into the realm of price speculation.
Example 2: Chemical Stocks and the Industrial Cycle
The second example concerns the global chemical industry at the time of the first Gulf War in 1991. This was a period of great political uncertainty, triggered by the Iraqi invasion of Kuwait, one of the leading Arab oil-producing states, and the coincidence of a sharp and painful economic recession. Anyone reading the financial press and analyst comments at the time would have formed the impression that the chemical industry was unlikely ever to recover from its latest setbacks. As well as being heavily exposed to the ups and downs of the economic cycle, it was widely known that the chemical industry was suffering from chronic overcapacity. Most industry analysts worked on the assumption that this overcapacity was going to take 10 to 15 years to eliminate.
Experience told us, however, that this scenario was far from being unusual. It has been repeated, to varying degrees, during every recession of the past 70 years. In reality, the chemical industry invariably recovers, and more quickly than expected. In the late 1980s, boosted by falling feedstock prices, the chemical division of Shell/Royal Dutch was returning profits of US$1–2 billion a year, making it the group’s most profitable division. That changed dramatically in the early 1990s. Shell’s chemical division was to lose nearly US$1 billion during 1992 to 1993. Such a turnaround in fortunes can have a significant psychological impact on companies, investors, and the financial press, particularly when it occurs at one of the world’s most highly respected companies.
What the Herd Thinks—Chemicals
- Chemical Industry Warned of Need for Restructuring (Financial Times, December 1992)
- Chemical Industry “Faces Over-Capacity Challenge” (Financial Times, December 1992)
- EC Chemical Industry Sees Poor Prospects for 1993 (Reuters, December 1992)
- Russian Chemical Industry Shrinks by 22% in 1992 (International Petrochemical Report, December 1992)
- Chemical Industry Output to Slip by $1bn this Year (The Strait Times, December 1992)
Moral: Buy during times of pessimism.
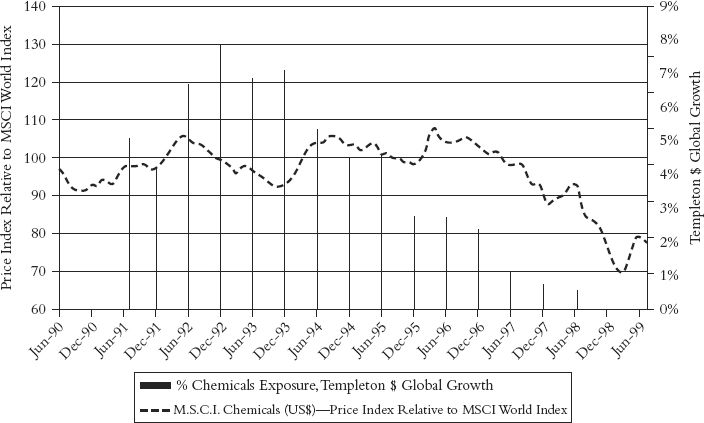
This feeling of despair was encapsulated in the financial headlines of the time and manifested in the share price performance of chemical companies generally. The herd was negativity personified. The share prices of chemical companies fell in a straight line for three years. Share prices of chemical companies were down everywhere: Germany, Holland, the United States, and the Far East. This was a global industry where the recession looked as if it might never end. For anyone working on Templeton principles, not following the crowd and buying during times of maximum pessimism, it soon became an obvious industry to spend time looking at.
The fund managers spent a great deal of time going through their balance sheets and the cash flow prospects of all the individual chemical companies, since capital stability—were they able to survive at all?—was one of the key issues. Detailed study of the competitive conditions in different product groups was carried out to try to discover what, if any, sustainable return on assets the companies might be able to achieve. The conclusion was that, contrary to the popular impression at the time, a substantial number of chemical companies were trading well below their intrinsic value. It had become a classic case of the market overreacting to bad news, and extrapolating current weakness indefinitely into the future. See Figure 5.7.
Not all the investments the fund made, it is fair to say, proved to be successful. This is not an unusual outcome for an investor pursuing the Templeton philosophy. However diligently and rigorously research is conducted, not every judgment about individual securities proves to be correct. The track record of the Templeton Growth Fund, when John Templeton was running it, as has been noted, was based on a success rate of two out of three stocks working well. Other funds have been able to beat the market with a much lower success rate. The important practical lesson is that mistakes in analysis are inevitable, and that is why running diversified portfolios makes sense.
As with the financial stocks, the fund once again failed to pick the absolute lows in the share prices of chemical companies as a buying point. On average, the stocks acquired fell by 20 percent after the fund’s initial investment. The invasion of Kuwait was one external factor that skewed the timing. The important thing was that the share prices of the fund’s target companies remained well below their estimated intrinsic value. In Templeton’s experience, it was better to be too early in buying cheap stocks than trying to catch them after their share prices had started to rise, when the greater risk was that the opportunity would be missed entirely. In this instance, as well, the share prices continued to rise for a while after the fund began to reduce its holdings. By the end of the decade the consensus had swung right around from despair to the belief that a shortage of capacity would continue to keep profit margins high even through the next economic downturn. This felt like the inverse of maximum pessimism, excessive optimism, and proved to be equally misguided when the post-2000 recession arrived.
Example 3: Metals and the Commodity Cycle
A third example can be seen in the behavior of the share prices of the metals industry. (See Figure 5.8.) In the early 1980s the prices of most metals had started to fall in both real and nominal terms. Despite sporadic rallies, an investor would have been hard pushed to avoid substantial losses from these stocks through the 1980s. By the early 1990s the London Metals Exchange was reporting record levels of stocks and widespread dumping of product, as the former Soviet Union pushed its unwanted stocks of aluminum, for example, into Europe and the United States. At a macroeconomic level there appeared to be no prospect of prices recovering, something that was widely reflected in the press at the time and in share prices.

What the Herd Thinks—Metals
- Precious Metal Prices Fall in Volatile Trading as New Data Shows Weak Inflationary Pressures (Wall Street Journal, October 1993)
- Base Metals Prices Are Clouded by Glut of Over-Production in the East and West (Wall Street Journal, October 1993)
- Losses at Asarco after Metal Prices Fall (Financial Times, October 1993)
- U.S. Copper Futures Fall as Available Stocks of the Metal Reach a 15-Year High in London (Wall Street Journal, October 1993)
- Base Metal Price Decline Pushes Cominco into Red (Financial Times, October 1993)
Moral: Buy during times of pessimism.
It might be thought that analyzing companies in an industry with globally priced, homogeneous products, such as metals and oil, would be particularly difficult for a “bottom up” investor who primarily focuses on individual company analysis. Actually, experience suggests that this is not the case. Clearly, in industries such as these it is necessary to form a view about the future path of product prices. Unfortunately, attempts to produce price forecasts with econometric models have proved singularly unsuccessful whenever they have been attempted. This approach has never been part of the Templeton investment method. The better, alternative approach—and the one adopted by John Templeton himself—is to aggregate a range of “bottom-up” information about all the companies in an industry. From that can be derived the range of price outcomes that would be necessary for the companies to make a satisfactory return on capital over a period of years.
For the major metals companies of the world, it is relatively simple to calculate what return on assets is needed to ensure their long-term survival. The analytical task is then to determine the commodity price at which the industry as a whole is able to replace its assets. This is the minimum price that will allow a mining company, for example, to finance the capital expenditure required to maintain and replace its existing mines, or for an aluminum company to maintain and renew its smelters. Unless those price levels could be obtained at some point in the future, it follows that the industry would simply go into decline. The way that competitive capitalist industries work, that in turn would eventually lead to capacity shortages and a consequent revival, after a number of years, in the industry’s fortunes.
What became apparent in the early 1990s was that the prices prevailing in the market were well below any realistic assessment of the price that would be required to make it sensible for companies to replace their assets. If the analysis was right, it meant that at some point in the future the price of metals would simply have to rise in order to rebalance global supply and demand. The analysis could of course have been wrong, for example if it underestimated the potential for technology advancement, or a new source of demand. But assuming that it was correct, applying this implied metal price as a base case to each company in the sector made it possible to move beyond valuations based on current metal prices to estimate their long-term earnings potential. That was the investment case for buying metals stocks at that point in the cycle.

The performance of three of the stocks in which the fund invested in 1993 was mixed. In the case of the Australian company Comalco and the Swedish company Trelleborg, the share prices appreciated sharply soon after the purchases. In the case of Union Miniere, the result was less successful, although the shares did eventually rise strongly two years later. Note that the analysis in 1993 that suggested that metals prices needed to rise did not justify investing in all the metal companies. The focus was on those companies that careful analysis showed to be particularly cheap. In the case of some companies in the sector, there were genuine concerns about their solvency. The example once again underlined the need for diversification as a risk control measure. In the space of 18 months the exposure of the fund to metals shares rose from under 2 percent to 10 percent. In this case, unlike the financials and chemicals examples, the share prices did fall soon after the exposure was reduced.
Example 4: Pharmaceuticals and Political Risk
This example from the 1990s concerns pharmaceuticals, an industry with very different characteristics than the previous ones. By the early 1990s the pharmaceutical industry had been a favorite of investors for nearly a decade. Most pharmaceutical companies had been experiencing earnings per share (EPS) growth of 15 to 20 percent per annum. They typically combined high turnover growth with robust margins and very strong cash generation. They were widely seen as classic defensive stocks, impervious to recession. Although this was conventional wisdom, it was not without merit. By the early 1990s, however, the strengths of the big pharmaceutical companies were not only well understood, but fully discounted in their share prices. More importantly, the returns that the pharmaceutical companies were making were simply too high to be sustainable. Even in a business where patent protection can shield companies from competition for a number of years, the return on assets was well above what would normally be thought of as sustainable in an industry.
The headlines were again supportive, but it was not long before governments, as the major purchasers of prescription drugs, began to wake up to what was happening. At a time when recession was making fiscal deficits worse, the pharmaceutical companies became an obvious target for governments looking for new sources of revenue. Pharmaceutical companies had high profit margins, and an above average return on assets. The industry was not popular with the general public. The U.S. government, announcing the so-called Clinton reforms, was the highest profile country to threaten a raid on drug company profits. But the same phenomenon was also witnessed in Europe, Japan, and the rest of Southeast Asia.
In the face of this attack, share prices reacted in the way you would expect. The wonderful security traditionally associated with pharmaceutical companies dissipated. From being universally positive, securities analysts became almost universally negative instead. For a while the process became self-fulfilling. Each downward tick in share prices prompted more analysts to downgrade their future expectations. By the end of the process hardly any analyst in the world was positive on any pharmaceutical stock. In each case, a neutral or negative view was justified by reference to the lack of a drug pipeline, expiring patent protection, or both. Yet while for any individual company it was possible to believe that R&D might not produce any future winners, it was implausible to believe that all pharmaceutical companies as a group would fail to do so at the same time. Much more plausible was the view that stockbroking analysts had simply become too pessimistic after a period of poor share price performance.
What the Herd Thinks—Pharmaceuticals
- Generic Drug Stocks Plunge Amid Fears of Clinton’s War on Healthcare Costs (Wall Street Journal, February 1993)
- Embattled Drug Industry Makes Offer to Clinton (Wall Street Journal, May 1993)
- Reforms Hit European Drugs Industry (Financial Times, June 1993)
- Another Job Reduction Set in Drug Industry (Wall Street Journal, October 1993)
- Drug Industry Darkens View of Clinton Health Plan (Wall Street Journal, October 1993)
- “Litany of Disasters” for the International Drugs Industry (Financial Times, March 1994)
Moral: Buy during times of pessimism.
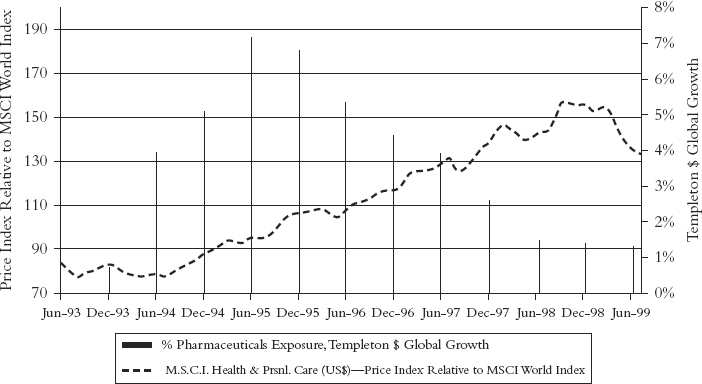
In these circumstances, avoiding what the crowd was doing and waiting until share prices had fully reflected all the bad news again proved fruitful. The fund’s analysis kept throwing up what seemed to be demonstrably undervalued securities. The managers did not know that Pharmacia, the Swedish company, was going to merge with Upjohn and Ciba-Geigy with Sandoz. Nor did they predict that the Wellcome Trust was going to be taken over by Glaxo. What the analysis did show was that Wellcome, for example, had a strong balance sheet with net cash, and earnings growth in excess of 8 percent for the foreseeable future. It had positive cash flow and a sustainable dividend in excess of 5 percent. Why would you not wish to invest in such a company? Only negative sentiment prevented it happening. It was a perfect example of how the short-term focus of most investors can drive security prices well away from their justified level, which is the assumption that underpins the Templeton philosophy of investment.
In practice, after the initial scare, drug company stocks rose steadily for around five years. The fund’s exposure to drug companies rose from under 1 percent to 7 percent over 18 months, before being gradually reduced. (See Figure 5.9.) Again it is evident that on the basis of perfect hindsight, the fund sold down its holdings too early. The important point is that the gains that were achieved stemmed directly from the quality of the analysis that went into the initial decision to buy, and a willingness not to be swayed by the prevailing opinion of both analysts and the media. The genius of John Templeton was to see that asking the right questions and having faith in the quality of your own analysis should, in the right hands, be sufficient to produce above average results.
Notes
1. Norman Berryessa and Eric Kirzner, Global Investing the Templeton Way (New York: Irwin Professional Publishing, 1993), 134.
2. Op cit, p 134.
3. See, for example, James Montier’s analysis of the subject in his books.
4. “In most cases, in assessing a company, we place more emphasis on future earnings rather than current earnings or assets. . . . The yardstick of value we have used most often is price relative to probable future earnings.” Berryessa and Kirzner, 134.
5. Op cit, 158.
6. “Such paragons do not, of course, exist.” Quoted in Templeton and Phillips, Investing the Templeton Way.
7. Compare this to Warren Buffett’s two rules of investment. “Rule One: Don’t lose money. Rule Two: Don’t forget Rule One.”
8. Sir Isaac Newton’s comment on the South Sea Bubble: “I can calculate the motion of heavenly bodies, but not the madness of people.”