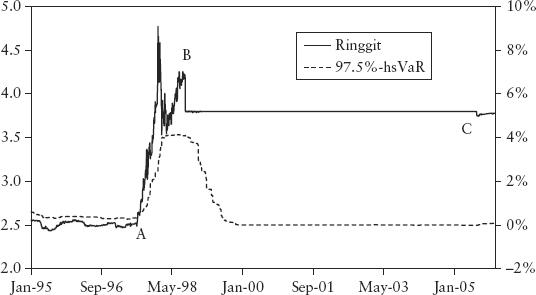
FIGURE 9.1 Currency Control of the Ringgit and the Impact on VaR (97.5% hsVaR)
Chapter 7 discussed the theoretical flaws of value at risk (VaR). Here we consider the practical limitations when implementing and using a VaR system. It is a novice’s mistake to assume that all identifiable missing risks can be put back into the VaR model. There are practical blind spots that are beyond the ability of VaR to cover.
Like any measurement device, VaR is a function of its information input. To the extent that a market event does not produce timely data for input to the VaR system, it follows that the risk for that event can never be captured. This is the case for some types of events that are not registered in prices, even though they may be anticipated by a knowledgeable risk manager.
The classic examples are currency controls and depegs. During the Asian currency crisis from 1997 to 1998, the Malaysian ringgit was attacked by currency speculators due to contagion from a currency crisis that started in Thailand. The Thai central bank devalued the baht on July 2, 1997, after which the ringgit depreciated from 2.52 to a high of 4.77 against the dollar, a whopping 47% fall. To fend off currency speculators, the Malaysian central bank imposed capital control in September 1998—pegging the ringgit to the dollar at 3.8. After seven years, the central bank officially lifted the peg on July 21, 2005. The ringgit is still semicontrolled to this day.
Figure 9.1 shows this chronology of events and the effects on VaR. At point A, VaR was late to register the onset of the devaluation even though traders and banks already knew the ringgit was under attack—the central bank was openly defending the ringgit, and the baht had already devalued. Currency control was imposed at point B, and for some time the price was untraded until point C when the peg was removed. The lesson is that VaR could not predict the imminent events at A, B, and C because these events are not reflected in prior prices even though market participants knew about the currency attacks and expected some extreme price breakouts.
FIGURE 9.1 Currency Control of the Ringgit and the Impact on VaR (97.5% hsVaR)
Had a risk manager relied solely on VaR, he would have detected the risk very late and rather abruptly, and might have lost his job. This highlights the importance of the subjective experience of risk professionals. If a depeg risk is anticipated subjectively, quantifying it can easily be done using stress testing. The market participants normally have some consensus (sometimes even an opinion poll) of the size of the revaluation if it happens. Hence, if a bank knows its position in a pegged currency (such as the HK dollar and the Chinese yuan) and the estimated magnitude of revaluation, it can conservatively estimate the potential loss, and take a suitable capital buffer or hedge out the risk.
Currency control is an example of sudden changes to the rules of the game; that is, to the way the market is traded. It causes an artificial segregation between onshore and offshore forward markets, which then behave differently because arbitragers cannot bring equilibrium to bear. Other examples are a government nationalizing a bank, causing the bank shares’ volatility to diminish, and a corporate takeover causing the target company’s shares to trade differently after the acquisition. In all these cases, a regime shift took place, after which the old data history is no longer reflective of future risk. The VaR forecast will be biased temporarily until the old data rolls out of the 250-day window.
VaR is only as good as its data. Since VaR is a point estimate, a single number result for the entire portfolio and the joint distribution, it is difficult to tell if it is tainted by erroneous data. Back testing is too crude for the diagnosis. The solution is prevention. As such, most banks invest substantially in data maintenance work, which consist of proper sourcing of data, capturing of end-of-day data (EOD data snapping), rates cleaning (removing bad points and filling up holes in the data set), and data interpolation.
We list below certain data problems that can undermine the integrity of the VaR system:
The above problems are by no means exhaustive. Since VaR is a regulatory reported number and is used for minimum capital charges for banks, it is ultimately one of the safeguards for the financial system. There is a moral obligation to be accurate.
We next consider model risks that are outside the scope of the VaR engine but that nevertheless affect the VaR result.
The VaR method is just a system to shock risk factors and to calculate the quantile from the resulting PL distribution. The translation from shifted prices to actual PL involves full revaluation (for simulated VaR) or derivation of Greek sensitivities (for parametric VaR). In both cases, we need to use a pricing model specific to the product. In a bank’s risk architecture (see Section 3.1) this component is stored in a pricing library and can be called from the VaR engine. An erroneous pricing model will result in a wrong (or at least inaccurate) VaR number. The error could be due to the wrong choice of pricing model, bad calibration,1 or a plain coding mistake.
More profoundly, the idea of correctness of pricing is sometimes not clear-cut except for vanilla products that use standard pricing models that are well accepted by the industry. This ambiguity gives rise to model risk. We use a definition of model risk adapted from Rebonato (2003): “Model risk is the risk of occurrence of a significant difference between the mark-to-model value of a complex and/or illiquid instrument and the price at which the same instrument is revealed to have traded in the market.” This difference will not exist if the efficient market hypothesis (EMH) holds true. This school of thought argues for the “law of one price” since any violation will be arbitraged away by pseudo-arbitragers. But when pseudo-arbitragers are hindered by cost concerns, illiquidity, or regulatory constraints, market prices can stray from model prices significantly.
A popular parable illustrates this: An illiquid option market has been observed at 20% volatility irregularly. After due analysis, traders decided that the theoretical price should be centered around 20% and used this as the mark-to-model price in the bank’s risk system. One day, there is a sudden market quote of 10% (perhaps from a customer), and the option trader quickly buys the option cheap (at 10%) and delta-hedges the position (with a hedge ratio calibrated at 20%). Which volatility (10% or 20%) should be used for risk pricing? The trader would naturally argue for 20% since this would let him realize an immediate profit for the “arbitrage.” On the other hand, a risk manager who strictly follows the mark-to-market accounting cookbook would mark the option at 10% and provision the profit. The two approaches have very different risk management implications. If the risk system is marked at 20%, there will be no difference in models used by traders and risk controllers, and the VaR will be very small, reflective of a delta-neutral position. On the other hand, if the risk system is marked at 10%, the position will appear to be not fully delta neutral—VaR will be material. The right approach depends on the subjective information and intelligence gathered by the prudent risk manager; that is, the nature of the counterparty, the consensus view on choice of models and price levels among professional players, and so on. The paper by Rebonato (2003) provides a topical discussion.
The VaR framework is based purely on past data and rests on the premise that past risk measurement is an unbiased predictor of future risk (i.e., the next day’s). The VaR method does not accommodate futuristic information even if available. Here I am referring to trading strategies—which are traders’ intentions, formalized and committed but not yet traded upon. VaR by definition does not include such things.
Suppose a trader holds $100 million in stocks and runs a 5% daily VaR. He has his stop-loss at 2% below current levels. Is his risk more than $5 million or just $2 million? His real risk is just $2 million assuming no loss from slippage when exiting positions (a reasonable assumption for very liquid markets). As a second example, consider the popular quant trading strategy called the constant proportion portfolio insurance (CPPI) scheme where the position is leveraged up when the portfolio gains, and deleveraged when the portfolio loses. There are well-defined models to execute such a trading strategy, often automatically buying and selling at predetermined levels. In a deep market, such a CPPI program can never lose money beyond a certain fixed amount. In other words, it has a floored payoff similar to a call option. Unfortunately, because VaR does not account for strategies, it will overlook the downside protection and overstate the risk.
This is less of a concern for regulatory capital since the overstatement of risk leads to a more conservative capital number. However, it does blunt the VaR risk measure as a monitoring tool. In particular, for program trading desks and hedge funds that use predetermined trigger levels for trading, the VaR number is completely misleading.
The solution is to use other tools. For CPPI-type strategies, one can use Monte Carlo methods to simulate the path dependence of the strategy and look at the PL distribution at a future horizon (say 10 days). For trades with predetermined stop losses, the PL distributions of such deals should be floored at the stop-loss levels. Both methods are compatible with the VaR approach and can be integrated into the VaR system.
Since a VaR system has many moving parts, it is open to manipulation and negligence. For example, a trader can game his VaR by altering the distribution of the desk’s PL to reflect a fixed VaR but with a much larger tail risk by taking on long-short market-neutral positions or by selling default swaps. The trader effectively gains from small frequent premiums or positive carry by taking on the long-term risk of an infrequent tail event (large loss).
This human or behavioral aspect is possibly the weakest link in the VaR system. It arises from the imbalance of power and skewed incentives in the way banks are organized. There is a principal-agent problem at play—decision making in banks is an arm-wrestle between risk and return, between risk managers and risk-takers. While the front office (trading) is a profit-generating center, risk management is often seen as a support function in most banks. Regulation calls for an independent reporting line for risk management to reduce the conflict of interest, but it is often the case that profit-generating functions are usually the sponsors of support functions.
A trader earns his profit-sharing bonus (often very high by earthly standards) by making profits and taking risks. The risk manager who controls risk on the other hand is almost never rewarded for stopping a bad deal or criticizing a suspicious position or profit. Risk management is about loss avoidance, and it is difficult to measure what has been avoided and hence has not occurred. This lopsided compensation encourages a culture that is not prudent. Traders have the incentive to paint a picture of low risk—stable profitability to top management. If a lower risk number can be achieved by gaming the technicalities of the risk engine, then this will allow more room for trading, since risk-taking activity is ultimately controlled by VaR limits.
On the other hand, the reward system in risk policing creates potential incentive for politics and lobbying. There is also a propensity to suppress bad news, the don’t rock the boat culture. When things do go wrong, it is convenient to blame the models, which few could understand anyway. We have seen this during the 2008 credit crisis where the popular press sensationalized the blame on quants for creating credit derivatives (similar to blaming all physicists for the atomic bomb).
Regulators are beginning to realize the importance of the risk culture in a bank. If critical risk information is not escalated to decision makers, even a state-of-the-art risk system is ineffective. In this respect, moral courage is an important trait of a risk controller. Justifiably most people will not put their jobs on the line unless they are financially and ethically very secure. And leaving banks to correct the power imbalance is impractical. We have seen how self-regulation and bad corporate governance led to the downfall of prestigious institutions in 2008.2 Perhaps the solution is to legislate and provide a whistle-blowing avenue for insiders. Another possible solution is to outsource the VaR reporting to an independent policing entity thereby creating a layer of protection against potential gaming and negligence.
In this chapter, we reviewed a few “risks” that cannot be captured by VaR. This is clearly not an exhaustive list. When faced with a modeling choice, the risk modeler should ask the question: Is this risk statistical in nature? That is, are the observations repeatable? If not, the risk should not be modeled using VaR. In fact, it is less confusing to call this uncertainty (see Knight’s uncertainty in Section 11.2). One can still model the uncertainty by applying (imaginative) assumptions, but the results may often be disconnected from reality. A better choice is to manage them outside VaR models.
1. Many advanced models used by banks today (such as the Heston model and the local volatility model, which attempt to account for the volatility smile effect) do not price options directly using observed volatilities. Rather, the implied volatility surface needs to be calibrated first. This is computationally complex.
2. For an insightful read of the corporate culture of Wall Street, please refer to “A colossal failure of commonsense: the inside story of the collapse of Lehman Brothers” by L.G. McDonald and P. Robinson (2009).