There are a lot of numbers in this book. As the late Professor David MacKay, the UK’s most influential writer on energy, said, adjectives aren’t enough when discussing the energy problem. But the numbers are mainly about the relative size of the problems and solutions discussed, and there is very little that is difficult or technical. Indeed, I think the only technical things are two related concepts: the difference between power and energy, and the daily solar power curve.
The difference between power and energy
Throughout this book, I write about two different ideas: the flow of power at a particular moment and the total amount of energy a machine/home/country uses over a certain time period. The flow of power is expressed in multiples of ‘kilowatts’(1,000 watts). The amount of energy is described in multiples of ‘kilowatt hours’ – 1 kilowatt sustained for one hour. So a machine which uses 3 kilowatts (a tumble dryer, say) consumes 3 kilowatt hours over the course of sixty minutes. For larger flows, the world uses a hierarchy of different units:
A kilowatt is 1,000 watts
A megawatt (MW) is 1,000 kilowatts
A gigawatt (GW) is 1,000 megawatts
A terawatt (TW) is 1,000 gigawatts
So a terawatt is a billion (a thousand million) kilowatts. And a terawatt hour (TWh) is a billion kilowatt hours.
Generally, talking about individuals or domestic homes, the right unit is a kilowatt of power. For example, over the course of the day the typical domestic home in Europe is using about a third of a kilowatt of electricity. The figure in Australia is about twice this number and in the US four times. (This isn’t the total energy consumption of these homes. There may be gas or oil for heating, and the residents may drive a car.) The appropriate unit for a country is gigawatts. For example, as I write this on a Sunday afternoon, German electricity production is about 42 gigawatts: i.e. during this hour Germany will use 42 GW hours of electricity. If this number stayed the same over the full day, then the total electricity used would be 42 GW x 24 or about 1,000 gigawatt hours. That’s one terawatt hour, the next unit up.
In the UK, the wholesale price of electricity is usually quoted in £ per megawatt hour. It is about £40 at present and less in the US and most of Europe. The retail price tends to be specified in pence per kilowatt hour. Today, a careful UK shopper can probably buy a package at around 11 pence a kilowatt hour; it is higher in the US and much lower than Germany. 11 pence per kilowatt hour is equivalent, by the way to £110 per megawatt hour. The average home in the UK uses about 3,000–4,000 kilowatt hours or 3–4 megawatt hours.
The daily solar power curve
On to the daily solar power curve. An array of solar panels sitting on the roof of a home might have a peak power of four kilowatts. That’s the maximum flow of electricity generated when the sun is shining on to the panels at midday in high summer. The energy output, even on a cloudless day, will be less in the early morning and late afternoon when the sun is lower in the sky and therefore the sun’s light energy is hitting the surface of the panel at an angle.
At night, the panels sit there idling. But during the midday hours in June and July, the production of these 4 kilowatt hours of panels is far greater than is needed by the house, which might be little more than one third of a kilowatt at that time. A house with a battery could store this excess but mostly the electricity flows out into the public grid, to be consumed by other households. The chart opposite shows the output of a 2.5 MW solar farm in the south of England on two very different days in April 2014. As you can see, its performance follows a completely smooth curve on April 15th – a constantly sunny day. The 21st of April, by contrast, started well but went downhill at around 10am; output then went up and down for a few hours until the sky turned black at around 3.30pm, when the electricity generated fell to almost nothing for an hour or so.
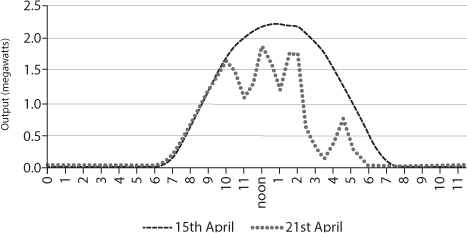
The output of electricity from a solar farm on two days in April 2014.
The other important things to note are that the length of the producing day is about seven hours in winter and seventeen hours in summer and that the peak on a completely sunny day in December is only about 60 per cent of the maximum in high summer. And, of course, the number of December days in the UK in which the sun shines continuously are few.
Over the course of a year, a solar panel in a good location in the southern part of the UK will produce about 11 per cent of its theoretical maximum (if the sun were shining right down on to it twenty-four hours a day). In other places around the world the average is probably 20 per cent or so and I use this global number at various places in the book.