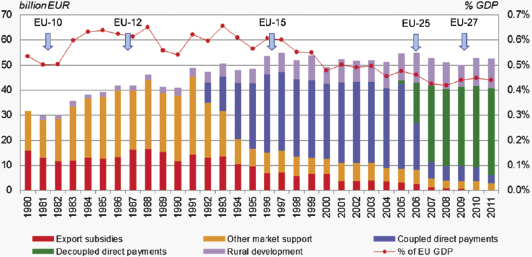
 Figure 1.7. CAP expenditure and reform path budget evolution; while overall (unadjusted) budget has increased, it is worth noting the changes in distribution of the main measures (specifically the increase in Direct Aids and Rural Development), as well as the significant increase in number of farm businesses, together with the enlargement of the EU.
Source: The graph is from the DG Agriculture and Rural Development, Agricultural Policy Analysis and Perspectives Unit © European Union (2013). http://ec.europa.eu/agriculture/cap-post-2013/graphs/index_en.htm (accessed 22 April 2014).
 Figure 2.1. The development of agronomic innovations and their relationship to average wheat yields in the United Kingdom. Red arrows show the recommended N : P : K fertiliser application (the fertiliser recommendation for wheat in kilograms per hectare) at that date, the actual amounts of fertiliser as N : P : K applied is shown with blue arrows (in thousand tonnes). Development of different wheat varieties are shown with black arrows, and new agronomic techniques are shown with green arrows. The graph demonstrates the agronomic development of the wheat crops and the innovations that have made dramatic grain yield increases possible.
Source: The wheat yield data were obtained from FAO. FAOSTAT (2012). Production, crops (data set). http://faostat.fao.org/ (accessed 22 April 2014). Fertiliser data were adapted from the data presented by Cooke (1977),46 and agronomic practice data were developed by W. Martindale as part of an OECD Cooperative Research Fellowship (2001).47

