
Invest energy in collecting metrics that help you make decisions.
—Eric Ries
3.2

THE TIME THIEF O’GRAM

Ladies and gents, I give you the Time Thief O’Gram.
Think of this tool as a spotlight, shining a light on a criminal lineup of the uncertainty across your organization.
The intent here is to look at metrics that reveal high risk. Common metrics such as the number of story points completed over a period of time (velocity), the number of bugs that escaped into production, or the number of deployments to production don’t reveal very much about risk.
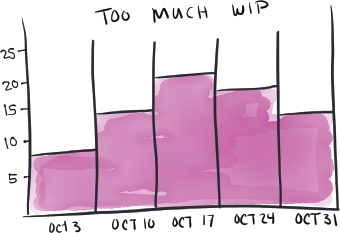
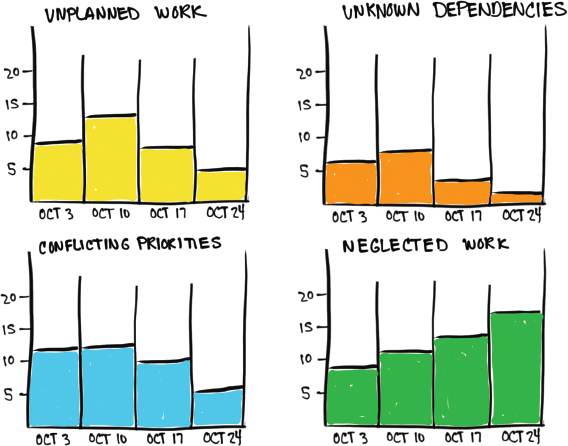
I’m going to argue here that time theft should be measured by the things that cause the problems in the first place and prevent your teams from delivering quality work quickly: too much WIP, unplanned work, neglected work, conflicting priorities, and unknown dependencies. These are the causes behind mediocre work done too slowly.
Each of these time thieves can be captured using work item types and card tags or a combination of both. If we can count these things and measure them, we can see both the stolen time and which thief stole it. It’s good to know if Thief Unplanned Work did it in the kitchen with the knife or if it was Thief Too Much WIP in the library with the candlestick. The Time Thief O’Gram shows who committed the crime and reveals how much was stolen.

Figure 45. The Original Time Thief O’Gram
The Time Thief O’Gram can be generated by tagging all your thieves on your kanban board. In this example, each thief has been color coded to make it even more visual. Once you have all these tagged, you can visualize, count, and track them week over week or month over month. In doing so, you can begin to see patterns and connections that would otherwise be scattered across multiple team boards.
We can look at the congregated Time Thief O’Gram (Figure 46) to compare thieves and their trends week over week to see the fluctuation in the amount of too much WIP across all the teams over time.

Figure 46. Congregated Time Thief O’Gram
There is, of course, a variety of ways to make time thievery visible. Figure 47 shows a balanced scorecard to help people determine which thieves to focus on first, which ones they are doing well with, and which ones are robbing them of time and predictability. Tracking and measuring these thieves puts people in a position to do something about them.

Figure 47. Balanced Scorecard
In my work, I am frequently asked about the best way to influence the CIO to use a DevOps/Lean/kanban/whatever approach. The CIOs I’ve talked to want two things: less risk and more predictability. The Time Thief O’Gram shows you that. It shows risk (*ahem* uncertainties) with respect to unplanned work, neglected work, conflicting priorities, and unknown dependencies. The Time Thief O’Gram also shows when WIP exceeds limits (based on the team’s own set WIP limits). Because WIP is a leading indicator, tracking WIP levels can signal problems early and warn you that things are going to take longer than expected. If predictability for delivering on time is important, then what would it be worth to your CIO to have this kind of transparency? Effective communication requires key messages from different sources. Look to the Time Thief O’Gram as one consistent source of important messages.
KEY TAKEAWAYS
