Chapter 25
Out, Bugs!
In This Chapter
![]() Configuring a project for debugging
Configuring a project for debugging
![]() Using Code::Blocks’ GNU debugger
Using Code::Blocks’ GNU debugger
![]() Stepping through a program
Stepping through a program
![]() Checking the values of variables
Checking the values of variables
![]() Inserting code to help you debug
Inserting code to help you debug
![]() Writing better error messages
Writing better error messages
Everyone writes buggy code. Not intentionally, of course. Even the best programmers get lazy or sloppy and do silly things. Stray semicolons, misplaced commas, and missing curly brackets happen to everyone. Fortunately, the compiler catches a lot of that crummy code. Fix the source code and recompile to deal with those annoying, typical bugs.
For deeper problems, flaws in logic, or maybe code boo-boos that aren’t easy to find, it helps to have a little assistance. That assistance comes in the form of a debugger, which can either be a separate utility through which you run your code or your own additions to the code that help you to see what’s gone wrong.
Code::Blocks Debugger
Code::Blocks integrates the GNU debugger, which is one of the most popular debuggers available. As long as you create a project by including debugging information, you can use the debugger from within Code::Blocks to peer into your code and, hopefully, discern its ills and ails.
Debugging setup
To debug a project, you need to set its target — the resulting program — to have debugging information included. The debugger uses that information to help you locate flaws in your code and generally to see how things work. This process works when you create a debugging target build for your code. Follow these steps:
1. Start a new project in Code::Blocks.
Choose File⇒New⇒Project.
2. Choose Console Application and click Go.
3. Choose C and click Next.
4. Type the project title, such as ex2501 for Exercise 25-1.
5. Click the Next button.
So far, these first few steps are the same as for creating any C language console program in Code::Blocks.
6. Place a check mark by the Create “Debug” Configuration.
The Debug setting allows a program to be created with special debugging information included.
7. Ensure that the item Create “Release” Configuration is also selected.
8. Click the Finish button.
The new project appears in Code::Blocks.
When you activate debugging for a project, as well as keeping the release configuration (refer to Step 7), you can use the Compiler toolbar to choose which version of the code is created, as shown in Figure 25-1. Use the View⇒Toolbars⇒Compiler command to show or hide that toolbar.
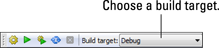
Figure 25-1: The Compiler toolbar.
When debugging, ensure that the Debug command is chosen as the build target. You cannot debug the code unless the debugging information is included in the final program.
 To create the final program when you’re finished debugging, choose the Release command from the Build Target menu. Though you could release a debugging version of your program, that information makes the final program larger. It also includes your source code so that anyone else can “debug” your program and see how it works.
Working the debugger
The debugger operates by examining your code as it runs, showing you what’s happening, both internally to the program as well as the output. If you’ve created a new Code::Blocks program with debugging information (see the preceding section), and you have code to debug, you’re ready to start.
I confess that the code shown in Listing 25-1 is purposefully riddled with bugs.
Listing 25-1: Debug Me!
#include <stdio.h>
#include <stdlib.h>
int main()
{
char loop;
puts("Presenting the alphabet:");
for(loop='A';loop<='Z';loop++);
putchar(loop);
return 0;
}
Exercise 25-1: Create a new project in Code::Blocks, one that has a Debug target build. Copy the source code from Listing 25-1 into the main.c file. Ensure that you copy the text exactly, including a mistake you may see at the end of Line 9. Build and run.
Because the Code::Blocks editor is smart, as are other programming editors, you may catch the erroneous semicolon at the end of Line 9 because the following line didn’t automatically indent. That’s a big clue, but it’s also something you may not notice, especially if you have 200 lines of code to look at. Regardless, the program’s output tells you something amiss. Here’s what I see:
Presenting the alphabet:
[
The alphabet doesn't show up, of course. Not only that, what's the [ character for? Time to debug!
Use the Debugger toolbar in Code::Blocks to help you wade into your code to see what’s fouled up. The Debugger toolbar is shown in Figure 25-2. To show or hide that toolbar, choose View⇒Toolbars⇒Debugger.
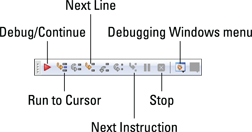
Figure 25-2: The Debugger toolbar.
Follow these steps to work through your code to see what’s wrong:
1. Click the cursor in your code right before the puts() statement.
That would be at Line 8.
2. Click the Run to Cursor button on the Debugging toolbar.
Refer to Figure 25-2 to identify which button represents the Run to Cursor command.
The program runs, but only up to the cursor’s location. The output window appears, and debugging information shows up in the logging panel at the bottom of the Code::Blocks window.
3. Click the Next Line button.
The puts() statement executes; its output appears.
4. Click the Next Line button again.
The for loop does its thing; no output.
5. Click the Next Line button again.
The putchar() function displays a random character on the screen.
Hopefully, at this point you look closer at your code and find the stray semicolon at the end of Line 9. You don’t need to exit or stop the debugger to fix it.
6. Remove the semicolon at the end of Line 9.
7. Click the Stop button to halt the debugger.
Refer to Figure 25-2 for the Stop button’s location.
Now you try to see whether you’ve fixed the problem, by stepping through the code again:
8. Click the mouse pointer to place the cursor right before the for statement at Line 9.
9. Save and rebuild your code.
10. Click the Run to Cursor button.
11. Click the Next Line button twice.
An A appears as output. Good.
12. Keep clicking the Next Line button to work through the for loop.
Or, if you’re satisfied that the code has been debugged:
13. Click the Stop button.
The program runs fine after you fix the stray semicolon. The random output character was due to the putchar() function at Line 10 being executed without the loop variable initialized. The character you see is whatever random garbage exists at the variable's location in memory. The later section Watching variables offers insight into how variable values can be examined by the debugger.
Setting a breakpoint
No one wants to step through 200 lines of source code to find a bug. Odds are that you have a good idea where the bug is, either by the program’s output or because it ran just five minutes ago, before you edited one particular section. If so, you know where you want to peek into operations. It’s at that place in your code that you set a debugging breakpoint.
A breakpoint is like a stop sign in your text. In fact, that’s the exact icon used by Code::Blocks, as shown in Figure 25-3. To set a breakpoint, click the mouse between the line number and the green line (or yellow line, if you haven’t saved yet). The Breakpoint icon appears.
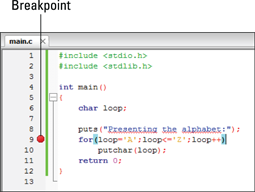
Figure 25-3: A breakpoint in the code.
To run your code to the breakpoint, click the Debug/Continue button on the Debugging toolbar (refer to Figure 25-2). The program works as you’ve intended, but then comes to a screeching halt at the breakpoint. From then on, you can step through the code or click the Debug/Continue button again to run the program until the next breakpoint — or to the current breakpoint when it’s in a loop.
Watching variables
Sometimes, the problem can’t be determined by merely watching program flow. Nope, you have to get down and dirty in memory and look at a variable’s value while the code runs. The Code::Block’s debugger allows you to watch any variable in a program, showing you that variable’s contents as the program runs. Listing 25-2 shows how that’s done:
Listing 25-2: Where Variables Lurk
#include <stdio.h>
#include <stdlib.h>
int main()
{
int x;
int *px;
px=&x;
for(x=0;x<10;x++)
printf("%d\n",*px);
return 0;
}
Exercise 25-2: Create a new Code::Blocks project with debugging active. Copy the source code from Listing 25-2 into the main.c file. Build and run. See whether it works.
It doesn’t, or it shouldn’t, unless you mistyped something. Time to debug! Follow these steps:
1. Click the mouse to place it at the start of Line 6, where the integer variable x is declared.
2. Click the Run to Cursor button on the Debugging toolbar.
3. Click the Debugging Windows button.
Refer to Figure 25-2 for the menu button’s location.
4. Choose the Watches command.
The Watches window appears, similar to the one shown in Figure 25-4, although you don’t yet see any variables.
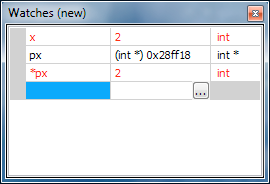
Figure 25-4: Monitoring variable values.
5. Click the mouse in the first blue box in the Watches window.
Click where you see the x in Figure 25-4.
6. Type x for variable x and press the Enter key.
7. Type px on the next line to examine the memory location stored in the px pointer. Press the Enter key.
8. Type *px on the third line to examine the contents of the memory location stored by pointer px. Press the Enter key.
You may see values appear for those variables, although the values are uninitialized. For example, on my screen, variable x holds the value 56, which is whatever random garbage appears in memory before the variable is assigned a value.
Until a variable is initialized, its contents are junk. That explains why the original output from Listing 25-1 showed a random character.
9. Click the Next Line button on the Debugging toolbar until the cursor is on Line 10, the start of the for loop.
As the value of pointer px is assigned to the memory location of variable x, pay heed to the Watches window. Instantly, you see a memory address appear by variable px, and you see the *px variable set equal to whatever value is assigned to variable x. The pointer has been initialized!
10. Click the Next Line button again.
As the for loop starts, it initializes the value of variable x. You see that value change in the Watches window, along with the value of *px. The value of px (the address of variable x) doesn't change.
11. Continue to step through the code to watch the values change.
12. Click the Stop button when you’re done.
I find that examining variables in memory is yet another good way to see what’s going on with your code. If the variables aren’t popping the way they should, you need to check the statements manipulating those variables.
Also, by examining pointers in memory, you can get a better idea of how pointers work.
Solving Problems by Using printf() and puts()
When I can't figure out what's going on with a program and I'm too lazy to run it through the debugger (or when I didn't include the debugging build option), I use the printf() and puts() functions as my debugging friends.
Documenting problems
Suppose that the code has a function that receives variable x, but somehow, variable x never shows up. I insert the following line into the code:
printf("value of 'x' at Line 125: %d\n",x);
This statement may actually appear in several places, tracing the value of variable x as it moves through my code. Granted, using the Watches window with the debugger on would be better (see the preceding section), but, sometimes, using printf() is a lot quicker.
If I'm not tracking a variable and I only want to know why a chunk of code isn't executing, I'll insert a puts() statement, something like this:
puts("You got to here");
When I see the preceding text in the output, I know that the code is being approached but still may not be executed. That’s when I talk through the code, look for a double-equal sign when I meant to use a single equal sign, and try out other tricks. (See Chapter 26.)
Though inserting a printf() or puts() statement into your code may not be as graceful as using a debugger, and it certainly doesn't say, "The problem is right here," it's not a bad work-around. Just remember to pull the statements back out again!
Saving comments for future-you
Another thing you can do to help fix undue woe is simply to describe the problem in the code by using comments. It may not fix the problem now, but for future-you looking at the code down the line, it’s a real help; it beats trying to discover the boo-boo all over again.
For example:
for(y=x+a;y<c;y++) /* this doesn't seem to work */
manipulate(y); /* Confirm that a is changing */
In this example, the note reminds future-me that the statements aren’t doing what they’re intended; plus, it offers future-me a suggestion on what to look for in a solution.
 You can also use comments to offer future-you suggestions on how to improve the code, things to tighten up, or new features you just don’t have time to add presently.
Improved Error Messages
One way you can better communicate your program’s goof-ups to users is to present better, more descriptive error messages. Though too many details can confuse users, too scant an error message can frustrate them. For example:
Unable to allocate 128K char buffer 'input' at location 0xFE3958
This error message may be ideal when you’re debugging the code, but a user will either ignore it or “Google it” to see how they can fix the problem.
The opposite type of error message is just as frustrating:
Error 1202
For heaven’s sake, don’t use numbers as error messages! Even if you’ve provided documentation, no user will appreciate it, especially when you can just as easily write
Not enough memory available
To help you craft better error messages, many C language functions — specifically, the file access functions — provide a consistent set of error values when a function fails. The error value is stored in the global variable errno, which your program can examine. Listing 25-3 provides sample source code.
Listing 25-3: Checking the errno Value
#include <stdio.h>
#include <stdlib.h>
#include <errno.h>
int main()
{
int e;
e = rename("blorfus","fragus");
if( e != 0 )
{
printf("Error! ");
switch(errno)
{
case EPERM:
puts("Operation not permitted");
break;
case ENOENT:
puts("File not found");
break;
case EACCES:
puts("Permission denied");
break;
case EROFS:
puts("Read only file");
break;
case ENAMETOOLONG:
puts("Filname is too long");
break;
default:
puts("Too ugly to describe");
}
exit(1);
}
puts("File renamed");
return 0;
}
To use the errno global variable, your code must include the errno.h header file, as shown in Line 3 of Listing 25-3. That header file also contains the definitions for all the constants used in the code; different definitions for just about every possible file error you could dream of.
The rename() function at Line 9 attempts to rename a file. I'm assuming that you don't have the file blorfus on your computer, so the function is designed to generate an error.
The return value of the rename() function is either 0 or -1, depending upon success or failure of the operation, respectively. When the value is -1, the global variable errno is set. The switch structure at Line 13 in Listing 25-3 plows through some errors that are possible when renaming a file. The error codes are defined as constants in the errno.h header file. Specific error messages are then displayed, based on the constant values that are defined.
Exercise 25-3: Type the source code from Listing 25-3 into a new project. Build and run to witness the error messages.
You can refine the error messages further, if you like. I kept the messages short in Listing 25-3 so that the text wouldn’t wrap in this book. For example, a better message than “Permission denied” is “The permissions for the file you’re trying to rename do not allow renaming. Consider resetting the file’s permissions and trying again.” That’s the kind of error message users like: It explains the problem and also offers a solution.
 Refer to Chapter 23 for more information on the
 rename() function.
 If the
 errno.h header file doesn't list all the constant definitions, look for an #include statement in that file, which references a second file that possibly contains the definitions.
Header files for the MinGW compiler are kept in the MinGW/include directory in Windows. You have to locate MinGW, which is usually in the Program Files folder on the main storage device, C:. On a Unix system, header files are typically found in the /usr/include directory.