Category scales extend the axis.ticks configuration for Cartesian charts with three additional properties, listed in the following table:
|
Property |
Value |
Description |
|
labels |
String |
The tick labels array. This overrides any previous declarations of this array. |
|
min |
String |
A string in axis.ticks.labels that represents the lower limit for the categorical data. |
|
max |
String |
A string in axis.ticks.labels that represents the upper limit for the categorical data. |
The axis.ticks.min and axis.ticks.max properties depend on the order that the strings appear in the axis.ticks.labels array. If the order is reversed, the result could be an empty chart.
This is the bar chart we created in Chapter 3, Chart.js – Quick Start, with the category labels in reverse order and with five bars instead of seven. The missing bars were removed by the axis.ticks.min and axis.ticks.max properties for category scales, which accept strings:
scales: {
     xAxes: [{ // category axis
         display: true,
         ticks: {
             labels: labels.reverse(), // overrides labels array
             min: 'South Pacific',
             max: 'North Atlantic'
         }
     }]
 }
The result is shown here. See the full code in Category/category-3-minmax.html:
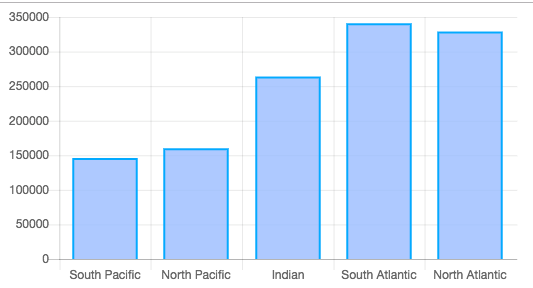
Code: Category/category-3-minmax.html.