Besides the data and label properties, each dataset object can contain a number of optional configuration properties. Most of them are used to configure fill and border colors and widths. They are briefly described in the following table:
|
Property |
Value |
Description |
|
data |
Number[] |
An array of numbers containing the data to display (this is mandatory) |
|
label |
String |
A label for the dataset |
|
backgroundColor |
String or String[] |
The fill color of the bar |
|
borderColor |
String or String[] |
The color of the border |
|
borderWidth |
Number or Number[] |
The width of the border |
|
hoverBackgroundColor |
String or String[] |
The fill when the mouse is over the bar |
|
hoverBorderColor |
String or String[] |
The border color when the mouse is over the bar |
|
hoverBorderWidth |
Number or Number[] |
The border width when the mouse is over the bar |
|
borderSkipped |
bottom, left, top, right |
Selects which edge of the bar with no border (the default is bottom for bar, and left for horizontalBar ) |
|
yAxisID and xAxisID |
An Axis ID (see Chapter 5, Scales and Grid Configuration) |
Used in axis configuration |
You can change the gray colored bars by adding color properties in each dataset object, or by configuring global defaults that affect all charts. The backgroundColor property receives a string containing a color specified in a legal CSS format. For example, if you want to have solid red bars, you can use the following formats:
- red
- rgb(255,0,0)
- rgba(100%,0,0,1)
- #ff0000, #f00
- hsl(0,100%,50%)
- hsla(0,100%,50%,1)
The borderColor property controls the color of the label icon. It also configures the color of the bars if the borderWidth is specified with a value greater than zero, as follows:
const dataObj = {
labels: labels,
datasets: [
{
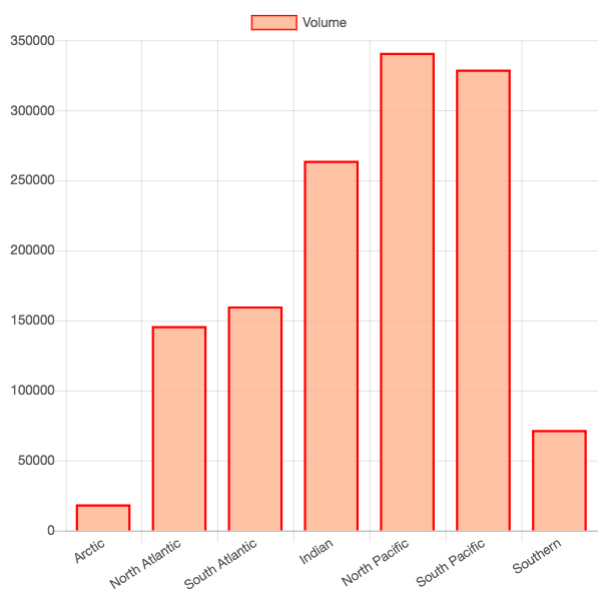
label: "Volume",
data: volumes,
borderWidth: 2,
backgroundColor: "hsla(20,100%,80%,0.8)",
borderColor: "hsla(0,100%,50%,1)"
}
]
}
new Chart("ocean-volume-bar-chart", {type: "bar", data: dataObj});
The preceding code should produce the result shown as follows. The full code is available at Pages/BarChart2.html: