Time scales extend the axis.ticks configuration for Cartesian charts with an additional property, listed here:
|
Property |
Value |
Description |
|
source |
auto (default), data (default, if data in point format), labels (default, if data in array format) |
Selects where to obtain the entries for the time scale. |
Additional tick configuration properties for time scales
The axis.ticks.source property allows you to select the source of the data for the time scale. If your dataset is a simple array and the dates are in the labels array, the default configuration will automatically get the dates from there. You can also set this property explicitly:
const dataset = [], labels = [];
 let date = moment('20181120');
 for(let i = 1; i <= 10; i+= 1) {
     labels.push(date);
     dataset.push(Math.random() * 10);
     date = moment(date)
            .add( Math.floor(Math.random() * 10)+1, 'days').calendar();
 }

 const dataObj = {
     labels: labels,
     datasets: [{
         data: dataset,
         backgroundColor: 'hsla(290,100%,45%,.5)'
     }]
 }

 new Chart("my-chart", { type: "bar", data: dataObj,
     options: {
         scales: {
             xAxes: [{
                 // ... other configuration not shown
                 ticks: { source: 'labels' }
             }]
         }
     }
 });
The result is shown here. See the full code in Time/time-3.html:
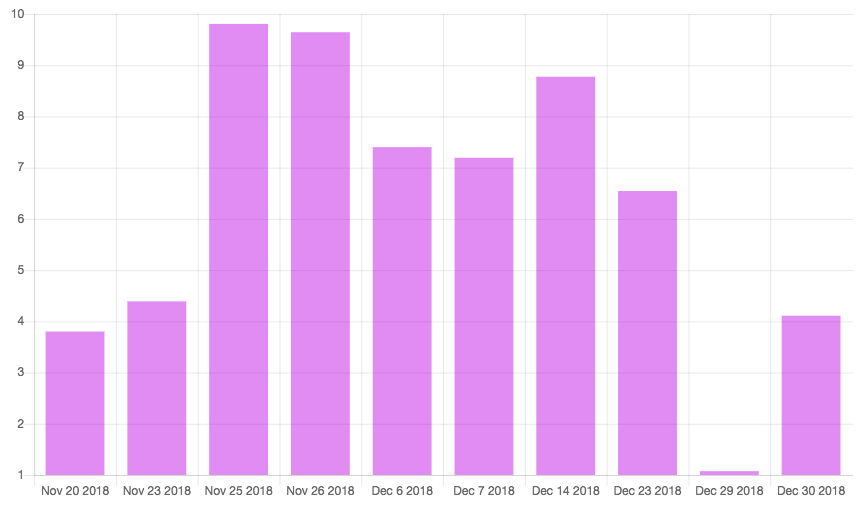
A bar chart with a time scale using the labels array as a source for the tick data. Code: Time/time-3.html.