CHAPTER SEVEN
Analyze Skills with Data and Insights
RECENTLY, KELLY HAD a conversation with the head of sales in one of the biggest tech companies in Silicon Valley. He wanted to know what his salespeople were learning, the skills they already had, and what they needed to do to close more deals. The bottom line was that he wanted his sales reps to make their quota so he could make his numbers. He wanted to help his company succeed and get the most out of his team. He also wanted to move his organization ahead of the curve and understand the learning and skills his salespeople needed for the future to continue to hit their numbers.
When he asked his team for help with his challenges and questions, he got a 50-page report with return-on-investment (ROI) calculations on learning programs that he didn’t believe—and that was painful to slog through. In his frustration, he threw the report in the garbage. It didn’t tell him what he wanted to know. Business leaders and CEOs face this predicament all the time: not getting the information they need about how learning makes teams more successful.
Maybe you have been in this sales leader’s position, where you have received complex calculations attempting to show the correlation or causation of how training impacts business results. Most likely you have been asked to fill out surveys—commonly called “smiley sheets”—that ask how you like a particular training class, but that in reality tell you only how people liked the instructor or the experience during an event. The most common and useless metric is totaling the number of hours and people who actually sit in a class, which tells you nothing. Think about it—if someone tells you that 36 of your salespeople completed an online ethics training course and 45 completed a class on sales methodology, what are you supposed to do with that information? That data doesn’t provide any valuable insight, but that’s the data most leaders get in companies today. It doesn’t tell the story business leaders and CEOs need to hear. Part of the problem is that generally we don’t understand employees’ skills gaps, and it’s difficult to measure what people actually learn. On top of that, it’s nearly impossible to correlate learning to the company’s success. Overall, leaders don’t even have a baseline to understand the skills of their teams, and so far, nothing has enlightened them. Yet things are changing.
As David often says, “The market wants to speak the language of skills, but we haven’t had a good way to do that until now.” With the help of data and analytics, we have the ability to understand our employees’ current skills as well as the ones they are building. Data can also tell us the level of engagement in learning, how to make the best learning investment decisions, and how learning can impact the business in significant ways. Thanks to personalization and technology, we now have the capability to access a tremendous amount of data regarding how people learn, what people learn, and how it affects their work. If we analyze the data, we can gain insights and use predictive analytics to look forward rather than always looking back.
Data can answer some of the critical questions leaders ask about training, such as:
• Should we be spending this much money to train our employees?
• Is it making a difference?
• Was it worth the investment?
• What are employees learning on their own time and on the job that we aren’t tracking?
In our Degreed research, we found that across 150 companies and over three million users, 68 percent of the content people consumed came not from their company’s LMS or other company sources. Instead it came from employees’ self-directed learning of all of the free, informal content that is available. More than two decades ago, Peter Senge wrote in his book The Fifth Discipline, “The only sustainable competitive advantage is an organization’s ability to learn faster than the competition.”1 While that still holds true, the data we use to show how, what, and when our employees learn is better than ever. If all leaders had this data at their fingertips, they might make different investment decisions about learning for their employees.
Corporate Learning as a Business
To further understand the value of data when it comes to learning strategy, it’s important to look at how some of the most successful companies think about corporate learning. Since corporate learning is often viewed as a cost center rather than a revenue-generating function, learning typically becomes more reactive than strategic. For example, one business leader asks for a conscious bias training program, another wants an agile development training program, and maybe a third asks for an onboarding program. So here are three discreet learning programs, but no larger learning strategy to frame what the business is trying to accomplish. A strong learning leader who understands business can develop an overall learning strategy based on data from several sources and show how this learning can impact both the business and employees in meaningful ways.
Many successful learning leaders do not start out in the learning field. Instead, they often come from marketing, product development, product management, technology, and corporate strategy. These leaders can take advantage of their business background to approach learning more as a business than as a support function or service and apply the principles of business to make learning a strategic competitive advantage.
Janice Burns, chief learning officer at MasterCard, is a good example of a successful learning leader who comes from a business background. Before making the move into learning, she spent time in MasterCard’s product, marketing, and customer satisfaction organizations. Similarly, Heather Kirkby moved from key roles in product management and marketing at Intuit to become vice president of Intuit’s talent development function. Beth Galetti, senior vice president of HR at Amazon, was originally CIO at FedEx before taking over the HR and learning function at Amazon. Finally, Tim Quinlan at Intel worked in sales, marketing, and technology before leading Intel’s digital learning strategy.
Susie Lee,2 head of global business solutions at Degreed, is another leader who started in business before moving to learning. In 2010, Lee moved internally from her role at Bank of America as vice president of product development and loyalty marketing to senior vice president of global learning product management and implementations.
When Lee first joined corporate learning, the organization was mired in process and order taking. It was very reactive and event driven. It was difficult to get data. Without good data it was impossible to analyze what was working and what wasn’t, or to even determine the type of metrics to analyze.
Lee noticed that by applying the principles of marketing and metrics to corporate learning, she was able to engage in meaningful conversations with business leaders about the learning patterns of employees.
Lee believes one of the smartest things companies can do is look at corporate learning more holistically and think of learning as a business. In the simplest form, that means understanding your customers. But who are your learning customers in a corporation? Often learning organizations think that their customers are the executives who are asking for the training for their teams. Or they think their customers are in the HR organization, since they are also asking for training programs, assuming they know what’s best for the employees. But, ultimately (and this is where the shift in mindset is important), the customers are your employees. They are the ones who are doing the learning. That’s why it’s even more important to focus on learning data to give you insights about what skills your employees have and what learning they need to get the skills they need. Then, it’s not about guesswork; instead, it’s about data showing what employees really need. This also happens in businesses where engineers think they know what the customer wants, but they haven’t actually ever talked to one of their customers. In learning, you need to look at data from your employees so that you know where the business is succeeding, or where you may need to make changes.
When learning programs or learning technologies are viewed as products rather than events, then strategy, marketing, and success metrics become second nature. According to Lee, you can use data in layers: first look at metrics and data at the product level, then at the program level, and then at the course level. Once you have data at those levels, you can use qualitative and quantitative measurement strategies to get insights that enable you to pivot and change what’s happening in the business and become more outcome driven.3
For example, say you have several content libraries in your learning ecosystem, and you’ve discovered through data that no one is accessing or engaging with one particular learning library—which costs your business about $300,000 a year. Armed with this information, you could make the case through data insights to either divest in this learning product, to invest in different content, or to realize overall cost savings.
In another example, imagine your company has developed a learning program for building management skills, but your qualitative and quantitative research or data tells you the program or product is not making a difference. Just like if you are marketing a product, you would get customer input and make changes based on that input to get the results that you want. Customer feedback as one data point provides valuable insights for companies and indicates what you need to change and how you need to pivot the business to motivate and change your employees’ behavior.
Lee added, “Too often internal technology projects, when not managed as a product or run like a business, are influenced by people’s opinions instead of reality.” For example, at one large corporation there was an initiative to invest in refreshing dozens of SharePoint sites for learning when the data indicated that the usage was really low. “If you make the case with data, it is a pretty straightforward business decision that you wouldn’t spend the money—the SharePoint sites aren’t being used so don’t invest to recreate them.”4
Measuring What Matters with the Learning Analytics Model
As Lee discovered, data insights enabled her to have meaningful conversations with leaders about the impact of employee learning. The smartest companies succeed using data and insights to tell a compelling story. Many companies apply the principles of the learning analytics model (LAM) to acquire information. This model shows you how to:
• Collect the right learning data
• Analyze that data to find powerful insights
• Tell a compelling story about learning at your company to help gain a competitive advantage
• Provide actionable outcomes using this data
The model provides business outcomes based on those insights, which may lead to actions or recommendations to either change or further develop the learning process.
Once you collect all the relevant data, it’s time for analysis. The goal of analyzing the learning data is to help you figure out what it all means and get the answers you’re looking for. Analyzing data is part science and part art, and it is one of the most in-demand skills in business today having grown over 650 percent since 2012.5 Overall, being able to analyze data will become more important for everyone moving forward.
Data can be collected at a variety of levels to tell a complete learning story. For example, you can collect data at the industry level, the company level, the organizational level, and the individual (employee) level. There are several inputs across each of these levels that you can use to help tell the learning story:
Industry Level
What are the most needed skills in the industry? What are the skills of our competitors, and how do we match up? Collect data through industry benchmark studies and analyst reports. For example, say you are a growing cybersecurity company and you discover through a Cybersecurity Ventures report that jobs are in high demand, and they predict there will be 3.5 million unfilled cybersecurity positions by 2021. That would inform your business strategy and how you will need to compete for talent in the future.
Company Level
What are the most important strategic drivers and metrics in the business? For example, say your customers’ requests for expertise on data insights keeps growing. So, to stay competitive, you’ve taken that input and decided to invest in data experts by planning to hire or develop 5,000 data scientists during the next five years.
Organizational/Team Level
What skills do your people have and what skills do your people need to stay competitive? Collect data through assessments (skill self-assessments, 360 assessments, peer assessments, manager assessments), feedback, learning goals, adaptive learning, and voice-of-the-customer. For example, suppose you lead a product management team at your company, and you discover through self-assessments and manager assessments that prioritization is a critical skill for your product managers. If some of your team members are not strong in that skill and you think it’s important, you can provide feedback to those employees so they can focus on that skill as a learning goal.
Individual Level
How and what are your employees learning? What skills do they have and need to build? Collect data about both formal and informal learning as well as skills gaps through research, surveys, learning technology platform analytics, Google Analytics, machine learning data, and voice-of-the-customer. Just knowing what people are learning and what skills they are building can be incredibly powerful. At Degreed, we track this data regularly using our own product to see what skills we have within the organization. Then, when there is an internal opening that requires those skills, we have a good idea who is interested because we have the data. Employees are excited when they see opportunities tied to the new learning and skills they are developing.
Analyze Data: Industry Level
At the industry level, you can look at data a few different ways. Let’s take as an example the World Economic Forum 2018 The Future of Jobs report,6 which highlights skills disruption data by country and industry. The report states that 35 percent of core skills will be disrupted in the workforce between 2015 and 2020, as illustrated in figure 7.1. It also indicates that around the world, 210 million people will change their occupation by 2030. So how can you analyze this data to connect with your own data? First, look at what’s happening across similar companies in your industry, and then look at data across geographies. For example, if you are in the financial services industry in Italy, the data shows 43 percent skills disruption in your industry, and 48 percent skills disruption in your country. Those are two important data points to include in your analysis of how your organization measures up in terms of skills.
Figure 7.17 The Future of Jobs Report, World Economic Forum 2018
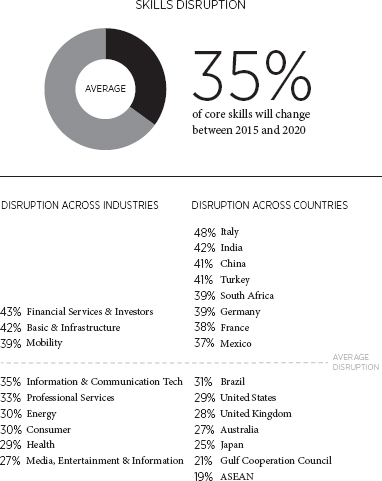
According to Maksim Ovsyannikov, former vice president of product at Degreed, “Skills are not only becoming the currency of learning, but also an economic indicator, and the very language of workforce analytics.”8 Figure 7.2 illustrates the contrast between the most abundant skills in the San Francisco Bay Area compared to the most scarce skills.
Figure 7.29 Most Abundant and Scarce Skills in the San Franciso Bay Area
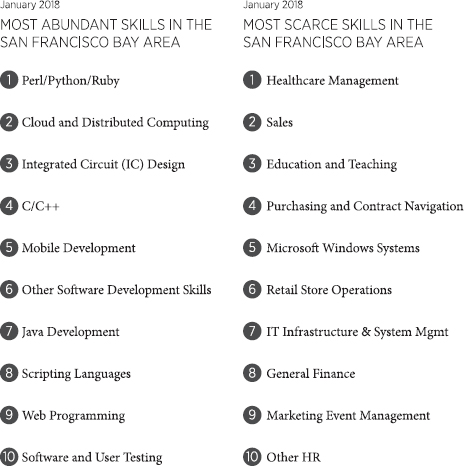
The data in figure 7.2 from LinkedIn shows there is an abundance of software developers in the San Francisco Bay Area, and that in fact the top 10 skills are all technology related. Then, if you look at the skills gaps, the data shows that we need more people with healthcare and sales skills as well as education and marketing skills. So, if you are an employer, you might realize that it’s going to be tougher to recruit for those skills that are most scarce. If you are an individual, you may be excited to see that if you learn skills in marketing event management, there are job opportunities in San Francisco for people with those skills. Overall, the goal is to collect as much industry data as possible from a variety of sources to identify patterns in your own organization.
Analyze Data: Company Level
When analyzing data at the company level, it helps to get a good sense of how learning is impacting your company overall. Metrics like productivity, job effectiveness, and internal career progression provide a greater insight into how learning influences your company. If one of your company’s goals is to make learning a competitive advantage by attracting new talent or keeping the great talent you already have, this data will help you tell a compelling story.
In August 2017, Janice Burns,10 MasterCard’s chief learning officer, conducted an impact study involving around 1,000 MasterCard employees to gather data for analysis at the company level. The data indicated that active users of MasterCard’s new learning platform were more likely to say they’re more productive (54 percent), more effective in their job or role (51 percent), and more invested in growing their careers (46 percent) than non-users. Burns was also able to tell from the data that active users were 33 percent more likely to say they’re engaged at work than non-users, and 80 percent more likely to say they’re more collaborative. These metrics reflect the progress and feedback directly from MasterCard learners. This is the kind of data that can help tell the learning story at a company level.
Again, this data points to insights that are valuable in developing an overall talent strategy. Burns uses these metrics on an ongoing basis to inform her talent strategy. This is an agile way for her to respond to any changes initiated by employees, as it enables her to adjust the tactics in her strategy.
Analyze Data: Organizational/Team Level
Analyzing data at the organizational level involves looking for patterns across similar job functions. The goal here is to narrow your focus on data that will be interesting not only to the company, but specifically to business leaders across different departments, such as the head of engineering or the head of sales. For example, if you analyze data from the engineering organization, it helps that leader design a talent strategy for engineers, which will probably differ from the talent strategy designed for salespeople.
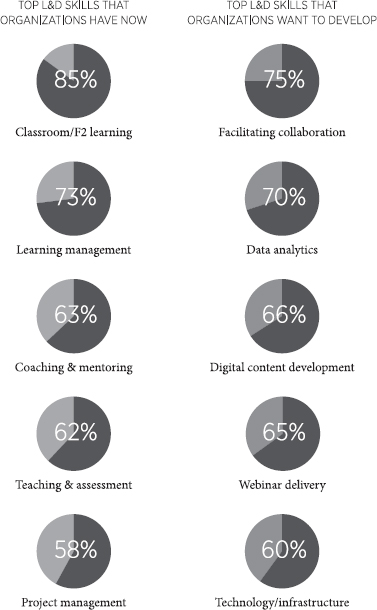
Figure 7.3 shows an organizational-level view of data for a specific function, in this case the corporate learning function. This data provides leaders of learning organizations with information about the types of skills their employees already have as well as the ones they will need for the future.
The organizational level involves looking at trends and patterns in a funnel, first starting with macro data and then narrowing that focus to your team or organization. For example, when it comes to your learning team, the data might show that you have a high number of project managers and instructional designers, but very few technologists or data analysts. This data provides you with intelligence on the skills your team has versus the skills your team needs.
When applied to an engineering team, the data may show that 80 percent of your developers are web developers, but that only 20 percent have mobile development skills. If your company strategy is moving toward mobile, then you now have the data that tells you the mix needs to change. This is a valuable insight for business leaders who are planning their business and talent strategy for the future.
Figure 7.311 Top L&D Skills That Organizations Have And Want
At the team level, it’s essential that you know the skills your people already have. It’s amazing that most leaders don’t have this insight beyond what their employees are hired to do. When Kelly was leading the learning function at LinkedIn, she wanted to develop a brand for the organization, and design marketing campaigns for their learning products. As it happened, there was a person in Kelly’s organization, Nawal Fakhoury, who had a degree in Public Relations as well as experience creating a brand for learning products at a prior company. Kelly only became aware of this skill set during a conversation, since Nawal had been hired to lead onboarding for LinkedIn. In this case, Nawal was thrilled to consult on this initiative and provide her skills and expertise to the team.
If there was a good way to know all the skills of the people in your team or organization, it would be much easier to give your talent new opportunities to grow and develop.
Analyze Data: Individual Level
Data at the individual level enables you to gain a clear picture of the type of learning your employees are engaged in. In the past, it was possible to gain insight into only a fraction of what people were learning. Thanks to new learning technology, it is now easier to obtain data on learning both formally and informally, inside and outside your company. The goal of analyzing data at the individual level is to use the data to tell the story of the type of content being consumed by employees, as well as what they are learning.
In 2017, Degreed began work with NASA’s Jet Propulsion Laboratory (JPL). JPL is a unique national research facility that carries out robotic space and Earth science missions. According to Tony Gagliardo, the company’s head of learning, JPL is responsible for sending astronauts to the moon and also manages NASA’s Deep Space Network, a worldwide system of antennas that communicates with interplanetary spacecraft. It has some of the world’s most advanced technology and brightest minds, but even these rocket scientists need to be continually learning. Gagliardo said, “We recognize the shift is already under way in the technology, skills, and employee demographic that will lead us into the future, so we needed to shift our learning strategy and technology ecosystem as well.”12
They wanted to understand what their scientists were learning to remain innovative and up-to-date on the latest technologies. To do that, they had to collect meaningful data about what their employees were doing and figure out ways to measure learning and skills.
Let’s look at some answers to the questions posed by JPL. First: Are people learning? One of the most important attributes people can have, regardless of where they work, is learning agility and the desire to continuously learn. When you are looking at data you’ve gathered, take time to focus on the level of learning engagement. Can you measure whether people in your company are actually engaged in learning? Are they accessing the content and the systems that you’ve put in place for learning? If so, how often do they engage? Analyzing data based on weekly active users, monthly active users, activations, or logins to learning systems is one way to set a baseline engagement metric.
Second: How are people learning? Are they learning from going to conferences, reading books, or recommending content to peers? Are they involved in team learning programs or projects? The insights here can help you understand where you can make smart learning investments and where you might need to make some changes. For example, if the data tells you that all your engineers are learning from Pluralsight’s content library, but your company only offers content from Lynda.com, you may want to change the investment portfolio for learning. Or, you may find that your employees are learning from such a wide variety of sources that it makes more sense to allocate money per employee to learn what they want, and then track it. That way you can continue to collect data to help you understand how they are learning.
The final two questions are: What skills do people have? and What skills do they need? Understanding what skills your people have versus what skills people need is critically important for companies analyzing their talent. Companies need to know if they have people with the skills that will take them into the future. For example, a few years ago in the engineering organization at Yahoo!, there was a struggle to find mobile developers because tech companies were snapping up as many as they could hire. It resulted in a scramble to develop the engineers that they had, because hiring had become so difficult. If you could predict the type of skills your engineers would need for the future, you could start to help them develop those skills early rather than try to compete for talent with other companies later.
Wrong Data Can Be Deadly
However, even with all that data at hand, we do have to be a bit cautious since showing wrong data can be deadly. At a tech company Kelly worked at, the HR team came into a business review with some data about the talent in their company. Immediately, the VP of engineering said, “Those numbers aren’t right for my organization.” Once that comment was out there, other executives began to question the data about their organization as well. Dani Johnson, former analyst with Bersin by Deloitte, says, “Data can either build credibility or it can kill it. We need to understand how [learning] efforts are affecting performance, and we should be able to speak to it and adapt as necessary. If everyone else is talking about product throughput or turnover and we are talking about learner satisfaction, there is disconnect.”13 Especially for data-driven leaders, if someone can point out errors in the data you show, you won’t get to tell the story behind the data. It just won’t be credible.
Janice Burns, chief learning officer at MasterCard, believes we are still on a journey with learning analytics. She suggests that “we can make some progress by building a robust technology ecosystem to bring fragmented learning data together.” Burns notes that some of the issues with data analytics are still being uncovered and that privacy laws and the fact that more and more questions are being asked about how we use the data could be one challenge.
But data is going to be key moving forward. She said, “You not only need a learning strategy, but a data strategy and technology strategy as well. And to get insights you need other types of data—not only learning data, but talent data and acquisition data. The key is to tell a story and pull it all together.”
Telling the Learning Story at Your Company
So why would you want to hear the learning story at your company? If you are used to seeing reports of who completed the ethics compliance training last month, it’s a snooze. You can’t really be expected to care and, frankly, most companies only care about who took compliance training when a lawsuit comes around.
But, if you look at learning in a different way—as a way to understand the most competent person to assign to a particular project, or as a means of finding out which team members are actively learning the new skills really needed by your organization—the learning becomes a powerful part of your talent and business strategy.
Even better, with the help of the right data, you can tell a compelling learning story rather than just provide a spreadsheet of endless data. Stories are a great way to engage an audience. They provide a vehicle to transmit impactful messages. According to leadership consultant Kristi Hedges, “Stories grab us. They take us in, transport us, and allow us to live vicariously and visually through another’s experience.” In addition, “Shared stories accelerate interpersonal connection. Learning to tell stories to capture, direct, and sustain the attention of others is a key leadership skill.”14 Storytelling can be a compelling way to tell the learning story and really share your understanding of the degree of talent in your organization.