I stood in front of my 8:30 am “Statistics in Psychology” class. It was the beginning of the school year, and I had just become a professor, in the loosest sense of the word “professor.” I was still a 25-year-old graduate student, but the psychology department “politely encouraged” us to teach classes to the undergraduates, many of whom were only a few years my junior.
Some of my students were trembling in fear, if not of me, then of the class itself. Most psychology majors cite a desire to work with people, not numbers, and yet here they all were in a class about numbers. Psych Stats had the reputation for being a “major killer,” in that it was a required course, but a hard class to pass. Some people solved the problem by switching majors. I was going to need a good opener.
“It’s a good thing you all came to the first day of class, because today I’m going to teach you the only thing that you need to know about statistics.” I hadn’t even mentioned my name. “Can I borrow a quarter?”
The students, hearing that the graybeard at the front of the class was about to reveal the mysteries of the universe, had all grabbed their pens and notebooks and waited to write down the wisdom that I was about to impart. They all did a double-take when I asked for the quarter. Someone in the front row happened to have one, and I thanked her for it. I held it up to the class and said with the conviction of a magician who already has the second coin up his sleeve, “This is a fair coin. By a fair coin, I mean that it isn’t a trick coin. It’s not a two-headed coin. It’s not weighted in any way. I don’t have any skill in making it land on one side or the other. If I were to flip it, it is exactly a 50/50 chance that it would land on heads or tails.” They nodded. A few of them started writing that down.
I then gave the first quiz of the class. “How many of you believe me?”
There were some puzzled looks throughout the room, but most of the hands went up, signaling that they believed the madman at the front of the class. They were humoring me.
“Why? Why do you believe me?” I already knew the answer to this one: because when there is a madman yelling things at you, you nod your head and hope that he will calm down. Also, I was the professor.
After some murmuring, some brave soul put up her hand and said the two words that I had hoped to hear. “Prove it.” The game was afoot.
“How shall I prove it to you?”
“Well, I guess flip it a few times.”
I obliged them. Heads. Tails. Tails. Tails. Heads. Tails.
“Four tails, two heads. That’s not 50/50! So, am I a liar?”
More confused nodding for the madman.
Another brave soul, “Maybe flip it some more?” Not bad for 8:37 am.
I suggested that they imagine that I had flipped the coin 100 more times and in those 100 flips, there had been 50 heads and 50 tails. I asked who now believed me that this coin was a fair one. This time, all the hands went into the air confidently. Alright, Socrates, time to throw a curveball.
“What if it had been 51/49, who still believes me? If you do, keep your hand up.” They all stayed up.
“52/48?”
“53/47?”
“55/45?” Some hands started falling. A few other hands looked to be having an argument about probability with the arms supporting them.
“60/40?” There was a sound as of a small rushing wind as half of the hands in the class fell into the laps of the students who had brought them.
“65/35?” Only two or three brave souls remained.
“70/30?” The last of the resistance had fallen.
Then I said something only a clinical psychologist could say in a stats class. “Let’s talk about how that made you feel.” I summarized my observations to the students of what I had seen in their behavior. The quivering arms. The crisis of confidence in my truth-telling abilities when the split in those 100 coin flips hit 60/40. The fact that at one point, those arms had been raised with the confidence of the Statue of Liberty. “Think about the moment that you personally decided to put your hand down, when you went from believing that it was a fair coin to believing that it was not a fair coin. What was your thought process?”
They were into it. A few hands went up and I asked them to tell their stories of disbelief. I challenged them. “Is it possible that a fair coin could come up heads 70 percent of the time?” Everyone agreed that it was possible, but one student finally put it into words.
“Yeah, but there came a point where it just got too weird.”
I paused for dramatic effect. “If you can hold on to that moment, the moment where you went from believing me to doubting me to not believing me, that moment where it got too weird, you can understand the entirety of statistics.”
* * *
Readers who remember their intro stats classes will recognize my live demonstration of null hypothesis testing, but readers who don’t know what “null hypothesis testing” means will hopefully grasp the basic idea. Sure, sometimes weird things happen randomly, but there’s a point where the line is crossed and we no longer give randomness the benefit of the doubt. Statistics is just a way of formally calculating where that line is.
I taught Psych Stats a few times, and each time, this demonstration with the borrowed quarter and the raised hands was my leadoff. After that, I switched from madman mode into acting like a proper professor. I took attendance, horribly mangled a few names, introduced myself, passed out the syllabus, told them when and where my office hours would be, and because this happened in all of my classes, assured them that they were allowed to bring in knitting to work on during class. It’s amazing how much knitting goes on in American college classrooms. People need a way to manage anxiety. For some people, that’s making a scarf while someone drones on about standard deviations.
Even after I assured them about the knitting, there was still plenty of anxiety hanging in the air. People’s career plans were figuratively in my hands. I needed a second act. Thankfully, I had another question lined up that blessedly made me sound a little more normal. “Who here speaks a language other than English?” The hands started raising, again, some confidently, some tentatively. I clarified, “And before you put your hands up, I mean that you speak the language well enough that if I were to switch into that language, it might be five minutes before you even noticed.” The tentative seemed relieved to be able to put their hands down.
I find bilingualism amazing, mostly because I’ve never been able to pick up another language for myself, a fact that my Russian-speaking wife gently reminds me of every now and then. Four years of high school Latin has left me well-equipped to translate state mottos and things that people say when they are trying to be pretentious, but not much else. In some sense, we all speak multiple languages, whether they are formal languages (French, Gujarati) or the technical “language” that goes along with a job or a hobby. Still, I always made it a point to ask the students who raised their hands what languages they knew, for no other reason that I think that it’s neat.
Continuing on though, I relaxed my standards a little bit. I then asked how many people in the room knew a language well enough that if they were suddenly dropped into the middle of a country where that language was spoken, they could fake it for a week and not die. Most of the hands went up. I asked how many of them were counting on what they learned in their high school Spanish classes and most of them nodded. I told them that my class had much the same goal. The psychology department wasn’t expecting these students to walk out of that class being able to discuss the finer points of a Type I vs. a Type III Sum of Squares. The department knew that I would be teaching them ex nihilo. The point of the class was to establish a base vocabulary around the subject.
If they wanted to major in psychology, they’d at least need to be able to pick up a scientific journal article and read it. Even if they didn’t understand what hierarchical linear modeling was, they might at least understand the basics of a regression line or a t-test and why good research methodology was important. If nothing else, my belief was that if I stopped someone from blindly accepting some insane conspiracy theory they read on the internet before someone offered proof, I had done my job. I view this chapter much the same way.
This is…The Math Chapter!
Wait. Just hear me out before you start thumbing ahead to Chapter 3. I promise this won’t hurt. (Though I say that in the same way the nurse promises you the shot won’t hurt. It’s a lie, but a helpful one. It hurts for a split second, but not nearly as much as you had imagined and not nearly as much as the flu it prevents you from getting.) My goal in this chapter is not that you’ll be able to run park-adjustment calculations for Coors Field in your head. (No one has figured out Coors Field yet.) My goal is to introduce a few basic concepts. If you’re the sort of person who wants to know more, there are plenty of options out there to pursue that. This chapter is meant as a starter course in some basic math concepts that are foundational to sabermetrics.
WARNING! GORY MATHEMATICAL DETAILS AHEAD!
* * *
In the last chapter, we talked about giving credit to a player for the things that he did, with the odd idea that we were going to give him credit for fractions of runs, rather than whole runs. How can a player score half a run?
A baseball game is more like 18 (sometimes more!) mini-games called half-innings. Each team plays nine of them on offense and nine on defense. A half-inning—for the defense—is a race to get three outs before any (more) runners score. In a half-inning of baseball, there are two factors that most shape how many runs will be scored before the game resets: how many outs there are and where the runners are. Once the defense gets those three outs, the game resets itself and goes back to no outs and no runners.
Weird things do happen in baseball. There are cases where a team loads the bases with no outs and somehow doesn’t score. There are cases where a team is facing a two-outs, no-one-on-base scenario and somehow comes up with four runs before the third out is recorded. Given a choice between those two scenarios before I know the outcome though, I know which one I’d take. In statistical terms, we’re talking about “expected value” and in baseball (and life) it’s one of the most important concepts to understand.
Suppose I offered you a chance to bet on a coin flip. You lay a dollar down, and call the flip in the air. If you call it correctly, you walk away with three dollars. If you are wrong, you walk away with nothing. Should you pay the one dollar it costs to make that bet? At the moment that you are deciding whether to make that bet, you have no idea what the outcome will be. Assuming it really is a fair coin, you have a 50 percent chance of walking away with nothing, but you also have a 50 percent chance of walking away with three dollars. After you choose to make the bet, but before you know the outcome, expected value says that the bet is worth $1.50 (50 percent of three dollars).
Now, let’s say that I change the rules. You still need to lay down a dollar to play the game, but to win you need to call two coin flips correctly and the prize is still only three dollars. The potential outcomes (no money or three dollars) haven’t changed, but the chances of winning are now lower (25 percent). Your expected value is also lower (25 percent of $3.00 is 75 cents).
A statistician would call the first bet a good wager even though you might lose your money on an individual coin toss. The expected value ($1.50) is higher than the cost of the bet ($1.00). In an ideal world, you should sit there all day and bet dollar after dollar on my game. At the end of the day, you’d be rich. The second bet is a bad idea because the expected value of 75 cents is less than the dollar it costs to play the game. You might win one round, but if you played that game over and over again, you would eventually lose all your money.
This brings us to our first rule of probabilistic thinking: When you have to make a choice between two strategies before you know the outcome, pick the one with the highest (or the least negative) expected value. An individual decision might end up being wrong, but if you make a bunch of these probabilistic decisions over time, you will end up ahead.
In baseball, we see these sorts of probabilistic decisions all the time. Should the third-base coach send the runner or hold him? Should the shortstop fielding a ground ball take the sure out at first that allows the runner to get to third or should he take a chance on getting the lead runner? Should the manager pinch hit here? Should a general manager trade the three best prospects in the organization for an ace starter in the middle of a pennant race? Eventually the third-base coach, shortstop, manager, and general manager will have to make those decisions, and shortly thereafter, they’ll find out whether their decisions “worked” or not.
While it’s not always easy to figure out the expected value on a decision, expected value should always be the guiding principle. There’s a small problem though, because while “always pick the highest expected value” is easy to say, there are all sorts of pitfalls in actually doing it. As an example, how would you approach this problem?
An outbreak of a particularly nasty infectious disease has been reported in a remote town in Oklahoma. The disease is highly contagious and deadly if left untreated, and it’s likely that all 100 residents of the town are infected. The town is put under quarantine. There is a well-known medication for the disease that works in about 60 percent of cases. Unfortunately, 40 percent of the people who take the medication still die. It’s not great, but it’s the best that’s available.
There is a second, experimental medication that has not yet been tested in humans, but has been developed by a well-respected pharmaceutical researcher. It cured 100 percent of the lab rats in tests, but there hasn’t been time to study the drug’s effects on humans. The researcher believes that there is a 50 percent chance that the experimental medication would work and cure everyone and a 50 percent chance that it would have no effect and everyone would die. When the public health workers parachute into this town in their hazmat suits, should they bring the well-known or the experimental medication with them? From an expected value point of view, there is no question. The well-known drug would save 60 lives. The experimental drug has an equal chance of curing everyone or killing everyone, so it has an expected value of 50 lives saved. Sixty is more than 50. Expected value would vote for the well-known drug.
Even knowing that, I’d wager that plenty of readers are still tempted to pick the experimental drug. The idea of saving everyone probably has some appeal. One could make the case that using the well-known drug means a 100 percent chance that someone will die, and the experimental drug drops those chances to 50 percent. The community will certainly never be the same again with the well-known drug. With the experimental drug, it might survive intact.
Flipping the question on its head for a moment, suppose that you were diagnosed with this same disease. The doctors present you with the same two options. The well-known drug gives you a 60 percent chance of survival, the experimental drug gives you a 50 percent chance. Which would you want? The answer there is fairly obvious. Either way, you’re in a bad spot, but sometimes we must pick the least bad of two awful options (I like to call this “picking between messes”) and the well-known drug gives you a better chance at living. Despite the same set of facts, your answer might depend on how you conceptualize the question.
Thankfully in baseball, no one is making life-or-death decisions, but the cultural frame through which we view these decisions can affect how we apply a seemingly cut-and-dried mathematical concept. Baseball—being a game played by humans—is tied up in many of those cultural values and cognitive biases that can lead to decisions that don’t follow the rules of expected value. Sometimes, the mathematically correct decision is the one that feels the worst emotionally, but runs are runs and the scoreboard doesn’t care about how you feel. That leads us to Rule 1A of probabilistic thinking: When you have to make a choice between two strategies before you know the outcome, pick the one with the highest expected value, even if it feels icky.
* * *
In the course of a half-inning, there are three possible numbers of outs that can be on the board (zero, one, or two) and there are eight possible configurations of baserunners (no runners, runner on first, runner on second, runner on third, runners on first and second, etc.). That gives us 24 possible combinations of runners and outs. At the end of every plate appearance, at least one of three things happens: an out is recorded, the configuration of runners changes, or a run scores. Sometimes all three happen on the same play.
Since the object of the game is to score runs, we can look back over a year (2017, in the table below) and calculate how many runs teams scored, on average, when they were in each of those 24 situations.
Table 2. Expected Runs Per Base-Out State, 2017 MLB
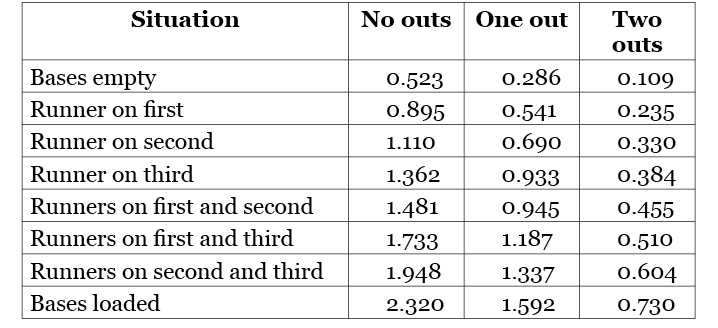
We see that with the beginning of an inning scenario (bases empty and no one out) the average team scored about half a run (0.523). The scoreboard doesn’t record half-runs, but at the beginning of an inning, we don’t know what’s going to happen yet. Now let’s say that the leadoff hitter walks. On average, with no outs and a runner on first, MLB teams scored 0.895 runs. Again, we don’t know what will happen to that runner. He might score. He might be erased on a double play. His team might score three runs. What we do know is that his walk took his team from a situation where we expect them to score 0.523 runs to one where we expect 0.895, for an increase of 0.372 runs to his team’s expected value.
Using the expected-runs table to evaluate strategies was popularized by researchers John Thorn and Pete Palmer in their 1985 book The Hidden Game of Baseball. It led to at least one surprising conclusion. The sacrifice bunt was actually a bad idea. Bunting a runner over from first to second, usually with no one out, has been a staple of baseball strategy since the earliest days of the game. A team trades an out to get the runner into “scoring position” at second base. The run-expectancy matrix tells a different story.
Let’s look at a team with a runner on first and no outs. They could let the batter swing away—we see on the chart that teams scored an average of 0.895 runs in these situations—or they could ask him to bunt the lead runner over, a play which, if it “works”, would put a runner on second with one out. The problem is that looking on the chart for “runner on second, one out” we see that teams averaged only 0.690 runs in 2017. The “successful” sacrifice bunt has made a team 0.205 runs worse off than they had been.
Further research (both that I’ve done and by researcher Mitchel Lichtman, who co-authored The Book: Playing the Percentages in Baseball) found that when we account for the fact that a bunt might actually go for a hit or that the defense might make an error, bunting itself is actually neither a good nor a bad strategy. It’s effectively the equivalent of betting a dollar on a coin flip for the chance to win two dollars, but it’s only because these unexpected bonus outcomes happen occasionally.
There is no question that what is commonly hailed as a success (a sacrifice bunt that retires the batter, but moves the runner) is a failure in the eyes of expected value. The out is more valuable than pushing the runner up a base. Some readers may be having one of those icky moments right now. The sacrifice has long been seen as a noble play in the game. The word “sacrifice” suggests putting the team above individual needs. The rules of the game even carve out an exemption such that even though you made an out, because you made a noble out, the sacrifice doesn’t count as an at-bat (and thus, it doesn’t penalize your batting average). The sacrifice may very well be a noble play, but chivalry points can’t be put on the scoreboard.
* * *
The expected-runs table also provides guidance on another decision. Let’s put our runner back on first base with no outs. Since bunting him over to second is a bad play, perhaps we could have him try to steal second base. Steal attempts are risky. Our runner might make it. He might not. Where is that dividing line between a good and a bad bet?
With a runner on first and no one out, the runner might be safe on his steal attempt, which puts him on second with no outs (run expectancy: 1.110). If we knew for sure that he’d make it, we’d certainly send him, but he might also get caught, which would erase him from the basepaths and put an out on the board (run expectancy: 0.286). Or the third-base coach could communicate the “stay put” sign by touching his head, shoulders, knees, and toes, and lock in a run expectancy of 0.895. How sure do we have to be before it makes sense to send the runner?
We’re going to call that boundary line “p” for the probability that the batter will be safe on his steal attempt. Since there are only two outcomes (safe or out), and we know that the probabilities must add up to 100 percent, we can mathematically express the probability that he will be out as (1–p). A lot of decisions in baseball are yes/no decisions, and so we often use this sort of analysis to figure out where the line between “yes” and “no” should be.
Since we don’t know what p is yet, we’ll have to solve for it using algebra. (I warned you that there would be math!) We can write the problem as:
0.895 = 1.110 * p + 0.286 * (1–p)
We see the expected value for holding the runner at first (0.895) on one side. The other side is the expected runs value for a runner on second and no outs (1.110) times the probability of being safe (p), plus the expected runs value for no runners and one out (0.286) times the probability that would happen (1–p).
Just in case you aren’t reading this with a calculator at your side, solving for p gives us 0.7391, or 73.91 percent. If the manager believes that the runner has a better than 73.91 percent chance of stealing, even if he believes that it’s a 73.92 percent chance, then a steal attempt is a good bet. The runner may get caught this time; he may not, but since we don’t get to know the outcome of the decision before we make it, we have to do the next best thing and pick the strategy with the highest expected value (even if it feels icky). If we do that over and over again, we’ll eventually end up ahead.
* * *
In 2008, Major League Baseball installed a system in every big league ballpark that logged the velocity, spin, break, and eventual landing place of every pitch thrown during every game. They put the data on the internet for anyone to use. It’s hard to overstate how valuable this was to the baseball research community. Before the advent of the Pitch F/X system, there were data on whether pitches had been called a ball or a strike by the umpire, but now there was a public way to check whether the umpire really did need a vision exam.
Naturally, researchers began looking at the strike zone and found that for the most part, umpires did a pretty good job. Eventually, they moved past just looking at the strike zone, and even more interesting things started to come from the data set. Researchers noticed that the strike zone—as it was actually called—was not always a black-and-white proposition for Blue. Balls down the middle were always strikes and balls two feet off the plate were not, but there were gray zones where one umpire might call a ball and another a strike. But eventually, researchers noticed another player in the equation who seemed to be making a big difference: the catcher.
Research by some talented analysts, chief among them Mike Fast and Dan Turkenkopf (both of whom were eventually hired as on-staff researchers by MLB teams), found that certain catchers seemed to be better at getting these edge calls than others.
The effect of this skill, which would come to be called “pitch framing,” was something that might affect one pitch out of a hundred, but the implications for it were rather big. Consider a 1–1 pitch that ends up on the edge of the strike zone. If it’s a ball, the count goes to 2-1 and the batter is ahead in the count. If it’s a strike, the batter is behind. In 2017, when a batter faced a 2-1 count at some point during his time in the batter’s box, he hit .254/.398/.437 during those plate appearances. If he faced a 1-2 count, his performance dropped to .173/.227/.278. That’s a pretty big drop, and through some additional math, we can estimate that turning a ball into a strike is worth about .15 runs to a team.
In 2017, the average Major League game featured 145 pitches per team. That means that over the course of 120 games caught (catchers generally do not play every day), a starting catcher might handle 17,400 pitches. If he can turn 1 percent of those from balls into strikes by catching the ball in such a way as to fool the umpire into calling “strike” rather than “ball,” he has affected 174 pitches. If each is worth 0.15 runs, he has effectively “saved” 26 runs. The key is volume. Because catchers handle so many pitches during the course of a game, even a small effect is going to add up over time, or as my oldest daughter likes to say, “A little plus a little plus a little eventually equals a lot.” Saving 20 extra runs is the equivalent of adding two wins to a team, and it could be done just on this framing skill alone.
It’s helpful here to take a look at some data on how often certain events happen during a season. They represent an “average” team, and can be read either as offensive or defensive opportunities. (For instance, an “average team” has 23,444 pitches that are thrown to their hitters and 23,444 pitches that are thrown by their pitchers.)
Table 3. Seasonal Frequency of Various Events, “Average” Team, 2017 Data
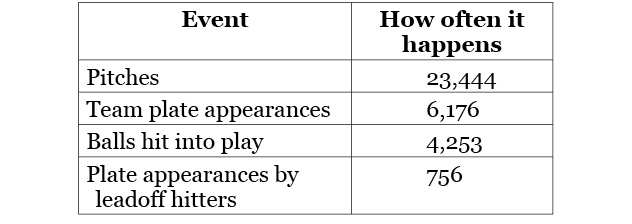
Often, when we think about how a team can make itself better, we think about replacing a bad player with an All-Star. That’s one way to get better, but it’s an expensive one. Signing an All-Star free agent can cost more than the annual gross national product of a small island nation. Even if a hitter played all 162 games and hit in the leadoff spot (the spot in the lineup that comes up most often), he would only affect 12.2 percent of an average team’s plate appearances. He might hit 30 more home runs than the player he replaced, but that’s not the only way to find 30 more home runs. What if it were possible to do something that would make all of the hitters on the team just a little bit better? Maybe each of the nine starters hit one extra home run every other month during a season. That’s 27 home runs right there.
Our second rule of probabilistic thinking is that a small effect, repeated over and over again, can be as important as a large change that happens once. If we find something that affects players in something that they do regularly, we can generate significant value, sometimes without having to spend a dime more than we had been.
* * *
I started high school in 1994, the same year that the Cleveland Indians opened Jacobs Field. That year, the Indians introduced their new acrobatic, charismatic, Venezuelan shortstop. Omar Vizquel was a joy to watch on the field for the decade that he called Cleveland home. He had a penchant for grabbing bounding balls with his bare hand and throwing to first to nab a disbelieving runner who thought he had a hit. There were double plays that he turned worthy of a Cleveland Ballet audition tape, if only the Nutcracker were allowed to throw baseballs to the Sugarplum Fairy. Vizquel gained a reputation as one of the best fielding shortstops in the game during his time in Cleveland and perhaps as one of the best of all-time, and for years, I assumed that I had been witness to history back in my high school days. Vizquel spun a highlight reel like no one else could.
To my horror, I eventually discovered that he was merely an above-average defender during the years in which I watched him. It’s an odd curse to call someone “merely above average.” It means, by definition, that there are more people who are worse than you than are better, but in United States culture, it’s come to be a synonym for “entirely forgettable.” There was no forgetting Vizquel. How could a man with a reputation as the Hank Aaron of shortstop defense be anything less than the best? Perhaps an imprecise but instructive analogy would be helpful here.
I went to an all-male, Catholic high school. For reasons that have never been fully explained to me, the school, despite having a female enrollment of zero, had a yearly election of a Homecoming Queen. The candidates were all from one of the three local all-female Catholic high schools. During the school year, the young women from these “sister schools” were welcome to be part of the St. Edward marching band, plays, pit orchestra, and cheerleading squad. There were also community service projects and retreats that the schools would jointly sponsor. The Homecoming Queen was supposed to be the young woman who had contributed the most to the school, presumably through these avenues. The voters for the honor were the members of the senior class (read: a bunch of 17-year-old boys). Let’s just say I don’t believe that “contributed the most to the St. Edward community” was always the deciding factor for who ended up as Homecoming Queen. Perhaps other, less noble, concerns were taken into account.
If we had wanted to get a good idea of which young woman had really contributed the most to the school, we might measure things like how many hours she spent on activities sponsored by the school or how many leadership positions she had taken in those organizations in the past four years. We’d need a record of everything that she did and didn’t do during her time in high school, the way that we have a record of just about everything done on a baseball field, strecthing back for several decades. The creepily obsessive nature with which data about baseball games are collected only becomes apparent when you imagine the same level of detail being applied to other areas of life.
Because of that obsessive data collection, we have a pretty good record of what happened when Omar Vizquel was on the field throughout his career, including data about how many ground balls (and pop-ups and line drives) were hit in his general direction and how many of those eventually turned into outs. While Vizquel made plenty of plays that are fun to watch again and again, those highlights were worth the same as any routine looking 6-3 groundout. His actual job was not to create content for SportsCenter, but to log as many of those 6-3 groundouts as possible. If Vizquel converted grounders (and pop-ups and line drives) into outs at a higher rate than the rest of the league, then he could be considered above average for that season. We can even put a run expectancy value on that.
The website Baseball Reference keeps a statistic, based on the work of researcher Sean Smith, that does this very calculation. Prior to coming to the Indians, Vizquel spent five seasons (ages 22–26) with the Seattle Mariners, and had posted “runs saved” totals (where zero is average) that rated him as “pretty good.” But once Vizquel came to Cleveland in 1994, his performance was…well, merely above average. He manned the shortstop spot for 11 years in Cleveland (in what were his ages 27–37 seasons), where he gained a reputation as the second coming of the other noted paragon of shortstop defense, Ozzie Smith. Except that the data tell a different story.
Here are Vizquel’s numbers from Baseball Reference during his years as a shortstop, compared to the same aged seasons for Smith and another well-known shortstop (though not for his defense) from that era, Cal Ripken.
Table 4. Omar Vizquel vs. Ozzie Smith and Cal Ripken, Runs Saved on Defense
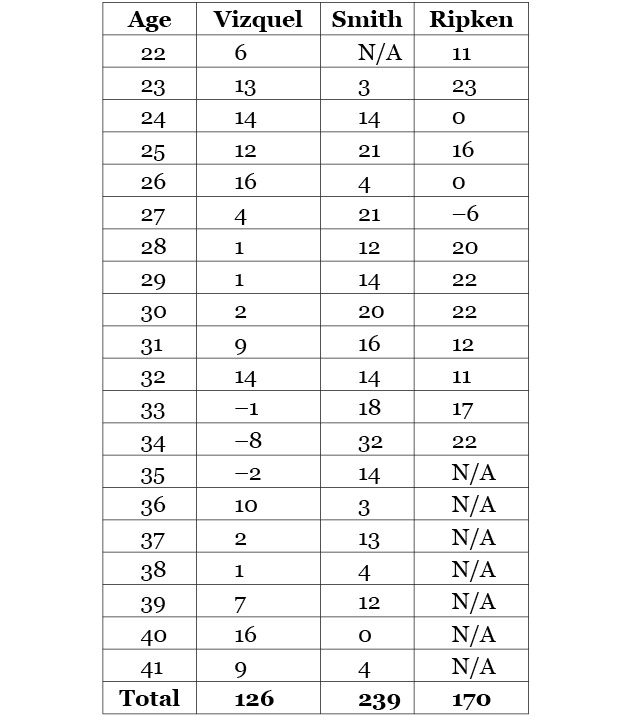
(Note: Smith did not make his MLB debut until age 23 and retired after his age 41 season; Ripken moved to third base in his age 35 season; Vizquel became a utility player at age 42)
A clear-eyed look at the data shows that Omar Vizquel, over his career, was barely half of Ozzie Smith defensively. He wasn’t even the equal of Cal Ripken, and had more seasons at shortstop than Ripken in which to make his mark. Vizquel should be credited for the fact that he played a non-embarrassing version of shortstop into his forties, and his full body of work in the field was good, but it wasn’t Hall of Fame–level special. How can a man who was magic with a ball in his hand not actually be an elite defender? That can be summarized in our third rule of probabilistic thinking in baseball: When making an evaluation, we need to pay attention both to what happens and what doesn’t happen.
Vizquel had a weakness, or at least a relative weakness. While he really was a magician once he snared the ball, first he had to get to the ball. In 2017, 87.8 percent of ground balls that a shortstop managed to field were eventually converted into outs (some turned into infield hits, some into errors), which suggests that just “getting there” is most of a shortstop’s job. What the data show are that when a ground ball was hit in Vizquel’s area, he was merely above average in getting over to it before it went into either left or center field. Vizquel was often compared to Smith on the basis of his ability to make acrobatic plays, but the Wizard of Oz covered more ground and that—not the high-flying jumps and did-you-see-that throws—is what made him an elite defender.
We don’t often think of defense in this way because it’s hard to think of the plays that a fielder doesn’t make. It’s common to see a ground ball that is smacked through the left side that the shortstop can’t quite catch up with. We don’t instinctively fault him for not getting there because no one gets to all of them. What if he had moved a little more quickly and had gotten to that ball? The difference between an elite shortstop and a merely above-average one might be one extra ball out of perhaps 15 or 20 that he converts into an out, perhaps a ball or two per week. Even if you watch all the games it’s hard to pick out the ball that the elite shortstop fields successfully that would have been out of range of the merely above-average shortstop. It’s much easier to count the amazing dives and leaps.
A lot of the problem has to do with the way that baseball is shown on television. By the time the camera switches to the shortstop on a ball where he might have a play, we see the last few steps of his run and either the ball bounding into his glove or skipping past him. We don’t see where he started from, nor how quickly he reacted, so we have no reference point to see how much ground he was able to cover. We do see it if he boots the ball or botches the throw or if he makes an astounding diving stop, and we instinctively fault or credit him for those. Those are things that he did. It’s hard to see the groundout that didn’t happen, but over the course of a season, those base hits that could have been outs can add up.
While Vizquel may have excelled in making shortstop play fun to watch, he was merely good at the most important job of a shortstop, which was the boring work of preventing balls from getting into the outfield. It’s ranging over and making a routine-looking play on a ball that another shortstop might have to dive for, because he wasn’t quick enough to get there otherwise. (The lesser shortstop will be on the highlight reel because of his weakness.) Like my high school classmates, we should have been paying attention to the routine things that were hard to see instead of voting for what looked the prettiest.
* * *
Baseball is a game of inches played at insane speeds. It takes a 90 mph fastball roughly 400 milliseconds (four tenths of a second) to go from the pitcher’s hand to home plate. It generally takes the human brain about 200 milliseconds to respond to a stimulus, and sometimes even longer. Psychologists who study cognitive processing know that within the same person, it’s possible to see variation. Sometimes, people are a little faster and sometimes a little slower. Sometimes there’s no discernible reason. Even a lag of 50 extra milliseconds—something that is literally less than the blink of an eye—takes away a quarter of the actionable time that a hitter has to produce the correct response to that fastball.
Baseball is a game with an asymmetry not found in many other sports. In games like football and basketball, both teams are trying to win possession of the ball, because it’s the only way that they are able to accomplish their goal of scoring. In games like volleyball or tennis, both teams or players are trying to dispose of the ball in an approved manner (e.g., over the net, inside the lines). But in baseball, we have one player (the batter) who is actively trying to dispose of the ball while another team (the defense) is actively trying to gain possession of the ball as quickly as they can.
Baseball is a game of brute strength. Consider the incentives inherent in hitting a baseball. If the batter hits the ball far enough, he will exceed the boundaries of the field, and his reward is a home run. In other games where balls are hit or thrown, propelling the ball beyond the edge of the field is usually a foul or a turnover or results in a point for the other team. Tennis players do not simply smack the ball as hard as they can. They must try to place the ball so that it falls within the lines on the other side. In baseball, even if you don’t hit the ball over the wall, the batter still wants to hit the ball far away from the area where he will do the next part of his job, the running of the bases. The further that he can move the ball away from that area, the better. If the ball falls outside the other set of boundaries, the foul lines, the penalty is relatively minor, and sometimes nothing. In baseball, there is little incentive to steer the ball to a specific place or even a specific area. It’s not that hitters don’t try to pull the ball, but the resolution that they have in mind is much more “leftward third of the field” rather than “this one specific spot, about 80 feet away from where the left fielder is standing.”
Baseball is a game of colliding objects. There are plenty of games which essentially come down to collision physics, although in many of them (billiards, golf), the ball has the courtesy to stand still while the human playing the game tries to hit it with a stick. In baseball, hitters are trying to play billiards, only the cue ball is traveling fast enough to be charged with reckless driving. More than that, for a ball traveling that fast, the baseball itself is comparatively small, as is the circumference of the stick used to hit it. With a small bat, a small ball, and the pitcher trying to make the ball move in ways that surprise the batter, it means that there’s a lot of room for error in trying to predict the angle at which the ball meets the bat. A matter of inches in where ball and bat collide separates a line drive from a pop-up.
Baseball is a game where the inches matter in strange ways. Inches do matter in other sports. A basketball player’s job is to place the ball in the approved cylinder and if he is off by a couple of inches, it’s the difference between making and missing his shot, but in basketball, the player’s entire job is to aim the ball correctly. Baseball is one of the few games in which aiming—at least when hitting—isn’t a valued skill. The physics and neuropsychology of the act don’t permit much of it. As a result, teams have, since the beginning of the game, used a defensive strategy of spreading out the defenders and spacing them some distance apart so as to cover as much room on the field as they can. This means that there will be portions of the field that aren’t covered (the field is too big for nine men to cover the whole thing), but those pockets of safety are at random intervals. If hitters could aim better, they would of course try to drop the ball into those safe zones, but for the most part, they can’t. They can only try to make solid contact, followed by hope. The fundamental unfairness of baseball is that there is a great deal of uncontrolled variation in where the ball lands, and that randomness can be the difference between a base hit and a pop-out.
Baseball is a game where sometimes you do everything right and it doesn’t work. (My mother likes to say this about life more generally.) We recognize that the rules of the game incentivize solid contact. We realize that when Smith hits a line drive right at the shortstop, he did exactly what he was supposed to do and that his bad aim was mostly bad luck. We realize that when Jones hits a weak flare that just happened to find one of those Swiss cheese holes, he is standing on first only because he got a bit lucky. But the numbers that we usually use to describe the game don’t tell that story and the scoreboard doesn’t care. Smith is 0-for-1 and Jones is 1-for-1. Before I knew the outcome, I’d rather have Smith’s line drive than Jones’s pop-up, but sometimes randomness turns all notions of fairness upside down.
Baseball is a game where it pays to understand the difference between process and outcome and between talent and luck. There’s a taboo in sporting culture around acknowledging the role that luck plays in the outcome of a play or a game or a season. Teams whose players suffer freak injuries “don’t want to use the injuries as an excuse.” Perplexed sportscasters looking at an event that was improbable—though entirely possible—will often resort to clichés about a player or a team that “wanted it more” that sound silly if we would take but five seconds to reflect on them. Apparently, there are players who have dedicated their entire lives to the pursuit of one thing, and when given the chance to achieve it, they decide not to give 100 percent effort.
Why fear the truth? There are a lot of things that can happen on a baseball field. The worst teams in the league routinely win 40 percent of their games. Things happen because sometimes the dice just come up the wrong way. The most you can do in baseball (and life) is to understand what things make it more likely that the outcome will end up in your favor, but then live with the reality that “more likely” is not a guarantee of anything. In baseball, we have to live with the fourth rule of probabilistic thinking. Sometimes you do everything right and it doesn’t work.